Abstract
Violet-blue light is toxic to mammalian cells, and this toxicity has been linked with cellular production of H2O2. In this report, we show that violet-blue light, as well as UVA, stimulated H2O2 production in cultured mouse, monkey, and human cells. We found that H2O2 originated in peroxisomes and mitochondria, and it was enhanced in cells overexpressing flavin-containing oxidases. These results support the hypothesis that photoreduction of flavoproteins underlies light-induced production of H2O2 in cells. Because H2O2 and its metabolite, hydroxyl radicals, can cause cellular damage, these reactive oxygen species may contribute to pathologies associated with exposure to UVA, violet, and blue light. They may also contribute to phototoxicity often encountered during light microscopy. Because multiphoton excitation imaging with 1,047-nm wavelength prevented light-induced H2O2 production in cells, possibly by minimizing photoreduction of flavoproteins, this technique may be useful for decreasing phototoxicity during fluorescence microscopy.
It is well known that UV radiation is toxic to living organisms. Less recognized or understood is that toxicity can be induced by visible light. Specifically, violet (400–450 nm) and blue (450–490 nm) light are known to cause mutations and even death of cultured mammalian cells at irradiation doses of 2–6 J/cm2 (1–8), which is equivalent to 5–10 min of direct sunlight (9). Although most human cells are protected from sunlight by physical barriers (skin, hair, clothing), clinical pathologies resulting from intense sources of violet-blue light have been reported, e.g., solar retinopathy (10, 11) and erythropoietic protoporphyria (12, 13). Recent evidence indicates that intense violet light can also induce cutaneous malignant melanoma in animal models of human skin cancer (14, 15). Because humans are exposed to many sources of intense violet-blue light (e.g., sunlight, sunbeds, lasers, welding arcs, halogen lamps), it is important to understand the cause of this toxicity.
Previous studies have shown that irradiation of mammalian cells with violet or blue light induced H2O2 production and DNA damage (1–8, 16–25). Catalase and other antioxidants prevented this damage, indicating that H2O2 production was a critical, early step in the process. These studies did not investigate the source of H2O2 or the underlying mechanism of production. Because of its critical role, we have investigated the subcellular source and possible molecular events involved in H2O2 generation in three cell types grown in culture: mouse fibroblasts (NIH 3T3 cells), African green monkey kidney epithelial cells (CV1 cells), and human foreskin keratinocytes (HK cells). Our results demonstrate that violet-blue light stimulated H2O2 production in peroxisomes and mitochondria and that a likely mechanism of production was activation of flavin-containing oxidases.
MATERIALS AND METHODS
Cell Cultures.
3T3 and CV1 cells were cultured in flasks containing DMEM (GIBCO) supplemented with 10% fetal calf serum (GIBCO), glutamine (2 mM, Sigma), sodium bicarbonate (3.7 mg/ml, Sigma), penicillin (100 units/ml, GIBCO), and streptomycin (100 μg/ml, GIBCO). HK cells were cultured in a defined, serum-free medium (keratinocyte-SFM, GIBCO). Cultures were kept at 37°C in a humidified incubator (Napco, Tualatin, OR) aerated with 10% CO2. Cells were transferred once a week by using trypsin (0.25%, GIBCO). For experiments, cells (105 per ml) were plated onto glass coverslips (no. 1; Fisher) and cultured 1–3 days in growth medium. Before experiments, medium was replaced with saline (130 mM NaCl/5.4 mM KCl/2 mM MgCl2/2 mM CaCl2/25 mM glucose/10 mM Hepes, pH 7.3). Cells were routinely shielded from room lights and viewed under brightfield microscopy through a red filter (605 LP, Melles Griot, Irvine, CA). All experiments were performed at room temperature (20–22°C).
Irradiation.
Cells were irradiated through the epi-illumination port of an inverted fluorescence microscope (Nikon Diaphot) by using a 75 W xenon arc lamp and interference filters (Chroma Technology, Brattleboro, VT). Light was delivered through a ×20 (Ph2, 0.4 numerical aperture, Nikon), ×40 oil (Fluor, 1.3 numerical aperture, Nikon), or ×100 oil objective (Plan, 1.25 numerical aperture, Nikon), and intensities were further adjusted by using neutral-density filters. The following interference filters were tested: UVA (375–385 nm), violet (400–410 nm), violet-blue (445–455 nm), blue (450–490 or 485–495 nm), green (495–505 or 500–560 nm), orange (550 long-pass filter), and red (590–650 nm or 605 long-pass filter). Irradiance was quantified by using a calibrated radiometer and probe (model S370, United Detector Technology, Santa Monica, CA). Temperature changes during irradiation were measured with a thermocouple microprobe (Physitemp, Clifton, NJ) and increased by <1°C even at high intensities.
Cytochemical Detection of H2O2.
Modification of a classical histochemical stain for H2O2-dependent enzymes was used (26, 27). Live cells were irradiated in the presence of substrate [(3-amino-9-ethylcarbazole (AEC) or 3,3′-diaminobenzidine (DAB)] but without exogenous H2O2. Reaction product (polymerized substrate) was expected wherever H2O2 was produced in proximity to endogenous catalase, peroxidase, and/or oxidase (28). DAB stock solution (10 mg/ml; Electron Microscopy Sciences, Ft. Washington, PA) was prepared in DMSO (Aldrich) and diluted 1:1,000 in saline for use. AEC stock solution (3%, Sigma) was prepared in N,N-dimethylformamide (Sigma), diluted 1:3,000 in saline, allowed to equilibrate for 10 min, and filtered before use. Results were photographed under brightfield microscopy by using an image acquisition system (BioVision, Perceptics, Knoxville, TN). The specificity of the response was tested in cells pretreated for several hours at 37°C in medium containing one of the following chemicals (Sigma): horseradish peroxidase (125 units/ml), catalase (1,000 units/ml), vitamin C (1 mM), 3-amino-1,2,4-triazole (10 mM), or KCN (1 mM).
Electron Microscopy.
Immediately after irradiation in DAB solution, cells were fixed for 10 min in 2% glutaraldehyde in saline, rinsed, postfixed for 30 min in 1% osmium tetroxide, rinsed, dehydrated in a graded ethanol series, stained enbloc with 3% uranyl acetate/95% ethanol for 30 min, infiltrated, and embedded in Epon 812. Thin sections (70 nm) were cut on a Reichert Ultra-cut E ultramicrotome, poststained with Reynold’s lead citrate for 7 min, and viewed with a Philips CM120 scanning transmission electron microscope (TEM). Some samples were prepared without uranyl acetate and lead citrate staining and viewed with an energy-filtering TEM (EFTEM, Zeiss Omega 912).
Fluorescence Detection of H2O2.
Cells were loaded with nonfluorescent, membrane-permeable derivatives of dihydrofluorescein (DHF) that fluoresce when oxidized by H2O2 through enzymatic and nonenzymatic pathways (29–33). Stock solutions of dye were prepared in DMSO and diluted 1:1,000 in saline for use. Cells were incubated at room temperature in either 60 μM DHF diacetate (DHF-DA) (Molecular Probes) for 15 min, or 37 μM 6-carboxy-2′,7′-dichlorodihydrofluorescein diacetate di(acetoxymethyl ester) (C-DCDHF-DA-AM) (Molecular Probes) for 1 hr. Coverslips were rinsed to remove excess dye, mounted on the stage of an inverted epifluorescence microscope, and examined by using conventional, one-photon fluorescence techniques (33). Fluorescence was excited by using the same light that induced cellular production of H2O2. Fluorescence was collected through a dichroic mirror (510 LP) and interference filter (520 LP) onto a 12-bit cooled charge-coupled device camera (Photometrics, Tuscon, AZ). Time-resolved fluorescence was measured by capturing sequential images every 2 or 6 sec. Intensity levels were analyzed by using image analysis software (Oncor) and graphed by using Microsoft excel software. Intensity values were plotted as means per pixel (±SD) for three fields of cells. Differences were evaluated by using a two-tailed Student’s t test.
For some experiments, cells were stained with 10−6 M MitoTracker Red (Molecular Probes) for 1 hr at 37°C followed by DHF-DA loading. MitoTracker was imaged by using rhodamine optics.
Transfected Cell Lines.
Acyl-CoA oxidase (AOX) cDNA was prepared and transfected into CV1 cells as described (34). In brief, full-length rat peroxisomal AOX cDNA was cloned into the EcoRI–SmaI site in a eukaryotic expression vector pCMV-5 under transcriptional control of the cytomegalovirus promoter. The recombinant plasmid pCMV5-AOX was harvested and transfected into CV1 cells by using the vector Neor, which encodes the gene for neomycin resistance. Verification of AOX expression was confirmed by Northern and immunoblot analyses. Xanthine oxidase (XO) cDNA was prepared and transfected into CV1 cells by using a similar strategy.
Multiphoton Excitation (MPE) Microscopy.
A custom-built MPE microscope was used, as described (35). Excitation was provided by a solid state neodymium-doped yttrium lithium fluoride laser (Microlase, Strathclyde, Scotland) emitting at 1,047 nm with a pulse width of 175 fsec and repetition rate of 120 MHz. The laser beam was directed through a Bio-Rad scan head (MRC 600) coupled to an inverted Nikon microscope (Diaphot Quantum) with a ×40 Plan Fluor oil-immersion objective (1.3 numerical aperture, Nikon). Images were aquired by using Bio-Rad comas software, and fluorescence intensity was analyzed as described above. Average beam intensity of the laser at the sample was 20 mW, and samples were scanned at 0.75 sec per image.
RESULTS AND DISCUSSION
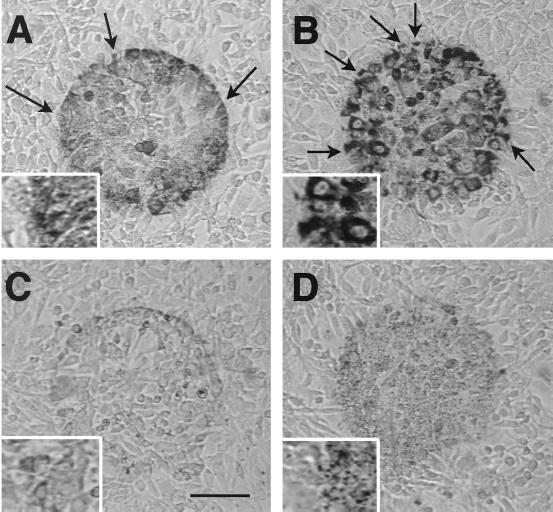
Figs. 1 and 2 display results with the cytochemical method of detecting H2O2 in 3T3 cells, although similar results were obtained by using CV1 and HK cells. When irradiated with blue light in the presence of either AEC or DAB, cells developed a moderately dark reaction product (Fig. 1A). UVA or violet light also induced staining, but not green, orange, or red light. Staining was enhanced in cells pretreated with peroxidase or catalase (Fig. 1B), but it was substantially reduced in cells that were either chemically fixed (Fig. 1C) or pretreated with vitamin C (Fig. 1D). Staining also was reduced in cells pretreated with the catalase inhibitor 3-amino-1,2,4-triazole or the cytochrome oxidase inhibitor KCN, suggesting that peroxisomes and mitochondria were involved (27).
Figure 1.
Cytochemical detection of H2O2 production in 3T3 cells. Cells were irradiated with blue light (450–490 nm at 6.3 W/cm2) for 20 min in saline containing AEC followed by thorough washing to remove large nonspecific crystals. (A) In normal saline, irradiated cells (circular area) displayed moderately dark reaction product (polyAEC) with a punctate distribution. (B) In cells pretreated with catalase, staining was darker and clearly localized in the cytoplasm. (C) Staining was markedly attenuated in cells fixed for 1.5 hr in buffered 4% paraformaldehyde solution before irradiation. (D) Staining was reduced and punctate in cells pretreated with vitamin C. Arrows denote cells with partial staining. [Bar = 100 μm and 50 μm (Inset).]
Figure 2.
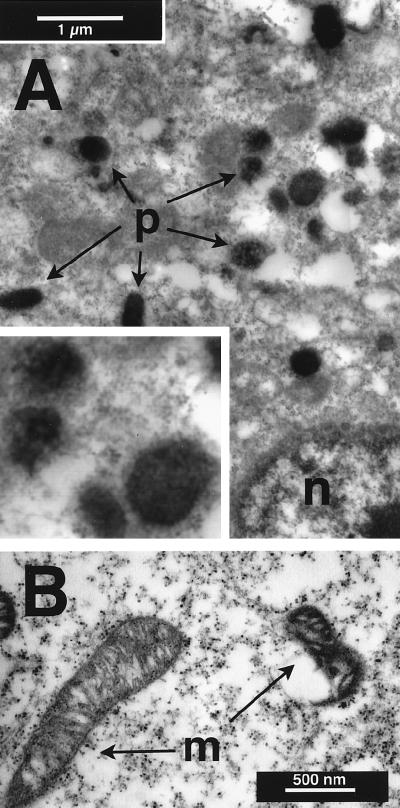
Ultrastructural localization of DAB reaction product (polyDAB) in 3T3 cells fixed and stained with osmium after irradiation with blue light (450–490 nm at 6.3 W/cm2) for 40 min. Staining was distributed uniformly within peroxisomes (p in A), whereas it was concentrated in the inner and outer membranes of mitochondria (m in B). Inset in A is ×2 magnification.
At higher magnification, staining appeared to be associated with organelles (Fig. 1, Insets), and this was confirmed by using electron microscopy. Irradiated cells displayed extensive vacuolization and lacked cytoplasmic detail compared with nonirradiated cells. Nevertheless, reaction product was localized in peroxisomes (Fig. 2A) and mitochondria (Fig. 2B), the latter being consistent with the “background” staining reported in fixed cells exposed to DAB and light (36). Staining persisted when counterstains (uranyl acetate and lead citrate) were omitted and viewed with EFTEM. Peroxisomal staining was enhanced when cells were irradiated in alkaline saline (pH 8), and mitochondrial staining was enhanced in acidic saline (pH 6), as reported for fixed tissues (27).
The cytochemical results are consistent with the possibility that H2O2 originated in mitochondria and peroxisomes. This possibility was not unequivocal, however, because the method of detection depended on enzymes that are often concentrated in these organelles (26–28). Therefore, it is conceivable that H2O2 originated elsewhere and diffused into the organelles catalyzing reaction product. The sharp borders between stained and unstained cells, as well as within individual cells (arrows in Fig. 1 A and B), indicated that diffusion of H2O2 was limited.
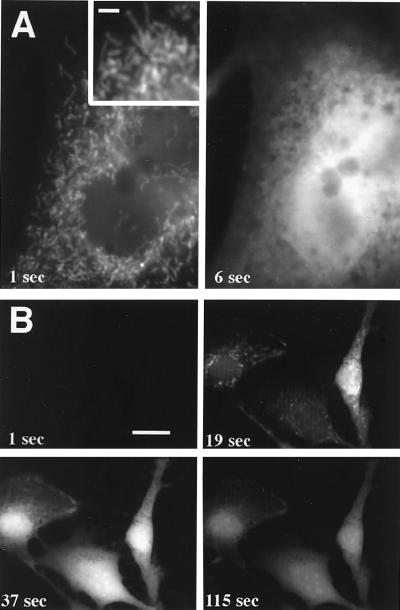
Direct evidence that light stimulated H2O2 production in peroxisomes and mitochondria was obtained by using fluorescence microscopy. The involvement of mitochondria was discovered by using the probe DHF-DA, which crosses mitochondrial membranes when deesterified to DHF (37). When DHF-loaded cells were irradiated with blue or violet-blue light, they responded with a uniform increase in fluorescence that obscured subcellular structures. If irradiated cells were pretreated with vitamin C to dampen the cytoplasmic response, then it was apparent that fluorescence was generated in the mitochondria (Fig. 3A, Left), i.e., worm-like structures that also stained with MitoTracker Red, a mitochondria-specific dye (38). With sustained irradiation, fluorescence spread from the mitochondria to the cytoplasm, overwhelming the antioxidant capacity of vitamin C. After several seconds, fluorescence was brightest in the vicinity of nuclei (Fig. 3A, Right) probably because of the greater thickness of, and hence more dye in, this region. Irradiation at lower intensities produced the same pattern of response, albeit slower and less intense (Fig. 3B).
Figure 3.
Detection of H2O2 production in 3T3 cells by using conventional (one-photon) fluorescence microscopy. Cells were pretreated with vitamin C, loaded with DHF-DA, and irradiated with blue light (485–495 nm) at either 1 W/cm2 (A) or 0.2 W/cm2 (B). (A) After 1 sec of irradiation (Left), fluorescence emanated from mitochondria, worm-like structures (Inset) dispersed throughout the cell. After 6 sec of continuous irradiation (Right), fluorescence was diffuse and brightest around or within the nucleus. (B) Fluorescent responses developed more slowly when irradiated at lower intensity. [Bar = 2 μm (A), 1 μm (A Inset), and 20 μm (B).]
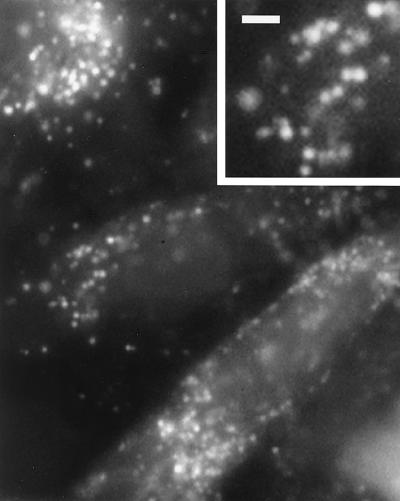
The involvement of peroxisomes was discovered by using the probe C-DCDHF-DA-AM. When cells were loaded with this probe along with vitamin C and irradiated with blue light, they generated fluorescence in small spherical organelles (Fig. 4). These organelles did not stain with MitoTracker, and they were concentrated around nuclei. We presume these organelles were peroxisomes, based on our ultrastructural results, their perinuclear location, and the fact that similar structures displayed immunoreactivity with antibodies against AOX (34), a peroxisomal protein. As with DHF-loaded cells, sustained irradiation generated fluorescence that eventually spread throughout the cells.
Figure 4.
Fluorescent image of CV1 cells loaded with vitamin C and C-DCDHF-DA-AM and irradiated with blue light (485–495 nm at 2.3 W/cm2). Fluorescence was localized in small, spherical organelles, which were most likely peroxisomes (see text). [Bar = 2 μm and 1 μm (Inset).]
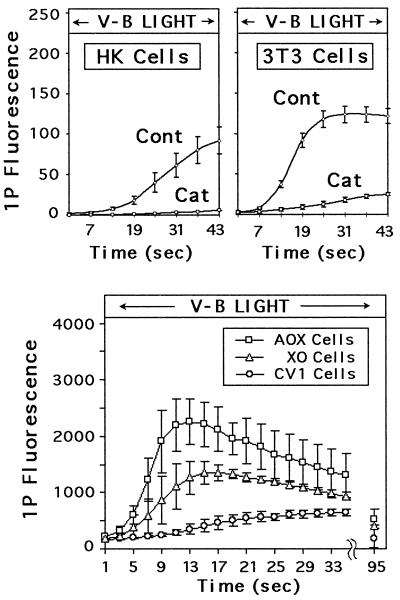
The selectivity of the fluorescent response for H2O2 was evaluated by using cells pretreated with catalase. Excess catalase was washed off before dye loading to prevent interactions with the dye (32), and low irradiance levels were used to enable more accurate quantization. Results for 3T3 and HK cells are shown in Fig. 5 (Upper) and reveal a marked suppression of fluorescence by catalase. This result, together with the insensitivity of DHF derivatives to superoxide (30, 32) and hydroxyl radicals (30), indicated that most, if not all, of the response was coupled to H2O2 generation.
Figure 5.
Fluorescence was reduced in catalase-treated cells and enhanced in AOX- and XO-transfected cells. Cells were loaded with C-DCDHF-DA-AM and irradiated with violet-blue light (445–455 nm) at 1.6 W/cm2 (Upper) or 5.3 W/cm2 (Lower) during the time indicated. (Upper) Average response of HK and 3T3 cells (Cont) was significantly reduced after preincubation in catalase (Cat). (Lower) AOX- and XO-transfected cells produced significantly larger responses than nontransfected cells (note difference in scale between Upper and Lower graphs).
We next investigated the hypothesis that violet-blue light induced H2O2 generation in mitochondria and peroxisomes by activating flavin-containing oxidases. The involvement of these enzymes in phototoxicity has long been suspected (39), but never directly tested. The hypothesis has gained increasing support over the years from several lines of evidence. Flavin-containing oxidases are concentrated in peroxisomes and mitochondria (28, 40), and they absorb throughout the UVA-blue spectrum, with peaks at 370 and 450 nm (41). On excitation to a triplet state by UVA-blue light, flavins (FAD and FMN) and flavoproteins can be reduced by cellular reducing agents (41–44), which then can result in the production of H2O2 (44–47).
We tested this hypothesis by using CV1 cells stably transfected with an expression vector for one of two flavin-containing oxidases, AOX and XO. Whereas AOX is localized in peroxisomes, XO is predominantly cytoplasmic (40). Previous studies demonstrated that AOX-transfected cells generated more H2O2 than nontransfected cells when stimulated with linoleic acid (34). As shown in Fig. 5 (Lower), both AOX-transfected and XO-transfected cells generated significantly more light-induced H2O2 than nontransfected cells.
During sustained irradiation, we noticed that fluorescence invariably declined (Figs. 3B and 5, Lower). This decrease was, most likely, because of photobleaching of the fluorophore rather than decreased production of H2O2, based on several considerations: conversion of DHF derivatives to fluorescein is not thought to be a reversible process; discontinuation of irradiation halted the decline of the signal; photobleaching of native fluorescein displayed a similar time constant under comparable conditions (48); and no decrease was observed when cells were imaged by using MPE microscopy (49).
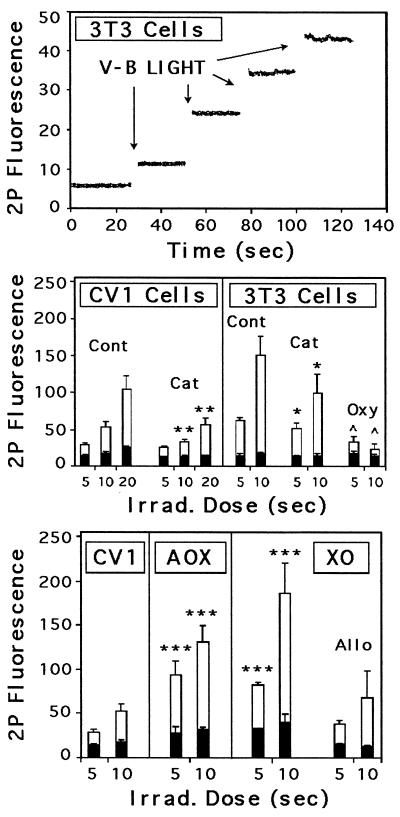
Besides preventing photobleaching, MPE imaging offered several other advantages over conventional one-photon imaging. First, as shown in Fig. 6 (Top), MPE imaging at 1047 nm did not induce measurable production of H2O2 in cells. Second, periodic exposure to violet-blue light induced a step increase in fluorescence (Fig. 6, Top) consistent with the expected photochemistry of the probe. Third, the total excitation volume seen when using MPE is relatively small and fixed (≈1 μm3 under our conditions); thus, concern that differences in fluorescence signals arose from differences in cell thickness was minimized. Given these advantages, we repeated the catalase and mutant cell experiments with MPE imaging. The results, shown in Fig. 6 (Middle and Bottom), provide further evidence that the fluorescent responses were dependent on H2O2 and flavin-containing oxidases.
Figure 6.
Fluorescent responses measured with MPE (two-photon) imaging. Cells were loaded with C-DCDHF-DA-AM and imaged before and after irradiation with violet-blue light (445–455 nm at 1.6 W/cm2). (Top) 3T3 cells irradiated for 1 sec on four consecutive occasions displayed step increases in fluorescence without subsequent photobleaching. (Middle) Average responses of CV1 and 3T3 cells (Cont) were reduced by catalase treatment (Cat). Oxyrase (Oxy) was also effective at suppressing the response. The residual response in catalase-treated cells may reflect radical generation, insufficient catalase, or both. (Bottom) Average responses of AOX- and XO-transfected cells was significantly larger than in nontransfected CV1 cells. The response of XO-transfected cells was reduced to control levels by 200 nM allopurinol (Allo). P values are 0.1 (∗), 0.02 (∗∗), 0.005 (∗∗∗), and 0.001 (∧∧). Black bars represent basal levels of fluorescence because of autooxidation of the dye.
The specificity of MPE signals was examined further by using inhibitors of dioxygen and XO. Oxyrase, a complex of respiratory enzymes used to lower dioxygen levels in solution (50), suppressed the fluorescent response of 3T3 cells (Fig. 6, Middle) demonstrating a dependence on molecular oxygen. Allopurinol, an XO inhibitor (51), reduced the light-induced response of XO-transfected cells to control levels (Fig. 6, Bottom). The residual signal in allopurinol-treated cells suggests that other oxidases were involved in the light-induced generation of H2O2 in transfected and nontransfected cells. Background levels of fluorescence because of autooxidation of dye (Fig. 6, Middle and Bottom) also were enhanced in transfected cells and reduced in catalase-treated cells. This may reflect metabolic production of H2O2 which, over time, could provide another source of toxicity (52).
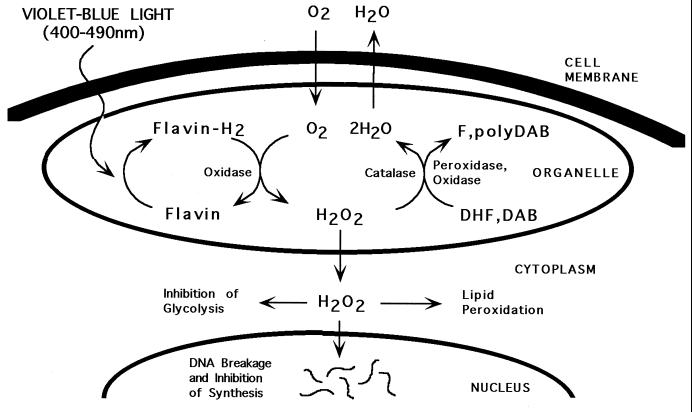
In summary, our results are consistent with the model diagrammed in Fig. 7, which proposes that violet-blue light (and probably UVA) initiates photoreduction of flavins, which activates flavin-containing oxidases in mitochondria and peroxisomes, resulting in H2O2 production. This, in turn, stimulates oxidation of the indicator dyes by endogenous peroxidases (26, 31, 32) and oxidases (28, 32). Catalase, which can oxidize AEC and DAB (27, 28), competitively inhibits oxidation of the DHF derivatives (30, 32) by directly metabolizing H2O2 to H2O and O2. When production of H2O2 exceeds its catabolism within the organelles, it diffused into the cytoplasm, where it stimulates additional reduction of dye by cytoplasmic enzymes. The possibility that flavins and flavoproteins in the cytoplasm also contribute to the response cannot be ruled out.
Figure 7.
A model depicting the molecular events underlying light-induced H2O2 production and detection in cells. The process is initiated by photoreduction of flavins and/or flavin-containing oxidases within peroxisomes and mitochondria (and probably cytoplasmic sites as well) resulting in H2O2 production. Endogenous peroxidase and oxidase enzymes subsequently convert H2O2 to water coupled with oxidation of DHF and DAB to fluorescein (F) and polyDAB, respectively. Catalase, which can also oxidize DAB to polyDAB, converts H2O2 to water and dioxygen. The latter apparently competes with oxidation of DHF derivatives. When the level of H2O2 exceeds enzymatic activities, it diffuses into the cytoplasm where additional dye reduction occurs. H2O2 and its metabolite, hydroxyl radicals, may produce toxicity through genetic mutation, inhibition of glycolysis and DNA synthesis, and lipid peroxidation.
The toxic consequences of increasing H2O2 and its metabolite, hydroxyl radicals, in cells are well known and include genetic mutation (16–25), inhibition of glycolysis and DNA synthesis (53, 54), and lipid peroxidation (55). These effects may contribute to pathologies associated with exposure to intense UVA and violet and blue lights (10–15, 56). These effects may also contribute to toxicity often encountered during light microscopy (57). Because MPE imaging with 1,047-nm wavelengths prevented light-induced H2O2 production in cells, this technique may be useful for decreasing phototoxicity during fluorescence microscopy. Incubating cells in antioxidants, like catalase and vitamin C, may also prove beneficial.
Acknowledgments
We thank Ram Parshad (Howard University) and David Wokosin (University of Wisconsin) for helpful discussions and suggestions. This research was supported in part by the National Institutes of Health (RR00570 to J.G.W. and GM23750 to J.K.R.) and the Whitaker Foundation (P.E.H.).
ABBREVIATIONS
- AEC
3-amino-9-ethylcarbazole
- AOX
acyl-CoA oxidase
- DHF
dihydrofluorescein
- C-DCDHF-DA-AM
6-carboxy-2′,7′-dichloroDHF-DA di(acetoxymethyl ester)
- DAB
3,3′-diaminobenzidine
- DHF-DA
dihydrofluorescein diacetate
- MPE
multiphoton excitation
- XO
xanthine oxidase
Footnotes
This paper was submitted directly (Track II) to the Proceedings Office.
References
- 1.Wang R J. Photochem Photobiol. 1975;21:373–375. doi: 10.1111/j.1751-1097.1975.tb06688.x. [DOI] [PubMed] [Google Scholar]
- 2.Pereira O M, Smith J R, Packer L. Photochem Photobiol. 1976;24:237–242. doi: 10.1111/j.1751-1097.1976.tb06817.x. [DOI] [PubMed] [Google Scholar]
- 3.Parshad R, Sanford K K, Jones G M, Tarone R E. Proc Natl Acad Sci USA. 1978;75:1830–1833. doi: 10.1073/pnas.75.4.1830. [DOI] [PMC free article] [PubMed] [Google Scholar]
- 4.Tyrell R M, Werfelli P, Moraes E C. Photochem Photobiol. 1984;39:183–189. doi: 10.1111/j.1751-1097.1984.tb03426.x. [DOI] [PubMed] [Google Scholar]
- 5.Jones C A, Huberman E, Cunningham M L, Peak M J. Radiat Res. 1987;110:244–254. [PubMed] [Google Scholar]
- 6.Churchill M E, Peak J G, Peak M J. Photochem Photobiol. 1991;54:639–644. doi: 10.1111/j.1751-1097.1991.tb02068.x. [DOI] [PubMed] [Google Scholar]
- 7.Peak J G, Peak M J. Mutat Res. 1991;246:187–191. doi: 10.1016/0027-5107(91)90121-4. [DOI] [PubMed] [Google Scholar]
- 8.Peak J G, Peak M J. Photochem Photobiol. 1995;61:484–487. doi: 10.1111/j.1751-1097.1995.tb02349.x. [DOI] [PubMed] [Google Scholar]
- 9.Kochevar I E, Pathak M A, Parrish J A. In: Dermatology in General Medicine. Fitzpatrick T B, Freedberg I M, Eisen A Z, Wolff K, Austen K F, Goldsmith L A, Katz S I, editors. New York: McGraw–Hill; 1993. pp. 1627–1638. [Google Scholar]
- 10.Ham W T, Mueller H A, Sliney D H. Nature (London) 1976;260:153–154. doi: 10.1038/260153a0. [DOI] [PubMed] [Google Scholar]
- 11.Reme C, Reinboth J, Clausen M, Hafezi F. Arch Clin Exp Ophthamol. 1996;234:2–11. doi: 10.1007/BF00186512. [DOI] [PubMed] [Google Scholar]
- 12.Goldstein B D, Haber L C. J Clin Invest. 1972;51:892–901. doi: 10.1172/JCI106884. [DOI] [PMC free article] [PubMed] [Google Scholar]
- 13.He D, Behar S, Nomura N, Sassa S, Lim H W. Photochem Photobiol. 1995;61:656–661. doi: 10.1111/j.1751-1097.1995.tb09884.x. [DOI] [PubMed] [Google Scholar]
- 14.Setlow R B, Grist E, Thompson K, Woodhead A D. Proc Natl Acad Sci USA. 1993;90:6666–6670. doi: 10.1073/pnas.90.14.6666. [DOI] [PMC free article] [PubMed] [Google Scholar]
- 15.Setlow R B, Woodhead A D. Mutat Res. 1994;307:365–374. doi: 10.1016/0027-5107(94)90310-7. [DOI] [PubMed] [Google Scholar]
- 16.Bradley M O, Sharkey N A. Nature (London) 1977;266:724–726. doi: 10.1038/266724a0. [DOI] [PubMed] [Google Scholar]
- 17.Gantt R, Jones G M, Stephens E V, Baeck A E, Sanford K K. Biochim Biophys Acta. 1979;565:231–240. doi: 10.1016/0005-2787(79)90201-6. [DOI] [PubMed] [Google Scholar]
- 18.Parshad R, Sanford K K, Taylor W G, Tarone R E, Jones G M, Baeck A E. Photochem Photobiol. 1979;29:971–975. doi: 10.1111/j.1751-1097.1979.tb07800.x. [DOI] [PubMed] [Google Scholar]
- 19.Parshad R, Taylor W G, Sanford K K, Camalier R F, Gantt R, Tarone R E. Mutation Res. 1980;73:115–124. doi: 10.1016/0027-5107(80)90140-2. [DOI] [PubMed] [Google Scholar]
- 20.Erickson L C, Bradley M O, Kohn K W. Biochim Biophys Acta. 1980;610:105–115. doi: 10.1016/0005-2787(80)90060-x. [DOI] [PubMed] [Google Scholar]
- 21.Rosenstein B S, Ducore J M. Photochem Photobiol. 1983;38:51–55. doi: 10.1111/j.1751-1097.1983.tb08365.x. [DOI] [PubMed] [Google Scholar]
- 22.Estervig D, Wang R J. Photochem Photobiol. 1984;40:333–336. doi: 10.1111/j.1751-1097.1984.tb04595.x. [DOI] [PubMed] [Google Scholar]
- 23.Jones G M, Sanford K K, Parshad R, Gantt R, Price F M, Tarone R E. Br J Cancer. 1985;52:583–590. doi: 10.1038/bjc.1985.230. [DOI] [PMC free article] [PubMed] [Google Scholar]
- 24.Jernigan H M. Exp Eye Res. 1985;41:121–129. doi: 10.1016/0014-4835(85)90101-0. [DOI] [PubMed] [Google Scholar]
- 25.Peak J G, Pilas B, Dudek E J, Peak M J. Photochem Photobiol. 1995;54:197–203. doi: 10.1111/j.1751-1097.1991.tb02007.x. [DOI] [PubMed] [Google Scholar]
- 26.Graham R C, Lundholm U, Karnovsky M J. J Histochem Cytochem. 1965;13:150–152. doi: 10.1177/13.2.150. [DOI] [PubMed] [Google Scholar]
- 27.Novikoff A B, Goldfischer S. J Histochem Cytochem. 1969;17:675–680. doi: 10.1177/17.10.675. [DOI] [PubMed] [Google Scholar]
- 28.Van Den Munckhof R J M. Histochem J. 1996;28:401–429. doi: 10.1007/BF02331433. [DOI] [PubMed] [Google Scholar]
- 29.Rothe G, Valet G. J Leukocyte Biol. 1990;47:440–448. [PubMed] [Google Scholar]
- 30.LeBel C P, Ischiropoulos H, Bondy S C. Chem Res Toxicol. 1992;5:227–231. doi: 10.1021/tx00026a012. [DOI] [PubMed] [Google Scholar]
- 31.Royall J A, Ischiropoulos H. Arch Biochem Biophys. 1993;302:348–355. doi: 10.1006/abbi.1993.1222. [DOI] [PubMed] [Google Scholar]
- 32.Zhu H, Bannenberg G L, Moldeus P, Shertzer H. Arch Toxicol. 1994;68:582–587. doi: 10.1007/s002040050118. [DOI] [PubMed] [Google Scholar]
- 33.Hockberger P E, Ahmed M S, Skimina T A, Lee C, Hung W Y, Siddique T. SPIE Proc. 1996;2678:129–140. [Google Scholar]
- 34.Chu S, Huang Q, Alvares K, Yelandi A V, Rao S, Reddy J K. Proc Natl Acad Sci USA. 1995;92:7080–7084. doi: 10.1073/pnas.92.15.7080. [DOI] [PMC free article] [PubMed] [Google Scholar]
- 35.Wokosin D L, Centonze V E, Crittenden S, White J. Bioimaging. 1996;4:208–214. [Google Scholar]
- 36.Deerinck T J, Martone M E, Lev-Ram V, Green D P L, Tsien R Y, Spector D L, Huang S, Ellisman M H. J Cell Biol. 1994;126:901–910. doi: 10.1083/jcb.126.4.901. [DOI] [PMC free article] [PubMed] [Google Scholar]
- 37.Thomas J A. In: Optical Methods in Cell Physiology. DeWeer P, Salzberg B, editors. New York: Wiley Interscience; 1986. pp. 311–325. [Google Scholar]
- 38.Poot M, Zhang Y, Kramer J A, Wells K S, Jones L J, Hanzel D K, Lugade A G, Singer V L, Haugland R P. J Histochem Cytochem. 1996;44:1363–1372. doi: 10.1177/44.12.8985128. [DOI] [PubMed] [Google Scholar]
- 39.Galston A W. Science. 1950;111:619–624. doi: 10.1126/science.111.2893.619. [DOI] [PubMed] [Google Scholar]
- 40.Vamecq J, Draye J-P. Essays Biochem. 1989;24:115–205. [PubMed] [Google Scholar]
- 41.McCormick D B, Koster J F, Veeger C. Eur J Biochem. 1967;2:387–391. doi: 10.1111/j.1432-1033.1967.tb00150.x. [DOI] [PubMed] [Google Scholar]
- 42.Massey V, Palmer G. Biochemistry. 1966;5:3181–3189. doi: 10.1021/bi00874a016. [DOI] [PubMed] [Google Scholar]
- 43.Massey V, Stankovich M, Hemmerich P. Biochemistry. 1978;17:1–7. doi: 10.1021/bi00594a001. [DOI] [PubMed] [Google Scholar]
- 44.Vernon L P. Biochim Biophys Acta. 1959;36:177–185. doi: 10.1016/0006-3002(59)90082-4. [DOI] [PubMed] [Google Scholar]
- 45.Frisell W R, Chung C W, Mackenzie C G. J Biol Chem. 1959;234:1297–1302. [PubMed] [Google Scholar]
- 46.Bernheim F, Dixon M. Biochem J. 1928;22:113–124. doi: 10.1042/bj0220113. [DOI] [PMC free article] [PubMed] [Google Scholar]
- 47.Massey V. J Biol Chem. 1994;269:22459–22462. [PubMed] [Google Scholar]
- 48.Song L, Hennink E J, Young I T, Tanke H J. Biophys J. 1995;68:2588–2600. doi: 10.1016/S0006-3495(95)80442-X. [DOI] [PMC free article] [PubMed] [Google Scholar]
- 49.Xu C, Zipfel W, Shear J B, Williams R M, Webb W W. Proc Natl Acad Sci USA. 1996;93:10763–10768. doi: 10.1073/pnas.93.20.10763. [DOI] [PMC free article] [PubMed] [Google Scholar]
- 50.Adler H I. Crit Rev Biotechnol. 1990;10:119–127. doi: 10.3109/07388559009068263. [DOI] [PubMed] [Google Scholar]
- 51.Spector T, Jones D G. J Biol Chem. 1970;245:5079–5085. [PubMed] [Google Scholar]
- 52.Sohal R S, Weindruch R. Science. 1996;273:59–63. doi: 10.1126/science.273.5271.59. [DOI] [PMC free article] [PubMed] [Google Scholar]
- 53.Hyslop P A, Hinshaw D B, Halsey W A, Schraufstatter I U, Sauerheber R D, Spragg R G, Jackson J H, Cochrane C G. J Biol Chem. 1988;263:1665–1675. [PubMed] [Google Scholar]
- 54.Chen Q, Ames B N. Proc Natl Acad Sci USA. 1994;91:4130–4134. doi: 10.1073/pnas.91.10.4130. [DOI] [PMC free article] [PubMed] [Google Scholar]
- 55.Chance B, Sies H, Boveris A. Physiol Rev. 1979;59:527–605. doi: 10.1152/physrev.1979.59.3.527. [DOI] [PubMed] [Google Scholar]
- 56.Black H S, de Gruijl F R, Forbes P D, Cleaver J E, Ananthaswamy H N, deFabo E C, Ullrich S E, Tyrell R M. J Photochem Photobiol B. 1997;40:29–47. doi: 10.1016/s1011-1344(97)00021-3. [DOI] [PubMed] [Google Scholar]
- 57.Tsien R Y, Waggoner A. In: Handbook of Biological Confocal Microscopy. 2nd Ed. Pawley J B, editor. New York: Plenum; 1995. pp. 267–279. [Google Scholar]


