Abstract
The Brtl mouse, a knock-in model for moderately severe osteogenesis imperfecta (OI), has a G349C substitution in half of type I collagen α1(I) chains. We studied the cellular contribution to Brtl bone properties. Brtl cortical and trabecular bone are reduced before and after puberty, with BV/TV decreased 40–45%. Brtl ObS/BS is comparable to wildtype, and Brtl and wildtype marrow generate equivalent number of colony-forming units (CFUs) at both ages. However, OcS/BS is increased in Brtl at both ages (36–45%), as are TRACP+ cell numbers (57–47%). After puberty, Brtl ObS/BS decreases comparably to wildtype mice, but osteoblast matrix production (MAR) decreases to one half of wildtype values. In contrast, Brtl OcS falls only moderately (∼16%), and Brtl TRACP staining remains significantly elevated compared with wildtype. Consequently, Brtl BFR decreases from normal at 2 mo to one half of wildtype values at 6 mo. Immunohistochemistry and real-time RT-PCR show increased RANK, RANKL, and osteoprotegerin (OPG) levels in Brtl, although a normal RANKL/OPG ratio is maintained. TRACP+ precursors are markedly elevated in Brtl marrow cultures and form more osteoclasts, suggesting that osteoclast increases arise from more RANK-expressing precursors. We conclude that osteoblasts and osteoclasts are unsynchronized in Brtl bone. This cellular imbalance results in declining BFR as Brtl ages, consistent with reduced femoral geometry. The disparity in cellular number and function results from poorly functioning osteoblasts in addition to increased RANK-expressing precursors that respond to normal RANKL/OPG ratios to generate more bone-resorbing osteoclasts. Interruption of the stimulus that increases osteoclast precursors may lead to novel OI therapies.
Key words: Brtl mouse, type I collagen, osteoclast, histomorphometry, RANKL/osteoprotegerin
INTRODUCTION
Classical osteogenesis imperfecta (OI), or brittle bone disease, is an autosomal dominant disorder caused by mutations in one of the two genes that encode type I collagen.(1,2) Patients with OI have bone fragility, susceptibility to fractures from minimal trauma, skeletal deformities, blue sclerae, and growth deficiency; the clinical condition varies in severity from mild to lethal. Radiographically, long bones have abnormal modeling, with a gracile diaphysis and metaphyseal flaring.(2) However, the mechanisms that alter bone development in response to collagen mutations are poorly understood.
Static and dynamic histomorphometry of iliac crest biopsies from OI children have shown abnormal modeling and remodeling.(3,4) A marked increase in both osteoblast and osteoclast surface per bone surface was observed, as was an increase in bone formation rate, compared with control. The mineralizing surface per osteoid surface and mineral lag time were normal in OI bone, indicating that a quantitative defect in mineralization is not present. However, the decrease in mineral apposition rate, despite the increased number of bone remodeling units, points to an imbalance in bone remodeling in favor of osteoclast activity. Both cortical and trabecular bone are affected by these changes. OI patients have reduced cortical width, bone volume, trabecular number, and trabecular thickness compared with normal controls.(3,4)
Although the iliac crest has the advantage of accessibility for biopsy, it does not share the weight-bearing function of long bones. The strain of weight support and the pull of muscle impact long bone development. Furthermore, most significant OI fractures occur in long bones. The development and structure of long bones with abnormal collagen in their matrix can be directly examined in murine models of OI.
Several transgenic murine models for OI have been generated,(5–7) but detailed histomorphometry was performed only on the naturally occurring oim mouse,(8) with severe recessive bone dysplasia. Oim/oim secretes α1(I)3, an atypical α1(I) homotrimer, instead of normal α1(I)2α2(I) heterotrimer. Oim/+ carriers have a mild skeletal phenotype, with femurs failing at lower maximum load and energy than wildtype.(9) Long bones of oim/oim show high matrix turnover. The percent osteoblast surface, osteoclast number, and bone formation rate were all significantly increased,(10) resulting in significant reduction of total bone volume and cortical width, similar to the thin bones of OI children.(3) However, the mineral apposition rate in oim/oim is not reduced,(10) suggesting that the underlying mechanism of its bone dysplasia is different than that of classical dominant OI. Finally, recent reports of individuals with Ehlers-Danlos syndrome rather than bone disease,(11,12) who synthesize only α1(I)3, complicate extrapolation from oim to OI patients.
In this study, we examined femurs and cellular components from the Brtl mouse (Brtl),(13) a knock-in model for moderately severe type IV OI. The point mutation introduced into Brtl col1a1 causes an α1(I)Gly349Cys substitution.(13) Previously we have shown that Brtl has reduced BMD and brittle bones.(14) Brtl femora have reduced geometric properties, with reduced cross-sectional area, cortical thickness, and bending moment of inertia. Although Brtl fracture load normalizes after puberty due to changes in the predicted material properties of the matrix, Brtl geometry remains weak throughout development.(14)
To better understand the skeletal changes that occur in Brtl mice, we examined Brtl long bone histomorphometry, in combination with functional assays of osteogenic and osteoclast precursor cells, markers of osteoclast function, and immunohistochemical and molecular examination of the RANK/RANKL/osteoprotegerin (OPG) signaling pathway. As the Brtl mouse ages, bone formation declines due to cellular uncoupling, in which osteoclast number and function are elevated, while matrix production by osteoblasts is reduced. Increased osteoclasts and poorly functioning osteoblasts collaborate to reduce the geometry of Brtl bone. Cellular asynchrony results from increases in RANK expression and osteoclast precursors in Brtl marrow that lead to greater osteoclast formation in the context of an overall normal RANKL/OPG ratio.
MATERIALS AND METHODS
Animals
Wildtype (WT) and Brtl(13) mice were maintained on a mixed background of SvI29/CD-1/C57BL/6S. These studies used male offspring of Brtl+/− × WT matings and 4- to 6-wk-old male Hartley guinea pigs (Charles River Laboratories). All experiments were approved by the NICHD ACUC committee.
Mouse genotyping
DNA isolated from tail clippings of 21-day-old mice (Extract-N-Amp Tissue PCR Kit; Sigma) was genotyped by PCR using standard protocols,(15) plus 2.5% DMSO per reaction. Primers located in intron 22 of col1a1 (GenBank accession number NT_165773) (forward primer corresponds to nt 6802–6832: 5′-CCTGGCAGAGAAGCTGACCTCCCCCAGCTG-3′ and reverse primer to nt 7043–7073: 5′-TGATGCGTCTGTGACTTTCTCTCCACTTAG-3′) span the remaining lox sequence. PCR parameters were 94°C for 5 min and then 94°C for 2 min, 65°C for 1 min, and 72°C for 1 min for 40 cycles. The products of the WT and mutant alleles are 273 and 353 bp, respectively, and were visualized on agarose gels.
Growth analysis
Mice were weighed weekly: 12 WT and 10 Brtl male mice fed regular rodent chow were weighed from 3 to 16 wk of age; 10 each WT and Brtl mice fed a dough diet (Bio-serve) were followed from 3 to 8 wk of age. To determine femur length, femurs of male mice (9 each WT and Brtl, 2 mo old; 7 WT and 8 Brtl, 6 mo old) were excised and cleaned of soft tissue, leaving the growth plates intact. Femurs were measured from the proximal head to the distal end of the medial and lateral condyles with a digital caliper (Mitutoyo).
Bone histomorphometry
Femurs from 2-mo Brtl (n = 8) and WT (n = 11) and 6-mo Brtl (n = 9) and WT (n = 13) littermates were analyzed. The right femur was dissected free of tissue and fixed for 3–5 days in 70% ethanol immediately after removal. It was dehydrated with increasing concentrations of ethanol, cleared in xylene, embedded undecalcified in methyl methacrylate, and used for both static and dynamic histomorphometry. Five-micron-thick longitudinal serial sections were cut on a Reichert-Jung Polycut S microtome (Reichert-Jung) with a D profile knife (Delaware Diamond Knives). For static histomorphometry, sections taken from the middle of the femur, where the central vein is located, were stained with modified Masson trichrome stain.(16) Measurements were made by a blinded observer using the OsteoMeasure computerized image analysis system (OsteoMetrics), interfaced with an Optiphot Nikon microscope (Nikon). The recommendations of the Histomorphometry Nomenclature Committee of the American Society for Bone and Mineral Research(17) were followed. All measurements were confined to the secondary spongiosa and restricted to an area between 400 and 2000 μm distal to the growth plate–metaphyseal junction of the distal femur. Cortical measurements were made starting at 4000 μm distal to the same growth plate. For dynamic histomorphometry, mice received intraperitoneal injections of calcein (Sigma), 10 mg/kg body weight in 2% NaHCO3, and xylenol orange (Sigma), 90 mg/kg body weight, 12 and 2 days before euthanasia, respectively.
Colony forming unit-fibroblastic assay
Marrow was flushed from freshly excised femurs of Brtl and WT mice with PBS containing 2% FBS. Cells (2 × 10⁶/flask) were plated in T-25 flasks in 4 ml of culture media (α-MEM media [Invitrogen], 20% FBS [Equitech], penicillin [100 U/ml], streptomycin [100 μg/ml], and β-mercaptoethanol [10−4 M; Sigma]). The flasks were incubated 4 h at 37°C and washed twice with serum-free DMEM (without Ca2+; Biosource) to remove nonadherent cells. Guinea pig feeder cells (1 × 10⁷/flask), prepared as previously described,(18,19) were added to each flask. TGF-β1 (2 ng/ml; R&D Systems) was added to designated flasks. Adherent cells were grown at 37°C, 8% CO2 for 12–14 days. Osteogenic colonies (≥5 cells/colony) were identified by detection of alkaline phosphatase enzymatic activity (Sigma). The experiment was performed five independent times for each age group.
Immunohistochemistry (RANKL, OPG) and TRACP staining
Femurs were removed from 2- (4 Brtl, 4 WT) and 6-mo-old (6 Brtl, 6 WT) mice and fixed in 4% paraformaldehyde, decalcified in 14% EDTA and 1× PBS for 2 wk, dehydrated through a graded series of alcohols, and paraffin embedded, and 5-μm bone tissue sections were cut and mounted on glass slides using standard protocols. Just before TRACP staining, sections were de-paraffinized with xylene, rehydrated through graded alcohols, and water rinsed. Slides were stained for TRACP enzymatic activity using a kit (Sigma 387) and freshly prepared Fast Red TR (Sigma, F-8764; 1 mg/ml final). Sections were incubated with stain in the dark for 1 h, water rinsed, briefly counterstained with Harris hematoxylin, rinsed, and mounted with coverslips.(20) The number of TRACP+ cells was counted across two rows of fields (10 fields per row) just under the growth plate of each bone section by light microscopy at ×20 magnification in an Olympus IX-70 inverted microscope, and digital images were captured. Data are reported as the mean number of TRACP+ cells within the two rows per bone section as a function of age and genotype.
Immunohistochemical staining for RANKL protein expression in 2- (9 Brtl, 9 WT) and 6-mo (8 Brtl, 8 WT) samples or OPG protein expression in 2- (16 Brtl, 16 WT) and 6-mo (16 Brtl, 20 WT) samples was performed using femoral bone sections prepared as for TRACP staining, according to standard methods.(21) Briefly, rehydrated sections were exposed (2 h, room temperature) to antigen unmasking solution (Vector Laboratories), endogenous peroxidase activity was quenched (3% hydrogen peroxide, 10 min), and staining was performed as recommended using an ABC staining system (Santa Cruz sc-2018) and primary antibodies (1:100 dilutions, incubated overnight) to RANKL (Santa Cruz sc-9073) or OPG (Santa Cruz sc-11383). Staining was evaluated by light microscopy at ×20 magnification across two rows of fields just under the growth plate of each bone section, digital images were captured, and staining densities were quantified using a computer-linked Soft Max Pro image analysis program. Average staining density per field was determined for each bone section, and data were compiled and reported as the mean ± SE staining density per field as a function of age and genotype.
Real-time RT-PCR
RNA was obtained from freshly dissected femurs, from which soft tissue had been cleaned and marrow flushed, using ice-cold 1× PBS, before the diaphyses were crushed in liquid nitrogen. Total RNA was extracted using TriReagent (Molecular Research Center), treated with DNase (Ambion), and reverse-transcribed using a high-capacity cDNA archive kit (Applied Biosystems) with random primers. Real-time RT-PCR was performed to quantitate transcripts for GAPDH (Mm99999915_g1), RANKL (Mm00441908_m1), OPG (Mm00435452_m1), RANK (Mm00437135_m1), and TRACP (Mm00475698_m1) using Taqman Assays-On-Demand (Applied Biosystems). Transcript levels were calculated for wildtype and Brtl cDNA samples using a standard curve generated from pooled 2-mo wildtype cDNA.
Marrow osteoclasts and precursors
Primary bone marrow mononuclear cells were isolated from the long bones of 6- to 8-wk-old male WT or Brtl mice, and the cells from one mouse were cultured in a 100-mm dish for 24 h with phenol red-free α-MEM containing 10% FBS (HyClone) and 25 ng/ml human recombinant macrophage-colony stimulating factor (M-CSF; R&D Systems). Nonadherent (stroma-depleted) cells were replated at 1.5 × 10⁶ cells/well in 24-well plates and differentiated into bone pit-resorbing osteoclasts by further treatment with M-CSF (25 ng/ml) and RANKL (50 ng/ml) given every other day with refeeding until day 5.(22) Cells were fixed and stained for TRACP activity as a marker of osteoclast development, followed by DAPI nuclear staining.(22) TRACP+ mono- and binucleated cells were counted across 30 consecutive random fields as a measure of osteoclast precursors, and TRACP+ multinucleated cells with three or more nuclei were counted as osteoclasts. Data were presented as mean ± SE of TRACP+ cells/field.
Urine pyridinoline cross-links
Twenty-four-hour urines from 2- (7 Brtl, 8 WT) and 6-mo (8 Brtl, 7 WT) mice were assayed in duplicate for deoxypyridinoline (DPD) cross-links(23) using the Metra Serum DPD EIA kit (Quidel). Controls were within the range established by Quidel. Cross-links were normalized to urinary creatinine (Quidel) and expressed as nmol DPD/mmol creatinine.
Statistical analysis
The data were analyzed using repeated-measures ANOVA (Microsoft Excel). Values are presented as mean ± SD unless noted. Significance was achieved at p ≤ 0.05.
RESULTS
Growth
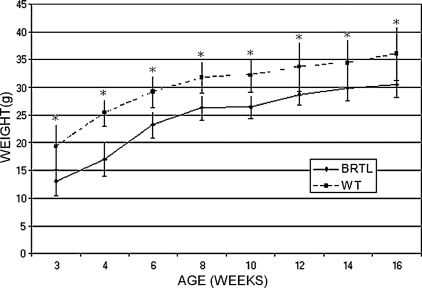
Brtl mice reproduce the growth deficiency of children with OI type IV, who have growth curves parallel to unaffected individuals.(24) On average, Brtl mice weighed 6 g less than WT littermates (Fig. 1) and were significantly smaller. The relative difference is greatest at 3–4 wk of age (≈30% smaller; p = 0.001), with some catch-up growth in weight by 12–16 wk (15% smaller, p = 0.04). Mice fed a soft diet have the same weight curves (data not shown), showing that dentinogenesis imperfecta(13) does not cause Brtl's deficient growth by limiting caloric intake caused by difficulty in eating regular rodent chow. Brtl femur lengths at both 2 (15.15 ± 0.48 mm) and 6 mo (16.14 ± 0.43 mm) of age were also significantly shorter than WT mice (16.08 ± 0.56 mm, p = 0.002, and 16.92 ± 0.92 mm, p = 0.001, at 2 and 6 mo, respectively).
FIG. 1.
Growth curve of male Brtl and WT littermates from 3 to 16 wk of age. Weights plotted as mean ± SD. *p < 0.05. Brtl is significantly smaller (5–7 g) through young adulthood, ranging from about one-third smaller than WT at weaning to one-sixth smaller as young adults.
Static histomorphometry
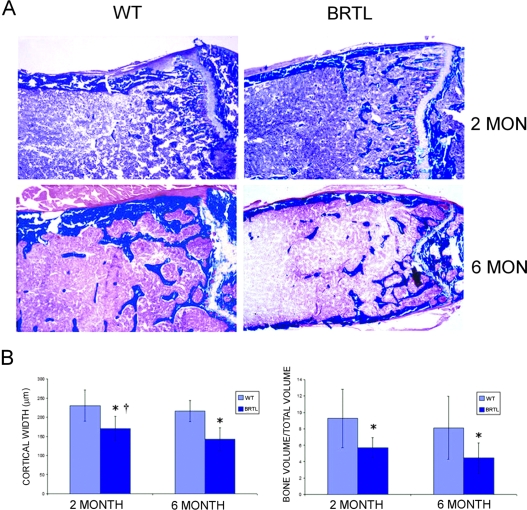
We analyzed the histomorphometry of Brtl femurs before and after puberty to determine the effect of mutant collagen on long bone development. Both cortical and trabecular bone were altered in Brtl mice (Fig. 2; Table 1). Brtl femurs have reduced cortical width (CtW) and trabecular bone volume/total volume (BV/TV) at both 2 and 6 mo of age compared with WT littermates. Reduced trabecular number and thickness contribute to lower Brtl bone volume at both ages. Trabecular number falls in both genotypes with age.
FIG. 2.
Static histomorphometry of 2- and 6-mo Brtl and WT femoral cortical and trabecular bone volume. (A) Representative images of Masson trichrome–stained Brtl and WT undecalcified femurs showed thinner cortex and reduced number of trabeculae in Brtl compared with WT, in both 2- and 6-mo animals. Magnification, ×40. (B) Bar graphs of cortical width (left) and trabecular bone volume/total volume (right). Data are represented as mean ± SD. *p < 0.05, difference between WT and Brtl; † p < 0.05, difference between 2- and 6-mo cortical thickness in Brtl mice.
Table 1.
Histomorphometry
| Parameter | 2-mo WT | 2-mo Brtl | 6-mo WT | 6-mo Brtl |
| Ct W (μm) | 230.53 ± 40.26 | 171.17 ± 31.38*† | 216.12 ± 27.75 | 142.66 ± 29.91* |
| BV/TV (%) | 9.28 ± 3.56 | 5.67 ± 1.23* | 8.14 ± 3.85 | 4.43 ± 1.89* |
| TbN (N/μm2) | 3.03 ± 0.91† | 2.45 ± 0.24† | 2.25 ± 0.70 | 1.65 ± 0.49* |
| TbTH (μm) | 30.17 ± 5.02 | 23.20 ± 5.11* | 35.24 ± 8.89 | 26.32 ± 6.96* |
| TbSp (μm) | 337.59 ± 151.31 | 387.66 ± 38.12† | 452.64 ± 160.13 | 625.15 ± 181.79* |
| ObS/BS (%) | 19.32 ± 5.64† | 21.59 ± 2.72† | 12.93 ± 3.32 | 12.90 ± 3.83 |
| OcS/BS (%) | 10.77 ± 3.12† | 14.69 ± 2.85* | 8.48 ± 2.49 | 12.30 ± 3.09* |
| NOc/BPm (N/μm2) | 4.68 ± 1.20 | 6.80 ± 1.03* | 4.50 ± 1.58 | 6.37 ± 1.42* |
| MAR (μm/d) | 1.05 ± 0.38† | 0.87 ± 0.30† | 0.63 ± 0.34 | 0.33 ± 0.33* |
| BFR/BS (μm3/μm2/d) | 0.17 ± 0.08 | 0.17 ± 0.06† | 0.12 ± 0.08 | 0.07 ± 0.07* |
Values are mean ± SD.
* p < 0.05 between WT and Brtl.
† p < 0.05 between 2 and 6 mo.
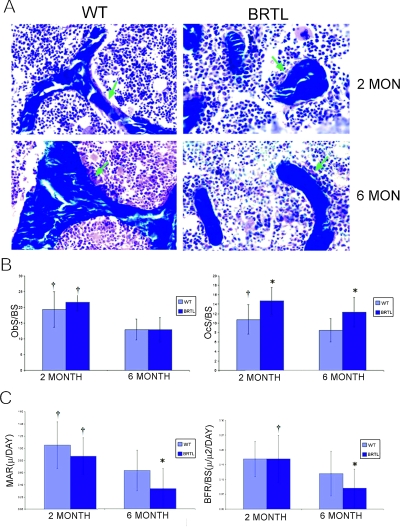
In the cellular compartment (Figs. 3A and 3B), Brtl osteoblast surface (ObS/BS) was comparable to control at both ages. However, Brtl osteoclast surface (OcS/BS) and number (NOc/BPm; Table 1) were significantly increased at both ages, with levels about one third greater than in WT littermates. While ObS/BS fell ∼40% in both genotypes by 6 mo, OcS/BS decreased only 16% in Brtl and 22% in WT, and Brtl osteoclast number remained elevated.
FIG. 3.
Cellular and dynamic histomorphometry of Brtl and WT femora. (A) Representative images of trabecular bone from Masson trichrome–stained Brtl and WT undecalcified femur sections. Osteoblast surface indicated with green arrows. Magnification, ×450. (B) Bar graphs of osteoblast (ObS/BS) and osteoclast (OcS/BS) surface. (C) Bar graphs of calculated mineral apposition rate (MAR) and bone formation rate per bone surface (BFR/BS). Data are represented as mean ± SD. *p < 0.05, difference between WT and Brtl; † p < 0.05, difference between 2 and 6 mo of same genotype.
Dynamic histomorphometry
Brtl mice have normal bone formation (BFR/BS) and mineral apposition (MAR) rates at 2 mo of age (Fig. 3C; Table 1). However, Brtl BFR/BS and MAR are significantly lower than in WT littermates at 6 mo of age. The decrease in bone formation in 6-mo-old Brtl mice reflects in part the postpubertal cellular imbalance in Brtl favoring osteoclasts, since Brtl ObS has a relatively greater decrease (∼40%) than does OcS (∼16%) in 6-mo mice compared with the levels present in 2-mo animals. Because osteoblast and osteoclast numbers are expected to be coupled, we examined the possibility that the cellular imbalance in 6-mo-old Brtl mice was caused by decreased ability of Brtl to replenish osteoblasts from precursor cells.
Colony-forming unit–fibroblastic
To examine the ability of Brtl mice to replenish functionally spent osteoblasts by osteogenic precursor cells, colony-forming unit–fibroblastic (CFU-F) efficiency assays were performed (Supplementary Table 1). Equivalent numbers of CFUs were identified in stromal cells from Brtl and WT mice at both 2 and 6 mo of age in multiple independent experiments. The decrease in the average number of CFU in Brtl stromal cells in 6 versus 2-mo-old mice was not significant (p = 0.27) because of the large variations between individual experiments inherent in the assay. The bone marrow stromal cells (BMSCs) were evaluated for their responsiveness to growth signals, specifically TGF-β1, which also stimulates collagen production by osteoblasts.(25) The fold stimulation was determined for each independent experiment and averaged for each genotype at both ages. Brtl and WT CFU numbers were equivalent in cultures treated with TGF-β1; the fold increase was also equivalent between genotypes in cells from 2- (WT, 1.7 ± 0.9; Brtl, 2.0 ± 0.8; p = 0.56) and 6-mo-old (WT, 2.4 ± 2.0; Brtl, 3.7 ± 4.3; p = 0.54) mice.
Osteoclast function
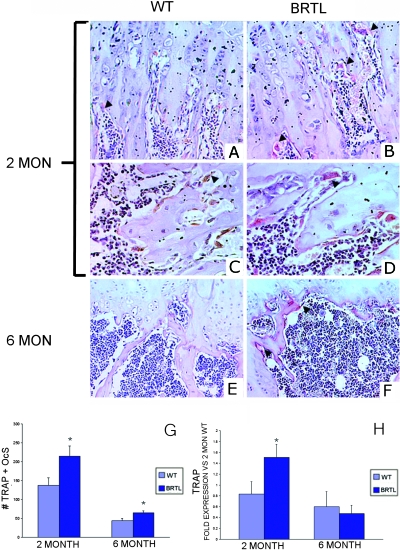
TRACP+ cells were counted as a measure of osteoclast function in vivo.(20) The number of TRACP+ cells was consistently elevated in Brtl femurs (Figs. 4A–4G); specifically, TRACP+ cells were increased 57% at 2 mo and 47% at 6 mo in Brtl compared with WT littermates. Furthermore, Brtl osteoclasts were larger and more intensely TRACP stained than those found in WT mice, at both the 2- and 6-mo ages. Although the number of TRACP+ cells decreases substantially with age (the level at 6 mo was ∼30% of 2-mo levels), the decrease was comparable in both genotypes. TRACP staining results were obtained just under the femoral growth plate and corroborated the static histomorphometry measurements made distal from the growth plate–metaphyseal junction.
FIG. 4.
Immunohistochemical measurement of TRACP+ osteoclasts in Brtl and WT femurs. (A–F) Representative images of 2- and 6-mo WT and Brtl decalcified paraffin femoral sections, in the region below the growth plate, stained for TRACP enzymatic activity and counterstained with hematoxylin. (A, C, and E) Regions from WT mice at 2 (A and C) or 6 mo (E). (B, D, and F) Regions from Brtl mice at 2 (B and D) or 6 mo (F). Arrowheads highlight a few of the TRACP+ osteoclasts stained red, all of which are located on resorptive bone surfaces. (C and D) Higher magnification views to show that Brtl osteoclasts (D) are generally larger and more intensely TRACP stained than are WT osteoclasts (C). (A, B, E, and F) Original magnification, ×300. (C and D) Original magnification, ×500. (G) Quantitation of the number of TRACP+ osteoclasts in Brtl femora at 2 (left) and 6 (right) mo. (H) TRACP expression in total RNA of whole femora in Brtl and WT; expression is normalized to the 2-mo WT pool.
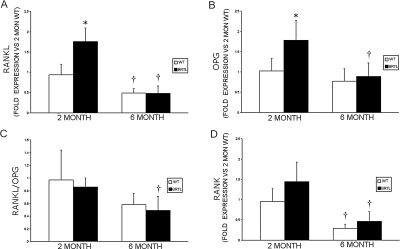
TRACP expression was assayed in total RNA extracted from whole femur specimens by real-time RT-PCR (Fig. 4H). Brtl TRACP expression in 2-mo animals was almost double that of WT levels (1.51 ± 0.24 versus 0.83 ± 0.23, p = 0.002), but no differences were detected between Brtl and WT in the lower expression of TRACP mRNA measured in 6-mo animals.
Osteoclast increases are independent of the RANKL/OPG ratio
Increased osteoclast surface, numbers, and TRACP staining, in the context of normal ObS and decreased bone formation, led us to examine the RANK/RANKL/OPG signaling pathway in normal and Brtl mice. Transcripts for both RANKL (1.76 ± 0.33 versus 0.94 ± 0.26, p = 0.001) and OPG (1.78 ± 0.49 versus 1.02 ± 0.31, p = 0.01) were significantly increased in femora of 2-mo-old Brtl mice compared with WT and decreased to control levels by 6 mo of age (Fig. 5; Table 2). Interestingly, the RANKL/OPG transcript ratio did not differ significantly between Brtl and WT mice at either age (0.86 ± 0.14 versus 0.97 ± 0.35, p = 0.36; 0.49 ± 0.22 versus 0.58 ± 0.18, p = 0.51, respectively). However, there was a trend toward elevated levels of RANK transcripts in 2-mo-old Brtl mice (p = 0.08) compared with WT, suggesting one possible route by which osteoclast numbers are increased in Brtl bone.
FIG. 5.
Real-time RT-PCR determination of RANKL, OPG, and RANK transcripts in Brtl and WT femurs. (A) Expression of RANKL compared with 2-mo WT mice. (B) Expression of OPG vs. 2-mo WT mice. (C) RANKL/OPG ratio for each genotype and age group is the average of the RANKL/OPG ratios determined for each mouse, using RANKL and OPG transcripts normalized to GAPDH. (D) Expression of RANK compared with 2-mo WT mice. *p < 0.05, difference between WT and Brtl, † p < 0.05, difference between 2- and 6-mo mice from the same genotype.
Table 2.
Immunostaining and Real-Time RT-PCR of Brtl RANKL/OPG Systems
| Parameter* |
2-mo |
6-mo |
P values |
|||||
| WT | Brtl | P | WT | Brtl | P | WT 2 vs. 6 mo | Brtl 2 vs. 6 mo | |
| Immunostaining† | ||||||||
| RANKL | 1.00 ± 0.10 | 1.50 ± 0.21 | 0.04 | 1.75 ± 0.18 | 1.35 ± 0.13 | 0.15 | 0.004 | 0.55 |
| OPG | 1.00 ± 0.09 | 1.49 ± 0.23 | 0.05 | 2.02 ± 0.42 | 1.56 ± 0.23 | 0.37 | 0.04 | 0.85 |
| RANKL/OPG | 1.00 ± 0.09 | 1.01 ± 0.15 | 0.41 | 0.87 ± 0.24 | 0.87 ± 0.17 | 0.86 | 0.42 | 0.99 |
| Real-time RT-PCR‡ | ||||||||
| RANKL | 0.94 ± 0.26 | 1.76 ± 0.33 | 0.001 | 0.49 ± 0.11 | 0.48 ± 0.18 | 0.91 | 0.01 | 0.00006 |
| OPG | 1.02 ± 0.31 | 1.78 ± 0.49 | 0.01 | 0.77 ± 0.31 | 0.89 ± 0.33 | 0.60 | 0.25 | 0.01 |
| RANKL/OPG | 0.97 ± 0.47 | 0.86 ± 0.14 | 0.36 | 0.58 ± 0.18 | 0.49 ± 0.22 | 0.51 | 0.09 | 0.01 |
| RANK | 0.96 ± 0.31 | 1.44 ± 0.49 | 0.08 | 0.29 ± 0.10 | 0.46 ± 0.24 | 0.22 | 0.003 | 0.004 |
* Values are expressed as a percentage of 2-mo WT.
† Immunostaining: 2 mo, n = 9 WT and n = 9 Brtl for RANKL, n = 16 WT and n = 16 Brtl for OPG; 6 mo, n = 8 WT and n = 8 Brtl for RANKL, n = 20 WT and n = 16 Brtl for OPG.
‡ Real-time RT-PCR: 2 and 6 mo, n = 5 WT and n = 5 Brtl for RANKL, OPG, and RANK.
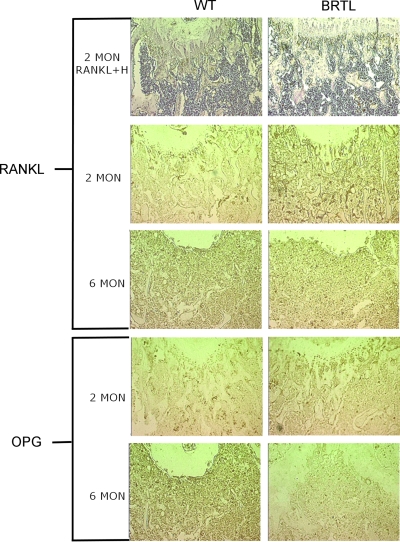
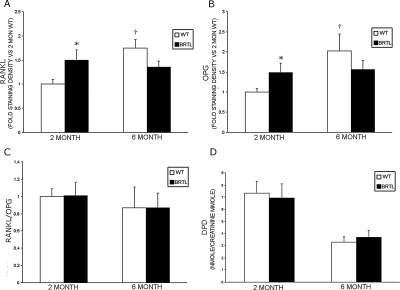
Immunohistochemistry of RANKL and OPG (Figs. 6 and 7; Table 2) also showed elevation of both osteoblast signals in sections of femurs from 2-mo-old Brtl mice compared with WT littermates (1.50 ± 0.21 versus 1.00 ± 0.10, p = 0.04 and 1.49 ± 0.23 versus 1.00 ± 0.09, p = 0.05, respectively). In femoral sections from 6-mo-old mice, RANKL and OPG did not differ significantly between the two genotypes, although WT values were significantly increased compared with 2-mo WT mice. Notably, as in the RANKL and OPG transcripts, the RANKL/OPG ratio was not elevated in Brtl femora compared with WT at either age.
FIG. 6.
Immunohistochemical detection of RANKL and OPG in Brtl and WT femurs. Representative images of 2- and 6-mo WT and Brtl paraffin decalcified femoral sections, in the region below the growth plate, immunostained for RANKL or OPG protein expression. Top row sections from 2-mo animals were immunostained for RANKL and counterstained with hematoxylin (H) to show overall histology of the region. Higher RANKL or OPG protein expression was apparent in 2-mo, but not 6-mo, Brtl compared with WT bone. Magnification, ×10.
FIG. 7.
Quantitation of immunohistochemistry and urinary cross-links. (A–C) Immunohistochemical staining for RANKL or OPG protein expression in 2- and 6-mo femoral bones was performed (as in Fig. 6), and staining densities were quantified by computer-linked light microscopic image analysis (magnification, ×20). (A and B) The mean ± SE staining density for RANKL (A) or OPG (B) protein expression per field is shown for 2- and 6-mo-old WT and Brtl femoral bones. *p < 0.05 difference from 2-mo WT. (C) The mean RANKL/OPG ratio for protein expression per field is not altered between WT and Brtl bones in 2- or 6-mo mice. (D) Urinary DPD cross-links, normalized to urine creatinine, were measured to evaluate bone resorption. No significant difference in DPD cross-links was found between WT and Brtl. Data are represented as mean ± SD.
Osteoclasts and their precursors are increased in Brtl marrow
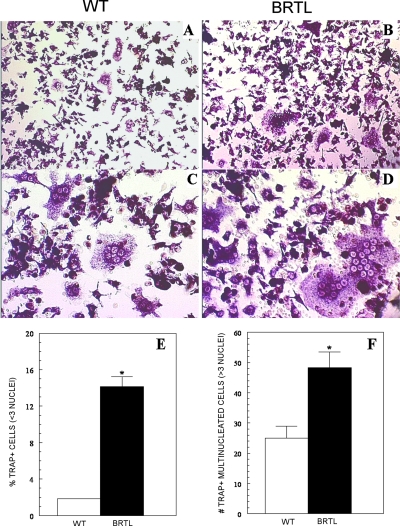
The elevation of RANK transcripts in Brtl femurs suggests that the asynchrony of Brtl osteoblasts and osteoclasts may relate to the increased numbers of osteoclasts in Brtl, specifically, or the presence of either increased numbers of osteoclast precursors that respond to the normal RANKL/OPG ratio or increased sensitivity of osteoclast precursors to RANKL/OPG caused by elevated RANK expression. To test these possibilities, we examined the number of osteoclast precursors and their in vitro differentiation from 2-mo-old mice, the age at which the number of Brtl TRACP+ osteoclasts was 57% greater than in WT littermates. We showed a marked increase in the number of Brtl osteoclast precursors (Fig. 8); marrow cultured in the presence of M-CSF and RANKL (50 ng/ml) yielded 7-fold more TRACP+ mono- or binucleated cells from Brtl than from WT mice (p < 0.001). Moreover, 2-fold more osteoclasts (containing three or more nuclei) formed in Brtl marrow cultures (p < 0.01), and these appeared larger and more intensely TRACP stained compared with those derived from WT mice. Similarly, osteoclast generation was consistently enhanced in Brtl compared with WT marrow cultures exposed to lower concentrations of RANKL (20, 30, or 40 ng/ml), although the number and size of osteoclasts formed declined in both with RANKL dose (data not shown). Thus, at a given level of RANKL, more osteoclasts are generated from Brtl compared with WT marrow.
FIG. 8.
Osteoclast generation in vitro from WT and Brtl bone marrow. Marrow was isolated from 2-mo-old mice and cultured with M-CSF and RANKL to promote osteoclast differentiation. (A and C) TRACP+ osteoclasts were formed by day 5 in marrow from WT mice. Magnifications: (A) ×200 and (C) ×400. (B and D) Osteoclasts formed by day 5 from marrow of Brtl mice are more numerous, larger, and more intensely TRACP+ compared with WT. In addition, more TRACP+ small cells (mono- or binucleated) are observed in the Brtl marrow cultures. Magnifications: (B) ×200 and (D) ×400. (E) Quantification of mono- and binucleated TRACP+ cells in WT and Brtl marrow cultures. (F) Quantitation of multinucleated TRACP+ osteoclasts containing three or more nuclei per cell.
Urinary cross-links from bone resorption
As one measure of bone resorption, urinary collagen DPD cross-links were determined and normalized to urine creatinine (Fig. 7D). No differences were found in the concentration of DPD between Brtl and WT at 2 (6.94 ± 1.16 versus 7.31 ± 0.98, p = 0.53) or 6 mo of age (3.71 ± 0.53 versus 3.20 ± 0.49, p = 0.14, respectively), despite the increase in osteoclast surface, number, and TRACP staining.
DISCUSSION
The Brtl mouse is a knock-in model for OI, which carries a classical glycine substitution in one col1a1 allele. The Brtl phenotype is similar to the moderate type IV OI present in the child from whom the mutation was copied.(13) Brtl also provides an important opportunity to examine the cellular components of OI long bones during development, to understand the mechanism(s) leading to decreased OI bone volume and weak bone geometry.
Our previous mechanical studies showed that Brtl femurs are geometrically smaller than those of WT littermates at 1, 2, and 6 mo. As predicted, Brtl femurs from 2-mo animals fracture at a lower load. However, in mature young adult Brtl mice (6 mo), bending stiffness and load to fracture in Brtl attained parity with WT despite reduced geometry.(14) The studies presented in this report were conducted in the same 2- to 6-mo age frame to correlate with the biomechanics data. Thus, the present study does not include a cohort of 4-mo-old mice, the age of normal peak bone mass in mice. Our findings showed that both decreased osteoblast and increased osteoclast function contribute to the mechanism of skeletal changes in OI.
Histomorphometry corroborates reduced Brtl cortical and trabecular bone(14) compared with WT at both ages. In addition, developmental changes in Brtl cellular function and number were found. Brtl osteoblast surface/bone surface is equal to WT before and after puberty, including a 40% decrease after puberty. Consistent with histomorphometry, Brtl and WT also have equivalent ability to replenish osteoblasts from marrow precursors, although the high variability inherent in this assay limits our ability to detect whether physiologically significant small differences exist. More importantly, Brtl clearly has a postpubertal decline in MAR compared with WT, pointing to a decline in the production of matrix by individual Brtl osteoblasts. In contrast, Brtl OcS/BS is increased compared with WT before and after puberty, which is also confirmed by the increased number of TRACP+ cells. Furthermore, the greater size and staining intensity of TRACP+ cells in Brtl bone suggests that the activity of individual Brtl osteoclasts may be increased. OcS/BS has only a modest physiological decline after puberty.
The Brtl cellular data point to unbalanced bone cellular number and function, which becomes more disproportionate after puberty, when osteoblast and osteoclast surface have not declined proportionately. Rather, the osteoblasts decline in function and experience a relatively greater decrease in number than do osteoclasts. The combination of increased osteoclast number and function and decreased matrix production by osteoblasts establishes and maintains the weak Brtl femoral geometry. These cellular functions do not play a clear role in the postpubertal adaptation of Brtl bone calculated material properties,(14) which involves alterations in the composition or arrangement of Brtl matrix and/or mineral. Conversely, it is possible that the matrix or mineral alterations that occur as part of adaptation might alter the cell-matrix interactions in Brtl and activate signaling pathways that contribute to the Brtl cellular imbalance.
The mechanism of bone dysplasia in Brtl mice, with a classic glycine substitution in col1a1, differs from that of the other well-studied murine models for OI, Mov13(5) and oim.(8) The Mov13 mouse is an excellent model for both the mechanism and the mild phenotype of type I OI, because it has absence of transcripts from one col1a1 allele(5,26) and decreased production of structurally normal matrix. Mov13/+ mice have weak prepubertal geometry and brittle bones,(27,28) with a pubertal adaptive increase in cross-sectional area to enhance failure load. Unfortunately, histomorphometry is not available on, Mov13/+ mice. Oim is a recessive OI model with more severe bone dysplasia than Brtl, whose extracellular matrix is composed of α1(I)3 homotrimers, rather than type I collagen heterotrimers [α1(I)2α2(I)].(8) Oim histomorphometry revealed a high turnover state, with increased ObS, OcS, and BFR.(10) Postpubertal oim have increased col1a1 transcription in vivo compared with wildtype, which allows oim to maintain a normal MAR(10) but does not improve cortical or trabecular bone geometry(29) or load to fracture.(9) This contrasts with Brtl's normal levels of col1a1 transcripts in neonatal osteoblasts,(30) postpubertal decreased MAR, and reduced matrix output by osteoblasts.
Neither Brtl nor oim has femoral histomorphometry that is identical to that reported from iliac crest biopsies in two sizable groups of children with types III and IV OI.(3,4) The pediatric OI bone has high turnover, with increased osteoblast and osteoclast surface and elevated bone formation rate. Oim has a more exuberant high turnover state than do OI children, with relatively greater elevation of ObS, OcS, and BFR, as well as increased urinary collagen cross-links,(10) compared with controls. OI children also have decreased MAR,(3) whereas oim osteoblasts maintain MAR comparable to WT mice.(10) In Brtl mice, there is an uncoupling of cell responses; OcS is elevated, although ObS remains normal, and both bone formation rate and MAR are decreased. It is interesting that urinary collagen cross-links are not increased in Brtl, given the elevated osteoclast activity. However, discordance of serum and urinary markers of bone formation and resorption have been previously noted in OI. Collagen urinary cross-links are generally in the normal range in children with structural defects of collagen,(31,32) as in Brtl, and may reflect the matrix insufficiency of the underlying bone, yielding fewer cross-links despite increased osteoclast numbers or activity or resistance of the abnormal matrix to resorption.
Because the increase in OcS and TRACP in Brtl paradoxically occurs in a context of decreased osteoblast matrix production and normal RANKL/OPG ratios, there must be an alternative mechanism for cellular asynchrony. The elevation of RANK transcripts in Brtl femurs suggests that osteoclast precursors might be increased in number and/or their sensitivity to prevailing RANKL/OPG levels. In fact, a marked increase in the number of osteoclast precursors and their formation into more numerous and larger osteoclasts in response to a given RANKL concentration was demonstrated in Brtl marrow. This finding provides new insights into the role of the bone cellular compartment in OI. Disproportionate elevation of osteoclasts in bone with a genetic defect in collagen, an osteoblast protein, points to a secondary effect of OI matrix or soluble factors on osteoclasts. More circulating OC precursors may be recruited to the bone compartment and/or the lifespan of resident precursors may be prolonged. Additional studies are required to determine whether or how precursor cell trafficking or lifespan dynamics are altered in this animal model of type IV OI. Identifying potential differences in soluble factors that may regulate osteoclast recruitment and development in concert with the RANK/RANKL/OPG signaling system could provide further insights regarding the imbalance in OI bone cell coupling.(33,34) For instance, inflammatory conditions may be triggered by defective collagen in OI that lead to increases in interleukin (IL)-1 and TNF-α, which could secondarily elevate Brtl RANKL and OPG, as well as synergize with RANKL intracellularly to promote osteoclast development.(33,35,36) Osteoclast precursors may also be increased in oim/oim mice, from which bone marrow cultured in the presence of RANKL and M-CSF yielded more mononuclear and multinucleated osteoclasts forming resorption pits than in WT cultures.(37)
We have initiated a series of studies on Brtl osteoclasts to address the questions of matrix or soluble factors that disproportionately increase osteoclast recruitment in OI. Insight into the mechanism of cellular asynchrony in OI may provide the basis for novel therapeutic approaches.
ACKNOWLEDGMENTS
Dr Xiao-Dong Chen generously provided instruction in CFU assays. The authors thank Dr Weizhong Chang, BEMB, NICHD for critical reading of the manuscript. This work was supported by NICHD Intramural Funding (JCM), The Center for Histology and Histomorphometry at the University of Connecticut (GAG), and NIH Grants RO1 DK56547 (PC-O), and R21AR05449701 (PO).
Footnotes
The authors state that they have no conflicts of interest.
REFERENCES
- 1.Byers PH, Cole WG. Osteogenesis imperfecta. In: Royce PM, Steinmann B, editors. Connective Tissue and Its Heritable Disorders. 2nd ed. New York, NY, USA: Wiley-Liss; 2002. pp. 385–430. [Google Scholar]
- 2.Marini J. Osteogenesis imperfecta. In: Behrman RE, Kliegman RM, Jenson HB, editors. Nelson Textbook of Pediatrics. 17th ed. Philidelphia, PA, USA: Saunders; 2004. pp. 2336–2338. [Google Scholar]
- 3.Rauch F, Travers R, Parfitt AM, Glorieux FH. Static and dynamic bone histomorphometry in children with osteogenesis imperfecta. Bone. 2000;26:581–589. doi: 10.1016/s8756-3282(00)00269-6. [DOI] [PubMed] [Google Scholar]
- 4.Marini JC, Hopkins E, Glorieux FH, Chrousos GP, Reynolds JC, Gundberg CM, Reing CM. Positive linear growth and bone responses to growth hormone treatment in children with types III and IV osteogenesis imperfecta: High predictive value of the carboxyterminal propeptide of type I procollagen. J Bone Miner Res. 2003;18:237–243. doi: 10.1359/jbmr.2003.18.2.237. [DOI] [PubMed] [Google Scholar]
- 5.Schnieke A, Harbers K, Jaenisch R. Embryonic lethal mutation in mice induced by retrovirus insertion into the alpha 1(I) collagen gene. Nature. 1983;304:315–320. doi: 10.1038/304315a0. [DOI] [PubMed] [Google Scholar]
- 6.Stacey A, Bateman J, Choi T, Mascara T, Cole W, Jaenisch R. Perinatal lethal osteogenesis imperfecta in transgenic mice bearing an engineered mutant pro-alpha 1(I) collagen gene. Nature. 1988;332:131–136. doi: 10.1038/332131a0. [DOI] [PubMed] [Google Scholar]
- 7.Pereira R, Khillan JS, Helminen HJ, Hume EL, Prockop DJ. Transgenic mice expressing a partially deleted gene for type I procollagen (COL1A1). A breeding line with a phenotype of spontaneous fractures and decreased bone collagen and mineral. J Clin Invest. 1993;91:709–716. doi: 10.1172/JCI116252. [DOI] [PMC free article] [PubMed] [Google Scholar]
- 8.Chipman SD, Sweet HO, McBride DJ, Jr, Davisson MT, Marks SC, Jr, Shuldiner AR, Wenstrup RJ, Rowe DW, Shapiro JR. Defective pro alpha 2(I) collagen synthesis in a recessive mutation in mice: A model of human osteogenesis imperfecta. Proc Natl Acad Sci USA. 1993;90:1701–1705. doi: 10.1073/pnas.90.5.1701. [DOI] [PMC free article] [PubMed] [Google Scholar]
- 9.Saban J, Zussman MA, Havey R, Patwardhan AG, Schneider GB, King D. Heterozygous oim mice exhibit a mild form of osteogenesis imperfecta. Bone. 1996;19:575–579. doi: 10.1016/s8756-3282(96)00305-5. [DOI] [PubMed] [Google Scholar]
- 10.Kalajzic I, Terzic J, Rumboldt Z, Mack K, Naprta A, Ledgard F, Gronowicz G, Clark SH, Rowe DW. Osteoblastic response to the defective matrix in the osteogenesis imperfecta murine (oim) mouse. Endocrinology. 2002;143:1594–1601. doi: 10.1210/endo.143.5.8807. [DOI] [PubMed] [Google Scholar]
- 11.Schwarze U, Hata R, McKusick VA, Shinkai H, Hoyme HE, Pyeritz RE, Byers PH. Rare autosomal recessive cardiac valvular form of Ehlers-Danlos syndrome results from mutations in the COL1A2 gene that activate the nonsense-mediated RNA decay pathway. Am J Hum Genet. 2004;74:917–930. doi: 10.1086/420794. [DOI] [PMC free article] [PubMed] [Google Scholar]
- 12.Malfait F, Symoens S, Coucke P, Nunes L, De Almeida S, De Paepe A. Total absence of the alpha2(I) chain of collagen type I causes a rare form of Ehlers-Danlos syndrome with hypermobility and propensity to cardiac valvular problems. J Med Genet. 2006;43:e36. doi: 10.1136/jmg.2005.038224. [DOI] [PMC free article] [PubMed] [Google Scholar]
- 13.Forlino A, Porter FD, Lee EJ, Westphal H, Marini JC. Use of the Cre/lox recombination system to develop a non-lethal knock-in murine model for osteogenesis imperfecta with an alpha1(I) G349C substitution. Variability in phenotype in BrtlIV mice. J Biol Chem. 1999;274:37923–37931. doi: 10.1074/jbc.274.53.37923. [DOI] [PubMed] [Google Scholar]
- 14.Kozloff KM, Carden A, Bergwitz C, Forlino A, Uveges TE, Morris MD, Marini JC, Goldstein SA. Brittle IV mouse model for osteogenesis imperfecta IV demonstrates postpubertal adaptations to improve whole bone strength. J Bone Miner Res. 2004;19:614–622. doi: 10.1359/JBMR.040111. [DOI] [PubMed] [Google Scholar]
- 15.Saiki RK, Gelfand DH, Stoffel S, Scharf SJ, Higuchi R, Horn GT, Mullis KB, Erlich HA. Primer-directed enzymatic amplification of DNA with a thermostable DNA polymerase. Science. 1988;239:487–491. doi: 10.1126/science.2448875. [DOI] [PubMed] [Google Scholar]
- 16.Masson P. Trichrome stainings and their preliminary techniques. J Tech Meth. 1929;12:75–90. [Google Scholar]
- 17.Parfitt AM, Drezner MK, Glorieux FH, Kanis JA, Malluche H, Meunier PJ, Ott SM, Recker RR. Bone histomorphometry: Standardization of nomenclature, symbols, and units. Report of the ASBMR Histomorphometry Nomenclature Committee. J Bone Miner Res. 1987;2:595–610. doi: 10.1002/jbmr.5650020617. [DOI] [PubMed] [Google Scholar]
- 18.Kuznetsov S, Gehron Robey P. Species differences in growth requirements for bone marrow stromal fibroblast colony formation In vitro. Calcif Tissue Int. 1996;59:265–270. doi: 10.1007/s002239900121. [DOI] [PubMed] [Google Scholar]
- 19.Chen XD, Shi S, Xu T, Robey PG, Young MF. Age-related osteoporosis in biglycan-deficient mice is related to defects in bone marrow stromal cells. J Bone Miner Res. 2002;17:331–340. doi: 10.1359/jbmr.2002.17.2.331. [DOI] [PubMed] [Google Scholar]
- 20.Minkin C. Bone acid phosphatase: Tartrate-resistant acid phosphatase as a marker of osteoclast function. Calcif Tissue Int. 1982;34:285–290. doi: 10.1007/BF02411252. [DOI] [PubMed] [Google Scholar]
- 21.van Lent PL, Grevers L, Lubberts E, de Vries TJ, Nabbe KC, Verbeek S, Oppers B, Sloetjes A, Blom AB, van den Berg WB. Fcgamma receptors directly mediate cartilage, but not bone, destruction in murine antigen-induced arthritis: Uncoupling of cartilage damage from bone erosion and joint inflammation. Arthritis Rheum. 2006;54:3868–3877. doi: 10.1002/art.22253. [DOI] [PubMed] [Google Scholar]
- 22.Zheng H, Yu X, Collin-Osdoby P, Osdoby P. RANKL stimulates inducible nitric-oxide synthase expression and nitric oxide production in developing osteoclasts. An autocrine negative feedback mechanism triggered by RANKL-induced interferon-beta via NF-kappaB that restrains osteoclastogenesis and bone resorption. J Biol Chem. 2006;281:15809–15820. doi: 10.1074/jbc.M513225200. [DOI] [PubMed] [Google Scholar]
- 23.Delmas PD, Schlemmer A, Gineyts E, Riis B, Christiansen C. Urinary excretion of pyridinoline crosslinks correlates with bone turnover measured on iliac crest biopsy in patients with vertebral osteoporosis. J Bone Miner Res. 1991;6:639–644. doi: 10.1002/jbmr.5650060615. [DOI] [PubMed] [Google Scholar]
- 24.Marini JC, Bordenick S, Heavner G, Rose S, Chrousos GP. Evaluation of growth hormone axis and responsiveness to growth stimulation of short children with osteogenesis imperfecta. Am J Med Genet. 1993;45:261–264. doi: 10.1002/ajmg.1320450223. [DOI] [PubMed] [Google Scholar]
- 25.Centrella M, Horowitz MC, Wozney JM, McCarthy TL. Transforming growth factor-beta gene family members and bone. Endocr Rev. 1994;15:27–39. doi: 10.1210/edrv-15-1-27. [DOI] [PubMed] [Google Scholar]
- 26.Kratochwil K, von der Mark K, Kollar EJ, Jaenisch R, Mooslehner K, Schwarz M, Haase K, Gmachl I, Harbers K. Retrovirus-induced insertional mutation in Mov13 mice affects collagen I expression in a tissue-specific manner. Cell. 1989;57:807–816. doi: 10.1016/0092-8674(89)90795-2. [DOI] [PubMed] [Google Scholar]
- 27.Bonadio J, Saunders TL, Tsai E, Goldstein SA, Morris-Wiman J, Brinkley L, Dolan DF, Altschuler RA, Hawkin JE, Jr, Bateman JF, Mascara T, Jaenischi R. Transgenic mouse model of the mild dominant form of osteogenesis imperfecta. Proc Natl Acad Sci USA. 1990;87:7145–7149. doi: 10.1073/pnas.87.18.7145. [DOI] [PMC free article] [PubMed] [Google Scholar]
- 28.Bonadio J, Jepsen KJ, Mansoura MK, Jaenisch R, Kuhn JL, Goldstein SA. A murine skeletal adaptation that significantly increases cortical bone mechanical properties. Implications for human skeletal fragility. J Clin Invest. 1993;92:1697–1705. doi: 10.1172/JCI116756. [DOI] [PMC free article] [PubMed] [Google Scholar]
- 29.McBride DJ, Jr, Shapiro JR, Dunn MG. Bone geometry and strength measurements in aging mice with the oim mutation. Calcif Tissue Int. 1998;62:172–176. doi: 10.1007/s002239900412. [DOI] [PubMed] [Google Scholar]
- 30.Forlino A, Tani C, Rossi A, Lupi A, Campari E, Gualeni B, Bianchi L, Armini A, Cetta G, Bini L, Marini JC. Differential expression of both extracellular and intracellular proteins is involved in the lethal or nonlethal phenotypic variation of BrtlIV, a murine model for osteogenesis imperfecta. Proteomics. 2007;7:1877–1891. doi: 10.1002/pmic.200600919. [DOI] [PubMed] [Google Scholar]
- 31.Shapiro J. Comment. J Bone Miner Res. 1995;10:338–339. [Google Scholar]
- 32.Lund AM, Hansen M, Kollerup G, Juul A, Teisner B, Skovby F. Collagen-derived markers of bone metabolism in osteogenesis imperfecta. Acta Paediatr. 1998;87:1131–1137. doi: 10.1080/080352598750031112. [DOI] [PubMed] [Google Scholar]
- 33.Wada T, Nakashima T, Hiroshi N, Penninger JM. RANKL-RANK signaling in osteoclastogenesis and bone disease. Trends Mol Med. 2006;12:17–25. doi: 10.1016/j.molmed.2005.11.007. [DOI] [PubMed] [Google Scholar]
- 34.Roodman GD. Regulation of osteoclast differentiation. Ann N Y Acad Sci. 2006;1068:100–109. doi: 10.1196/annals.1346.013. [DOI] [PubMed] [Google Scholar]
- 35.Boyce BF, Schwarz EM, Xing L. Osteoclast precursors: Cytokine-stimulated immunomodulators of inflammatory bone disease. Curr Opin Rheumatol. 2006;18:427–432. doi: 10.1097/01.bor.0000231913.32364.32. [DOI] [PubMed] [Google Scholar]
- 36.Teitelbaum SL. Osteoclasts; culprits in inflammatory osteolysis. Arthritis Res Ther. 2006;8:201. doi: 10.1186/ar1857. [DOI] [PMC free article] [PubMed] [Google Scholar]
- 37.Zhang H, Doty SB, Hughes C, Dempster D, Camacho NP. Increased resorptive activity and accompanying morphological alterations in osteoclasts derived from the oim/oim mouse model of osteogenesis imperfecta. J Cell Biochem. 2007;102:1011–1020. doi: 10.1002/jcb.21337. [DOI] [PMC free article] [PubMed] [Google Scholar]


