

Abstract
Recent genome-wide association (GWA) studies of lipids have been conducted in samples ascertained for other phenotypes, particularly diabetes. Here we report the first GWA analysis of loci affecting total cholesterol (TC), low-density lipoprotein (LDL) cholesterol, high-density lipoprotein (HDL) cholesterol and triglycerides sampled randomly from 16 population-based cohorts and genotyped using mainly the Illumina HumanHap300-Duo platform. Our study included a total of 17,797-22,562 persons, aged 18-104 years and from geographic regions spanning from the Nordic countries to Southern Europe. We established 22 loci associated with serum lipid levels at a genome-wide significance level (P < 5 × 10⁻⁸), including 16 loci that were identified by previous GWA studies. The six newly identified loci in our cohort samples are ABCG5 (TC, P = 1.5 × 10⁻¹¹; LDL, P = 2.6 × 10⁻¹⁰), TMEM57 (TC, P = 5.4 × 10⁻¹⁰), CTCF-PRMT8 region (HDL, P = 8.3 × 10⁻¹⁶), DNAH11 (LDL, P = 6.1 × 10⁻⁹), FADS3-FADS2 (TC, P = 1.5 × 10⁻¹⁰; LDL, P = 4.4 × 10⁻¹³) and MADD-FOLH1 region (HDL, P = 6 × 10-11). For three loci, effect sizes differed significantly by sex. Genetic risk scores based on lipid loci explain up to 4.8% of variation in lipids and were also associated with increased intima media thickness (P = 0.001) and coronary heart disease incidence (P = 0.04). The genetic risk score improves the screening of high-risk groups of dyslipidemia over classical risk factors.
Serum lipids are important determinants of cardiovascular disease and are related to morbidity1-3. The high heritability of circulating lipid levels is well established, and earlier studies of individuals with extreme lipid values or families with mendelian forms of dyslipidemias have exposed the involvement of numerous genes and respective proteins in lipid metabolism1,4,5. Recent GWA studies mostly done in study samples enriched with type 2 diabetes cases have implicated a total of 19 loci controlling serum high-density lipoprotein cholesterol (HDL), low-density lipoprotein cholesterol (LDL) and triglycerides (TG)6-11. The loci include the genes encoding ABCA1, APOB, CELSR2, CETP, DOCK7, GALNT2, GCKR, HMGCR, LDLR, LIPC, LIPG, LPL, MLXIPL, NCAN, PCSK9 and TRIB1, and three genetic regions with multiple associated genes including MVK-MMAB, APOA5-APOA4-APOC3-APOA1 and APOE-APOC1-APOC4-APOC2. Many of these have also been consistently associated with lipid levels in candidate gene studies reported over the past 30 years12,13. Currently identified common loci explain only a small fraction of variation in the concentration of lipids within the population. In contrast to rare variants with major effects such as those underlying familial hypercholesterolemia, common variants improve the prediction of cardiovascular disease only marginally in terms of the clinical classification of patients14. As the genetic profiles studied are far from complete, there is substantial room for further characterization of genetic profiles influencing serum lipid levels.
GWA studies published so far have generally included subjects ascertained for the presence or absence of a disease or trait component (particularly diabetes). Compared to population-based cohorts, such ascertainment has the potential to generate bias with respect to both the detection of associations and the estimation of their population-level impact. Here we report the results of GWA analysis of 16 European studies (total number of persons 17,798-22,562, depending on the lipid trait studied), representing population-based cohorts. We combined these large cohorts to identify loci affecting serum levels of HDL, LDL, TG as well as total cholesterol (TC) across different European populations. We further examined whether the associated lipid loci showed any sex-specific differences in effect size, as well as their impact on cardiovascular morbidity in elderly cohorts.
RESULTS
Screening for new loci associated with lipid levels
Meta-analysis of GWA data from the ENGAGE cohort datasets (Table 1) with respect to the levels of the four principal lipid phenotypes (LDL, HDL, TC, TG) resulted in 162 signals with P value <5 × 10⁻⁸ (full list provided in Supplementary Table 1 online; genome-wide association plots in Supplementary Fig. 1 online). These 162 SNPs represent a total of 22 chromosomal loci associated with serum lipid levels in the general population (Table 2). Of these, 16 regions have been identified in earlier GWA studies and 6 are newly identified. As expected given the high correlations observed between some of the lipid fractions (correlation up to 0.89 for LDL and TC in the Northern Finnish Birth Cohort), several of the loci were associated with multiple lipid measures.
Table 1. Table of cohorts, genotyping platforms and phenotype information of four lipid traits per cohort.
| TC N Mean (s.d.) | TG N Mean (s.d.) | LDL N Mean (s.d.) | HDL N Mean (s.d.) | |||||||
|---|---|---|---|---|---|---|---|---|---|---|
| Study | Genotyping platform | Country | Females | Males | Females | Males | Females | Males | Females | Males |
| ATR, Australian twin registry | Illumina 318K | Australia | 424 5.7 (1.1) |
0 | 424 1.6 (1.0) |
0 | 416 3.4 (1.0) |
0 | 420 1.6 (0.4) |
0 |
| DK-TWIN, Danish twin registry | Illumina 318K | Denmark | 169 5.4 (1.3) |
0 | 140 1.2 (0.4) |
0 | 138 3.1 (1.0) |
0 | 140 1.6 (0.4) |
0 |
| ERF, Erasmus Ruchpen Family study | Illumina 318K | The Netherlands | 510 5.6 (1.1) |
319 5.4 (1.1) |
510 1.3 (0.6) |
319 1.6 (1.1) |
509 3.7 (1.0) |
315 3.7 (1.0) |
510 1.4 (0.4) |
319 1.1 (0.3) |
| FTC, Finnish twin cohort | Illumina 318K | Finland | 138 5.4 (0.9) |
0 | 41 1.2 (0.8) |
0 | 138 3.5 (1.0) |
0 | 138 1.6 (0.5) |
0 |
| KORA, Cooperative health research in the Region of Augsburg | Affymetrix 500K | Germany | 830 5.8 (1.1) |
813 5.6 (1.0) |
830 1.7 (0.9) |
813 2.2 (1.7) |
830 3.4 (0.9) |
813 3.3 (0.8) |
830 1.7 (0.4) |
813 1.3 (0.4) |
| MICROS, The genetic study of three population microisolates in South Tyrol | Illumina 318K | Italy | 615 5.9 (1.2) |
471 5.8 (1.2) |
615 1.3 (0.7) |
471 1.7 (1.3) |
615 3.4 (1.1) |
471 3.6 (1.1) |
615 1.8 (0.4) |
471 1.5 (0.3) |
| NFBC1966, Northern Finnish Birth Cohort of 1966 | Illumina 370K | Finland | 2,488 5.0 (1.0) |
2,283 5.2 (1.0) |
2,488 1.1 (0.6) |
2,282 1.3 (0.8) |
2,480 2.8 (0.8) |
2,274 3.2 (0.9) |
2,488 1.7 (0.4) |
2,282 1.4 (0.3) |
| NSPHS, The Northern Swedish Population Health Study | Illumina 318K | Sweden | 345 5.8 (1.3) |
308 5.8 (1.3) |
345 1.9 (1.1) |
308 2.5 (1.9) |
345 3.5 (1.1) |
308 3.5 (1.1) |
345 1.7 (0.4) |
308 1.4 (0.3) |
| NTR, The Netherlands twin register | Illumina 318K | The Netherlands | 251 4.9 (1.0) |
0 | 250 1.1 (0.6) |
0 | 250 2.8 (0.9) |
0 | 269 1.5 (0.4) |
0 |
| NTRNESDA, The Netherlands Twin Register and The Netherlands Study of Depression and Anxiety | Affymetrix 600K | The Netherlands | 2,265 5.0 (1.1) |
1,177 5.0 (1.0) |
2,279 1.2 (0.7) |
1,186 1.6 (1.0) |
2,267 3.1 (1.0) |
1,178 3.3 (0.9) |
2,279 1.6 (0.4) |
1,185 1.3 (0.4) |
| ORCADES, The Orkney Complex Disease Study | Illumina 318K | Scotland | 384 5.9 (1.2) |
330 5.6 (1.2) |
384 1.3 (0.6) |
331 1.4 (0.7) |
384 3.5 (1.1) |
330 3.6 (1.1) |
384 1.8 (0.4) |
331 1.5 (0.4) |
| Rotterdam Study | Illumina 550K | The Netherlands | 3,475 6.8 (1.2) |
2,399 6.3 (1.2) |
1,430 1.6 (0.8) |
929 1.5 (0.7) |
1,390 3.9 (0.9) |
912 3.6 (0.8) |
3,460 1.4 (0.4) |
2,389 1.2 (0.3) |
| STR, Swedish twin registry | Illumina 318K | Sweden | 301 6.0 (1.1) |
0 | 301 1.4 (0.8) |
0 | 300 3.9 (1.0) |
0 | 301 1.5 (0.4) |
0 |
| TwinUK, dizygotic twins of the St. Thomas’ twin cohort | Illumina 318K | UK | 1,129 5.4 (1.2) |
0 | 0 | 0 | 0 | 0 | 0 | 0 |
| UK-TWIN, monozygotic twins of the St. Thomas’ twin cohort | Illumina 318K | UK | 429 5.3 (1.2) |
0 | 429 1.0 (0.8) |
0 | 428 3.4 (1.0) |
0 | 429 1.5 (0.4) |
0 |
| Vis study | Illumina 318K | Croatia | 406 5.2 (1.0) |
303 5.0 (1.0) |
407 1.6 (0.8) |
303 1.9 (1.1) |
405 3.3 (1.0) |
301 3.1 (0.9) |
405 1.1 (0.1) |
301 1.1 (0.2) |
| Subtotal | 14,159 | 8,403 | 10,873 | 6,942 | 10,895 | 6,902 | 13,013 | 8,399 | ||
| Total | 22,562 | 17,815 | 17,797 | 21,412 | ||||||
Table 2. SNPs achieving genome-wide significance.
| TC | HDL | LDL | TG | |||||||||||
|---|---|---|---|---|---|---|---|---|---|---|---|---|---|---|
| SNP | Chr. | Position (Mb) | Gene region | Ref. allele | CAa | CAFb | βc | P value | βc | P value | βc | P value | βc | P value |
| rs10903129 | 1 | 25.51 | TMEM57 | A | G | 0.54 | 0.061 | 5.4E-10 | 0.024 | 0.02 | 0.050 | 1.8E-5 | 0.008 | 0.48 |
| rs1167998 | 1 | 62.64 | DOCK7 | A | C | 0.32 | -0.073 | 6.4E-10 | -0.033 | 3.8E-3 | -0.058 | 1.1E-5 | -0.091 | 2.0E-12 |
| rs10889353 | 1 | 62.83 | DOCK7 | A | C | 0.32 | -0.079 | 3.7E-12 | -0.036 | 1.8E-3 | -0.060 | 7.9E-6 | -0.085 | 8.2E-11 |
| rs646776 | 1 | 109.53 | CELSR2 | A | G | 0.22 | -0.128 | 8.5E-22 | 0.037 | 6.2E-3 | -0.155 | 7.8E-23 | 0.007 | 0.63 |
| rs693 | 2 | 21.14 | APOB | A | G | 0.52 | -0.096 | 8.7E-23 | 0.054 | 1.3E-7 | -0.098 | 3.6E-17 | -0.043 | 1.4E-4 |
| rs6754295 | 2 | 21.12 | APOB | A | C | 0.25 | -0.061 | 1.8E-06 | 0.068 | 4.4E-8 | -0.074 | 1.6E-7 | -0.077 | 2.5E-8 |
| rs673548 | 2 | 21.15 | APOB | A | G | 0.76 | 0.052 | 7.4E-05 | -0.066 | 7.4E-7 | 0.063 | 3.6E-5 | 0.086 | 1.1E-8 |
| rs780094 | 2 | 27.65 | GCKR | A | G | 0.63 | -0.023 | 0.02 | 0.016 | 0.12 | 0.002 | 0.85 | -0.103 | 3.1E-20 |
| rs6756629 | 2 | 43.98 | ABCG5 | A | G | 0.92 | 0.145 | 1.5E-11 | -0.007 | 0.74 | 0.157 | 2.6E-10 | 0.027 | 0.26 |
| rs3846662 | 5 | 74.69 | HMGCR | A | G | 0.44 | 0.092 | 2.5E-19 | -0.006 | 0.57 | 0.079 | 1.5E-11 | 0.025 | 0.03 |
| rs12670798 | 7 | 21.38 | DNAH11 | A | G | 0.24 | 0.064 | 9.2E-7 | 0.019 | 0.14 | 0.089 | 6.1E-9 | 0.006 | 0.68 |
| rs2240466 | 7 | 72.30 | MLXIPL | A | G | 0.87 | 0.004 | 0.80 | -0.041 | 0.02 | -0.015 | 0.44 | 0.137 | 1.1E-12 |
| rs2083637 | 8 | 19.91 | LPL | A | G | 0.26 | -0.004 | 0.73 | 0.107 | 5.5E-18 | 0.004 | 0.76 | -0.107 | 1.0E-14 |
| rs10096633 | 8 | 19.88 | LPL | A | G | 0.88 | -0.002 | 0.91 | -0.141 | 6.1E-16 | -0.013 | 0.53 | 0.174 | 1.9E-18 |
| rs6987702 | 8 | 126.57 | TRIB1 | A | G | 0.29 | 0.073 | 3.3E-9 | 0.010 | 0.44 | 0.068 | 2.9E-6 | 0.058 | 5.2E-5 |
| rs3905000 | 9 | 104.74 | ABCA1 | A | G | 0.86 | 0.063 | 5.0E-5 | 0.113 | 8.6E-13 | 0.002 | 0.90 | -0.023 | 0.20 |
| rs7395662 | 11 | 48.48 | MADD-FOLH1 | A | G | 0.61 | -0.005 | 0.63 | -0.073 | 6.0E-11 | 0.013 | 0.31 | -0.008 | 0.54 |
| rs174570 | 11 | 61.35 | FADS2/3 | A | G | 0.83 | 0.088 | 1.5E-10 | 0.064 | 3.9E-6 | 0.110 | 4.4E-13 | -0.063 | 2.9E-5 |
| rs12272004 | 11 | 116.11 | APO(A1/A4/A5/C3) | A | C | 0.93 | -0.107 | 7.3E-7 | 0.058 | 0.01 | -0.085 | 9.9E-4 | -0.181 | 5.4E-13 |
| rs1532085 | 15 | 56.47 | LIPC | A | G | 0.59 | -0.052 | 3.7E-7 | -0.130 | 9.7E-36 | 0.006 | 0.60 | -0.011 | 0.33 |
| rs1532624 | 16 | 55.56 | CETP | A | C | 0.57 | -0.028 | 0.01 | -0.213 | 9.4E-94 | 0.034 | 3.3E-3 | 0.038 | 1.1E-3 |
| rs2271293 | 16 | 66.46 | CTCF-PRMT8 | A | G | 0.87 | -0.023 | 0.14 | -0.129 | 8.3E-16 | 0.017 | 0.33 | 0.037 | 0.04 |
| rs4939883 | 18 | 45.42 | LIPG | A | G | 0.83 | 0.073 | 2.4E-7 | 0.103 | 1.6E-11 | 0.034 | 0.06 | 0.028 | 0.11 |
| rs2228671 | 19 | 11.07 | LDLR | A | G | 0.88 | 0.158 | 9.3E-24 | -0.010 | 0.54 | 0.136 | 4.2E-14 | 0.010 | 0.59 |
| rs2304130 | 19 | 19.65 | NCAN | A | G | 0.07 | -0.153 | 2.0E-15 | -0.006 | 0.75 | -0.116 | 1.5E-7 | -0.102 | 2.9E-6 |
| rs2075650 | 19 | 50.09 | TOMM40-APOE | A | G | 0.15 | 0.138 | 2.9E-19 | -0.059 | 1.9E-4 | 0.160 | 9.3E-19 | 0.065 | 2.4E-4 |
| rs157580 | 19 | 50.09 | TOMM40-APOE | A | G | 0.33 | -0.090 | 5.1E-17 | 0.055 | 3.6E-7 | -0.111 | 2.1E-19 | -0.069 | 1.2E-8 |
| rs439401 | 19 | 50.11 | TOMM40-APOE | A | G | 0.68 | 0.044 | 3.7E-4 | -0.037 | 2.7E-3 | 0.037 | 1.1E-2 | 0.086 | 1.8E-9 |
In each region, the SNP with the lowest P value for one of the outcomes is shown. Newly identified regions and effects of known regions on new lipids are shaded with light gray. In boldface are results with P value <5E-8. CA, coded allele (the allele for which effect was estimated); CAF, coded allele frequency; β, effect of the coded allele (in s.d.).
For TC, we found 11 regions showing genome-wide significant evidence for association. Of these, eight have previously been implicated in GWA scans for LDL or TG (Table 2), and three (ABCG5 (rs6756629), FADS2-FADS3 (rs174570) and TMEM57 (rs10903129)) represent new loci. For LDL, out of eight associated loci, three (ABCG5 (rs6756629), DNAH11 (rs12670798) and FADS2-FADS3 (rs174570)) were not known before. For HDL, eight regions showed genome-wide significant results including two newly identified regions, CTCF-PRMT7 (8 SNPs associated with P < 5 × 10⁻⁸) and MADD-FOLH1 (9 SNPs associated). For TG, all seven regions showing genome-wide significance in the current study were previously implicated in the control of serum lipid levels (DOCK7, APOB, GCKR, BAZ1B-BCL7B-TBL2-MLXIPL region, LPL-SLC18A1 region, BUD13-APOA cluster (A1/A4/A5/C3), CEACAM16-TOMM40-APOE region). Within two of the newly identified loci, there was only one SNP reaching genome-wide significance. However, for both regions, there were multiple additional SNPs with suggestive association (not reaching the level of 5 × 10⁻⁸, see Supplementary Fig. 2 online). When comparing the effects of the 22 SNPs across the different populations, we found that all SNPs showed consistent evidence for association across European populations (Supplementary Fig. 3 online). As an example of similarity of effects across the cohorts, Figure 1 shows the forest plot of effects for rs7395662 (MADD-FOLH1) on high-density lipoprotein. The estimated effect sizes are very similar across the cohorts, particularly in the largest cohorts. The effects were also similar for the two sexes.
Figure 1.
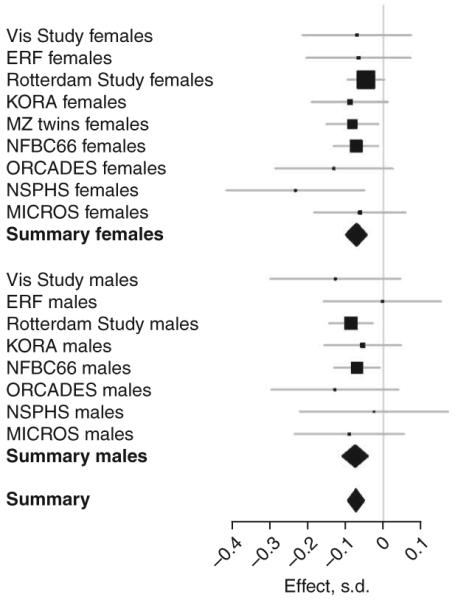
Effect of rs7395662 (MADD-FOLH1) on high-density lipoprotein separately for different cohorts and sexes.
Characterization of associated loci
We also evaluated the potential relevance for biological pathways related to lipid metabolism by carrying out a genome-wide association network analysis (GWANA) of associated SNPs. GWANA uses the ranking of associated genes together with their biological pathway information based on Gene Ontology to list pathways that are enriched among the most highly associated genes. This is analogous to the way pathway analyses of signals obtained in genome-wide transcript data are analyzed15. We present GWANA results using data for GWA-identified SNPs associated with TC (Fig. 2). The GWANA-associated genes for TC, tagged by the best SNP per gene, showed statistically significant clustering to highly relevant pathways shown in green in Figure 2: two major pathway trees linked the TC-associated genes to cholesterol and sterol metabolism, lipid transporters and even nutrient response. We present the data of the GWANA analyses for other lipids in the Supplementary Table 2 and Supplementary Figure 4 online.
Figure 2.
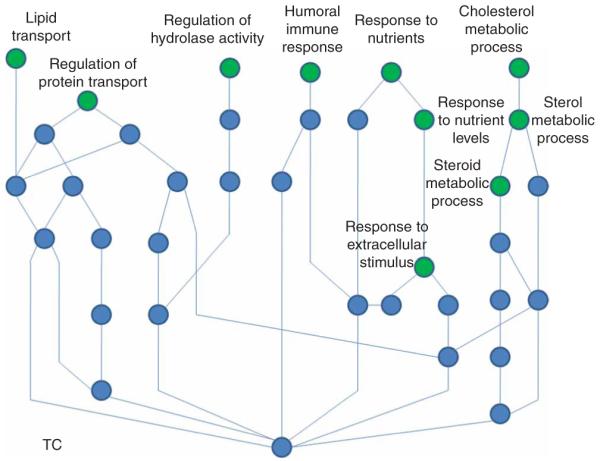
Pathways containing an enrichment of the most strongly associated genes with total cholesterol (green circles) and their connections.
When we tested for effect difference between males and females among the associated loci, rs3846662 in HMGCR (effect in males = 0.049, effect in females = 0.117; P = 0.0013, Fig. 3) and rs2304130 NCAN (effect in males = -0.234, effect in females = -0.110; P = 0.0019) showed significant differences in effect size for TC. Similarly, rs2083637 in LPL showed different effects for HDL (effect in males = 0.149, effect in females = 0.079; P = 0.0060), even after correction for multiple testing. Sex-specific P-value plots for the four lipid traits are shown in Supplementary Figure 5 online.
Figure 3.
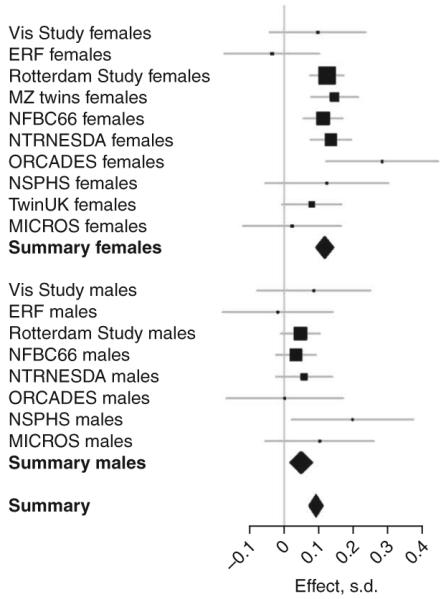
Effect of rs3846662 (HMGCR) on total cholesterol separately for different cohorts showing different effects for the two sexes.
Genetic risk scores
Next, on the basis of loci discovered in our own and previous genome-wide association findings, we constructed genetic risk scores (profiles) for TC, HDL, LDL and TG in the three large cohorts (NFBC, Rotterdam Study and MZ twins, n = 12,361). The scores were computed as weighted sums of the number of lipid level-increasing (or decreasing for HDL) alleles carried by a person. To eliminate bias arising from use of the same data both for defining the optimal weights and for estimating the population effects, we based the weighting on the estimated effect sizes of each allele across all the study cohorts after excluding the study in which the risk score was being applied.
For the TC risk score, we used the 11 SNPs listed in Table 2. For the HDL risk score, we used the 8 SNPs showing genome-wide significance in this study (Table 2) and rs2144300 tagging the previously reported GALNT2 locus, rs2338104 tagging the KCTD10-MVK-MMAB region7, and rs12272004 tagging the APOA1/A4/A5/C3 region6. For the LDL risk score, we used eight SNPs showing genome-wide significance in this study (Table 2) plus rs11206510 in PCSK9 and rs16996148 in NCAN-CILP2 (ref. 7) loci. For the TG score, in addition to the seven SNPs shown in Table 2, we used three SNPs from TRIB1 (rs17321515), NCAN-CILP2 (rs16996148) and LIPC (rs4775041)7. In the three cohorts, the genetic risk profile explained 3.9% of the total variance in sex- and age-adjusted TC. Similarly, genetic risk profiles explained 4.8%, 3.4% and 3.0% of age-adjusted variances in HDL, LDL and TG, respectively. In Table 3 and Supplementary Figure 6 online, we show these variance decompositions separately for both sexes in the three cohorts (total n = 12,361). Because the three cohorts differ appreciably in terms of age distribution, results are reported separately for NFBC (all participants aged 31), MZ twins (mean age 50) and the Rotterdam Study (mean age 69). The genetic risk profiles seem to account for similar proportions of variance regardless of age patterns except for LDL, where the proportion of variance explained by associated genes seems to drop in the older cohorts. The lipid variance explained by the genetic risk score approaches that explained by the body mass index (BMI), a traditional risk factor for cholesterol.
Table 3. Proportion of variance (%) explained by genes and BMI in the Rotterdam Study, MZ twin cohorts and NFBC by sex.
| TC | HDL | LDL | TG | ||||||
|---|---|---|---|---|---|---|---|---|---|
| Cohort | Sex | Genes (%) | BMI (%) | Genes (%) | BMI (%) | Genes (%) | BMI (%) | Genes (%) | BMI (%) |
| Rotterdam Study | Female | 4.0 | 1.4 | 4.3 | 3.6 | 3.6 | 0.07 | 4.2 | 5.1 |
| Rotterdam Study | Male | 3.5 | 0.5 | 4.5 | 2.9 | 1.0 | 0.0009 | 3.3 | 4.5 |
| Monozygotic twins | Female | 3.2 | 0.2 | 4.3 | 10.0 | 4.2 | 1.1 | 2.6 | 6.8 |
| Northern Finnish birth cohort | Female | 4.8 | 2.5 | 4.3 | 8.7 | 5.3 | 5.6 | 2.1 | 8.8 |
| Northern Finnish birth cohort | Male | 3.6 | 4.1 | 6.6 | 9.6 | 3.9 | 4.2 | 2.6 | 13.9 |
Lipid values are widely applied predictors for cardiovascular diseases in the clinical setting. One of our older cohorts, the Rotterdam Study (all subjects over 55 years of age) had follow-up for clinical events. In this cohort, we could test for association between the genetic risk profiles and end-points of clinical relevance, including intima media thickness (IMT) and incident coronary heart disease (CHD). Of the five risk profiles (TC, HDL, LDL, TG specific and a ‘combined profile’ including all associated SNPs for the four traits), the TC profile and the combined profile were most strongly associated with relevant clinical outcomes. The TC risk profile was significantly (P < 0.001) associated with clinically defined hypercholesterolemia (serum cholesterol over 6.5 mmol/l), suggesting that the joint testing of the loci will be clinically relevant to ascertain high risk groups. TC risk scores improved the prediction of hypercholesterolemia beyond that achieved with age, sex and body mass index (AUC (area under the receiver-operating-characteristic curve) increase from 0.63 (95% CI = 0.61-0.64) to 0.66 (95% CI = 0.65-0.67)). The TC genetic risk score was significantly associated with IMT (P = 0.001). This association was still significant (P = 0.043) after adjustment for circulating levels of TC. In line wit these findings and those of others14, neither the TC risk scores nor the other four genetic risk scores improved the prediction of incident CHD. The TC genetic risk score was also associated with risk of incident CHD (P = 0.042), but the association did not remain significant after addition of circulating levels of TC into the model, implying that TC levels are in the causal pathway in between the genetic variants and the disease.
DISCUSSION
We aimed to identify loci involved in the regulation of circulating lipid levels. Screening for increased circulating lipid levels and early treatment with statins is one of the key strategies in the prevention of cardiovascular risk in clinical practice, and dietary change is the primary prevention strategy at the population level. Potential new lipid-associated loci could contribute to these prevention strategies. We used GWA data from 16 cohorts, including three large cohorts each over 3500 samples (NFBC, Rotterdam Study and NTRNESDA) and 13 smaller cohorts from across Europe. We have identified six new risk loci and confirmed 16 regions previously associated with lipid metabolism in earlier GWA studies6-8,14. All newly identified regions showed robust effects across the study cohorts, which had different age distributions, geographic origins and lifestyle patterns (Supplementary Fig. 3). It is of interest that 16 out of 22 loci had been previously identified in case-control studies, most with samples enriched by type 2 diabetes cases, suggesting that effects seen in diabetic individuals are independent of the disease. It remains to be determined whether effects of the new loci we identified are also observed in individuals with diabetes.
We have compared the effect estimates obtained in our meta-analysis and those reported in Kathiresan et al., which is a Swedish population-based study14. From 24 SNPs presented in Kathiresan et al., all but two (rs11591147 and rs599838) were typed in at least one population used in the present study. For most loci, similar estimates of effect sizes were obtained from our population-based cohorts and the cohort used by Kathiresan et al. However, the effect of rs6511720[T] in LDLR on LDL was estimated as -0.26 ± 0.02 s.d. by Kathiresan et al. and -0.15 ± 0.03 s.d. in our analysis; this effect difference is significant (nominal P = 0.002) and remained so after multiple-testing correction for the 22 SNPs compared.
Our study samples were compiled from the population cohorts of the ENGAGE project, which aims to provide an infrastructure to combine large study samples and datasets across populations of European origin. Out of the 22 associated loci, a total of 11 were associated with TC, including three new ones in addition to 8 loci earlier associated with the level of LDL. Out of three new TC-associated loci, ABCG5 (rs6756629) and FADS2-FADS3 were associated with both TC and LDL, whereas TMEM57 only showed genome-wide significant association with TC and a much weaker association with LDL (Table 2).
Among the six newly identified lipid-associated loci, two include genes encoding proteins known to be involved in lipid metabolism based on either the data from experimental animal studies or monogenic human diseases. One of them is part of the FADS2-FADS3 (fatty acid desaturase 2 and 3) gene cluster, a gene family encoding proteins that regulate desaturation of fatty acids through the introduction of double bonds between defined carbons of the fatty acyl chain. The second obvious functionally relevant gene is ABCG5 (ATP-binding cassette transporter family member 5). The corresponding protein functions as a half-transporter, dimerizing with ABCG8 to form a functional complex necessary for efflux of dietary cholesterol and noncholesterol sterols from the intestine and liver. Mutations in ABCG5 are known to cause the rare monogenic disorder sitosterolemia, characterized by abnormal absorption of cholesterol and other sterols (MIM210250), and variants of this gene have been shown to regulate blood cholesterol levels (and risk of gallstones) in humans16.
For the other four newly identified loci, the role in lipid metabolism is less obvious. The first, here assigned as MADD-FOLH1 locus of chromosome 11p, represents a gene desert close to the centromere with no known gene on the 500-kb flanking region, and the two genes flanking the locus, MADD and FOLH1, have not been implicated in lipid metabolism. However, NR1H3, or LXRA, an orphan member of the nuclear receptor superfamily, is located just 0.5 kb telomeric of MADD and an associated SNP in this gene was reported in the NFBC cohort17. The liver X receptors (LXRs) are established mediators of lipid-inducible gene expression. At the second locus, the CTCF-PRMT8 gene encodes a transcriptional regulator potentially involved in hormone dependent gene silencing. At the third, the DNAH11 gene encodes a member of the dynein heavy chain family known to be involved in the movements of cellular cilia. Finally, TMEM57 encodes a membrane protein with poorly characterized function. Further studies are needed to examine the potential role of these or neighboring genes in lipid metabolism.
None of the published GWA studies have addressed the potential sex-based difference in genetic risk profiles for lipids. Here we found significantly different sex-specific effects for some genes, as expected from epidemiological and clinical data18. Lipid values for males and females are known to differ, as does the prevalence of cardiovascular diseases19. The two loci showing the strongest evidence for sex-based differences in effect size are those containing HMGCR (3-hydroxy-3-methylglutaryl-Coenzyme A reductase (HMGCoA) and NCAN (neurocan). HMGCR is the rate-limiting enzyme for cholesterol synthesis and the drug target for statins20, commonly used for treating high LDL values21. Variants in HMGCR have recently been associated with reduced efficacy of pravastatin therapy22. Previous GWA studies have provided compelling evidence that common intronic variants of this gene are associated with LDL cholesterol, with 0.1 mmol/l difference between two homozygote classes7. The second gene with a potential sex-specific effect, NCAN, encodes a chondroitin sulfate proteoglycan thought to be involved in the modulation of cell adhesion and migration. The locus flanking the NCAN gene has previously been associated with both LDL and TG8.
Just as for sex-associated differences, we might have expected to see differences in genetic profiles among European populations with large differences in average levels of serum lipids. Notably, the direction of the change in lipid level as well as the effect of the associated variants was for most of 22 loci quite similar across the various European populations. This could indicate that the contribution of lifestyle and environmental variation may have limited impact on observed between-population differences in lipid levels. More likely, perhaps our study design selected for detection of signals that show consistent effects across populations, and was biased against the identification of loci that have substantial heterogeneity of effect size.
Lipid-associated loci described in this study were not significantly associated with BMI in our cohorts, although obesity itself is correlated with lipid levels23. The proportion of variance explained by all 22 loci for lipid levels in our general population samples was comparable to that explained by BMI, although the percentage of variance explained is still small.
To evaluate the clinical relevance of genetic ‘risk profiles’, we carried out a prospective analysis of the oldest cohort data. The genetic risk scores were predictive of dyslipidemia, improving discriminative accuracy, measured by AUC, from 63% (age, sex and BMI alone) to 66%. This improvement due to the genetic score is bigger than in most recently reported AUCs24 and suggests that genetic profiles may be useful for the early detection and treatment of dyslipidemias and related cardiovascular risk, thus enabling early preventive strategies. In line with earlier data14, we saw an improvement in CHD risk classification when adding the genetic profile to the ‘traditional’ clinical risk factors of lipid values, age, BMI and sex (such as Framingham25 or QRISK scores26). One noteworthy observation from our study is that the genetic risk profile identified for TC seems to represent the most informative score when relating the data to clinically relevant outcomes such as clinical hypercholesterolemia, intima media thickness and coronary heart disease. Until now, none of the GWA studies had targeted the TC phenotype (which represents a composite of LDL, HDL and VLDL cholesterol) for examination. Our findings suggest that the genetic score for TC is the most powerful option for predicting atherosclerosis and CHD.
We report here the first GWA study for serum lipid levels conducted in population cohorts, not ascertained for any specific disease. We identified a total of 22 loci, including six new ones. Some of these loci show different impact for males and females. The genetic risk scores constructed from the associated genes for each lipid trait provided explanatory value comparable to that of BMI. These genetic profiles seem to improve the identification of those at high risk of dyslipidemia but do not yet improve the prediction of atherosclerosis and CHD over classical risk factors.
METHODS
Study cohorts
We provide basic features of the population samples as well as the distribution of lipid values within individual cohorts and in the total study sample in Table 1. Informed consent was obtained from all study subjects and study protocols were approved by an appropriate local committee.
Twin sample
The Danish, Dutch, Finnish, Italian, Norwegian and Swedish national twin cohorts, together with St. Thomas’ twin cohort in Great Britain and an Australian twin cohort, form the basis of the GenomEUtwin project, a collection of over 300,000 twins27. From these cohorts, we selected female monozygotic pairs aged 20-80 years with blood lipid measurements available on both members. The sample consisted of pairs from Australia (459 pairs), Denmark (173 pairs), Finland (152 pairs), The Netherlands (331 pairs), Sweden (301 pairs) and the UK (462 monozygotic (MZ) pairs and 3,000 dizygotic (DZ) pairs). DNA samples from one member of each monozygotic twin pair were used for genotyping (twin cohort details; S.R. et al., unpublished data).
Northern Finnish Birth Cohort of 1966 (NFBC1966)
Mothers expected to give birth in the two northern provinces of Oulu and Lapland in 1966 were enrolled in NFBC1966 (n = 12,058 live births)28. At the 31-year clinical examination, participants provided fasting blood samples for evaluation of the metabolic measures that are the focus of the current study (n = 5654), and DNA was also extracted from the blood samples provided at this time. All DNA samples for the Illumina Infinium 370cnvDuo array were prepared for genotyping by the Broad Institute Biological Sample Repository (BSP) as a part of STAMPEED consortium funded by the US National Heart, Lung, and Blood Institute.
Rotterdam Study
The Rotterdam Study29 is a prospective cohort study that started in 1990 in Ommoord, a suburb of Rotterdam, among 10,994 men and women aged 55 and over. The main objective of the Rotterdam Study is to investigate the prevalence and incidence and risk factors for cardiovascular, neurological, locomotor and ophthalmologic diseases in the elderly. Baseline measurements were obtained between 1990 and 1993. All participants were subsequently examined in follow-up examination rounds every 2-3 years. For this study, we used 6,000 participants for whom GWA data were available; nonfasting total cholesterol and HDL was available for most study participants; fasting TC, HDL and TG were available for 2,300 participants of Rotterdam Study 3 (1997-1999). LDL was estimated using the Friedewald formula, eLDL = TC - HDL - 0.456 TG (mmol/l), using nonfasting samples only30. Nonfasting TC and HDL and fasting TG and estimated LDL were used in this study.
EUROSPAN
The European Special Populations Network (EUROSPAN) consortium consists of five population samples: (i) the Erasmus Ruchpen Family (ERF) study conducted in The Netherlands, (ii) the MICROS study conducted in Italy, (iii) the Northern Swedish Population (NSP), (iv) the Orkney Complex Disease Study (ORCADES; Scotland) and (v) the Vis study conducted in Croatia. All EUROSPAN cohorts were genotyped using Illumina 317K platform. A brief description of each population is given below.
The ERF study31 is a family-based study that includes over 3,000 participants descending from 22 couples living in the Rucphen region in the 19th century. Participants were clinically examined in person and provided fasting blood samples for metabolic measurements and DNA extraction. The 800 participants included in this study consisted of the first series of participants for whom GWA data were available.
The MICROS study32 is part of the genomic healthcare program ‘GenNova’. The MICROS was an extensive survey carried out during 2001-2003 in three villages of the Val Venosta on the populations of Stelvio, Vallelunga and Martello. Information on the health status of participants was collected through a standardized questionnaire, and lipids were measured with standard blood analyses. The 1,100 participants included in this study are those for whom both phenotypic and GWA data were available.
The Northern Swedish Population Health Study (NSPHS) represents a family-based prospective population study located in the parish of Karesuando, in the subartic region of the County of Norrbotten. This parish has about 1,500 inhabitants, 740 of whom participated in the study. Historic population accounts show that there has been little immigration or other dramatic population change in this area during the last 200 years. The study includes a comprehensive health investigation and collection of data on family structure, lifestyle, diet, medical history and samples for clinical chemistry, RNA and DNA analyses.
The Orkney Complex Disease Study (ORCADES) is an ongoing family-based genetic epidemiology collection in the isolated Scottish archipelago of Orkney. Genetic diversity is decreased compared to mainland Scottish samples, consistent with the high extent of endogamy historically. Samples from 800 individuals from a subgroup of ten islands with age 18-100 years were included in the present study.
The Vis study33 includes unselected Croatians, aged 18-93 years, who were recruited during 2003 and 2004 from the villages of Vis and Komiza on the Dalmatian island of Vis. Biochemical and physiological measurements were done, detailed genealogies reconstructed, questionnaire of lifestyle and environmental exposures collected, and blood samples and lymphocytes extracted and stored for further analyses. The 800 participants included in this study were these who had both GWA and phenotypic data available.
NTR/NESDA
The NTR/NESDA samples include Dutch twin families from the Netherlands Twin Register (NTR) and participants from the Netherlands Study of Depression and Anxiety (NESDA)34. We selected 1,862 unrelated participants with a depression or anxiety related diagnosis (MDD) and 1,857 unrelated controls at low liability for MDD for genome-wide genotyping with support of the US Foundation for the National Institutes of Health Genetic Association Information Network (FNIH/GAIN). This is the only cohort with some trait-specific ascertainment. Baseline characteristics of NTR and NESDA participants have been previously described34. The average age of participants was 43.6 years (65% women) and lipids were measured from fasting blood samples. Genotyping was conducted by Perlegen Sciences.
Cooperative health research in the Region of Augsburg (KORA)
The KORA research project has evolved from the WHO MONICA study (Monitoring of Trends and Determinants of Cardiovascular Disease). The KORA genome-wide association study was done using samples from the KORA S3 survey, which is a population-based sample from the general population living in the region of Augsburg, Southern Germany35. Standardized examinations of 4,856 participants, aged 25 to 74 years, were done during 1994-1995 (ref. 35) with followup examination of 3,006 participants in 2004-2005 (KORA F3). For the genome-wide study we selected 1,644 subjects from KORA S3/F3.
Genotyping
Most of the study cohorts used Infinium II assay36 on the HumanHap300-Duo Genotyping BeadChips (Illumina), although other chips, including Affymetrix, were used for 15% of the samples. Full details are given in Table 1. For the purpose of future meta-analysis, quality control was restricted to individual-level checks, done in each study group separately. The overall recommendation was to exclude individuals with low call rate, excess heterozygosity, mismatch between reported and genetically determined sex, SNP calls indicating simultaneous presence of two X and a Y chromosomes, or non-European ancestry. We used the identity-by-descent (IBD) analysis option of PLINK37 or the genomic kinship option of GenABEL38 to determine relatedness among our sample subjects, and to identify sample duplications. In population-based samples, this information was also used to identify sample contamination (subjects who seemed to be related to nearly everyone in the sample) and unexpected close relatives. If the sample duplication issue could not be resolved by external means, both samples were excluded. People of non-European ancestry were identified using principal components analysis of the IBD or genomic kinship matrices39 and excluded from analysis. Full details of the ENGAGE quality control and analysis report format recommendations can be found at the ENGAGE website (see URLs section below).
Before meta-analysis, individual study SNPs were filtered to satisfy call rate >90%, Hardy-Weinberg equilibrium (HWE) test P value >10-8 and minor allele frequency (MAF) >0.5%.
Statistical analysis
Within each cohort, blood lipid measurements were stratified by sex; in each stratum, outcomes were adjusted for age using a linear regression model and the residuals were standardized and used as outcome measures in the subsequent sex-specific association testing. In monozygotic twins, the mean of the two lipid measurements in a pair was used as the raw phenotype, thereby halving error variance and increasing power for association analysis (S.R., unpublished data). Triglycerides were log-transformed before regressing in all cohorts. For genotype-lipid association analyses, we assumed an additive mode of inheritance. Association analyses were conducted using GenABEL38 and PLINK37.
The results from all cohorts were combined into a fixed-effects meta-analysis with reciprocal weighting on the square of standard errors of the effect size estimates, using the MetABEL package. Genomic control correction40 was applied to correct standard errors before pooling. All population-based cohorts showed low overdispersion (λ < 1.05), whereas family-based cohorts (ERF, NSP, MICROS, ORCADES, Vis), as expected, showed larger values of λ. In the pooled data, λ was 1.02 for TC, LDL and HDL, and 1.01 for TG.
The difference between estimated effects in males and females was tested using the t-test. Population heterogeneity of effects was assessed using Cochran’s Q test.
The ranking of the SNP associations for each trait was the input for the GWANA pathway analysis. These SNPs were mapped to the human genes using cross-references in the Ensemble database and the genes were queried for their Gene Ontology annotations. The topology of the Gene Ontology tree was fully used by enumerating all available routes toward the root of the Gene Ontology tree and adding all available vertexes as Gene Ontology annotations of the given gene. For detecting the Gene Ontology gene groups (‘pathways’), a cumulative score based on how extreme the observed combination of associated genes in a given pathway is is compared to the all associated genes and their pathways. The more genes a pathway had among all top-ranked genes, the smaller the cumulative score. The observed cumulative scores were further compared with permuted values, where the original SNP-based P-value ranks were permuted and the cumulative scores were recalculated for each permutation round. The top pathways and their permuted scores are reported in the Supplementary Table 2 and Supplementary Figure 4.
In the Rotterdam Study, where we tested effects of risk scores on lipid levels, intima media thickness and coronary heart disease, ~2.5 million SNPs were imputed using release 22 HapMap CEU population as reference. The imputations were done using MACH software41. The quality of imputations was checked by comparing imputed and actual genotypes at 78,844 SNPs not present on the Illumina 550K array for 437 individuals for whom these SNPs were directly typed using the Affymetrix 500K chip. Using the ‘best guess’ genotype for imputed SNPs, we calculated a concordance rate of 99% for SNPs with R2 (ratio of the variance of imputed genotypes to the binomial variance) quality measure greater than 0.9; concordance was still high (94%) when R2 was between 0.5 and 0.9. All SNPs analyzed for association with lipid levels, except two, had R2 > 0.96; two exceptions were rs4775041 (R2 = 0.83) and rs439401 (R2 = 0.65).
Genetic scores were used to assess the proportion of variance explained by lipid genes and their impact onto clinically relevant outcomes (intima media thickness, coronary heart disease and dyslipidemia). We used a genetic score defined as a weighted sum of the risk alleles, with weights proportional to the effect estimates obtained in meta-analysis. Risk alleles were defined as those increasing levels of TC, LDL or TG, or decreasing the levels of HDL. Five genetic scores (TC, LDL, HDL, TG and total) were analyzed.
To avoid bias in estimation of the proportion of variance explained by the risk score in a particular cohort, we re-estimated the weights of the risk score (allelic effects) by meta-analysis of all cohorts except the one where the proportion was computed afterwards. For example, when estimating the proportion of variance explained in the Rotterdam Study, we used allelic effect estimates from meta-analysis of all studies but the Rotterdam Study, and so on.
We analyzed association of the allele scores with incident CHD and dyslipidemia in the Rotterdam study using SPSS 15.0. For analysis of incident CHD, we used the Cox proportional hazards model to estimate hazard ratios and the significance of their deviation from unity. Association between the genetic risk score and dyslipidemia at baseline was assessed using logistic regression. Four prediction models were investigated: (i) age and sex; (ii) age, sex and allele score; (iii) age, sex and clinical variables; and (iv) age, sex, clinical variables and allele score. The contribution of the allele scores to the prediction of CHD and dyslipidemia was investigated by comparing the area under the receiver-operating-characteristic curves (AUC) of the prediction models. AUC estimates were obtained using the ROC plot function of SPSS, on the basis of the linear predictors obtained from the Cox proportional hazards analyses and the predicted probabilities from the logistic regression analyses. Dyslipidemia was defined as total cholesterol levels equal or higher than 6.5 mmol/l.
The proportion of explained variance was assessed in the Rotterdam Study, NFBC66 and MZ twin cohorts. Because some of these cohorts were matched for sex or age, we stratified for sex and used residuals from linear regression of the lipid levels on age to estimate the comparative effect of genetic score and body mass index (BMI). The proportion of variance attributable to each of the two predictors was assessed by fitting an ANOVA analysis of the linear regression model (“lm” and “anova” functions of R).
Supplementary Material
ACKNOWLEDGMENTS
Above all, we thank study participants for making this work possible. We thank H.-Y. Shen and M. Allen for ENGAGE project management and M. Krestyaninova for IT-system setup.
The research leading to these results has received funding from the European Community’s Seventh Framework Programme (FP7/2007-2013)/grant agreement HEALTH-F4-2007-201413 by the European Commission under the programme ‘Quality of Life and Management of the Living Resources’ of 5th Framework Programme (no. QLG2-CT-2002-01254). The Finnish Heart Association (M.P., L.P.) is gratefully acknowledged for its financial support. L.P. and J.K. have been supported by the Academy of Finland Centre of Excellence in Complex Disease Genetics.
NFBC genotyping was supported on NHLBI grant 5R01HL087679-02 through the STAMPEED program.
EUROSPAN (European Special Populations Research Network) was supported by European Commission FP6 STRP grant number 018947 (LSHG-CT-2006-01947). For the MICROS study in South Tyrol, we thank the primary care practitioners R. Stocker, S. Waldner, T. Pizzecco, J. Plangger, U. Marcadent and the personnel of the Hospital of Silandro (Department of Laboratory Medicine) for their participation and collaboration in the research project. In South Tyrol, the study was supported by the Ministry of Health of the Autonomous Province of Bolzano and the South Tyrolean Sparkasse Foundation.
NTR/NESDA was supported by “Genetic basis of anxiety and depression” program (NWO 904-61-090); Twin-family database for behavior genomics studies (NWO 480-04-004); Center for Medical Systems Biology (NWO Genomics); Spinozapremie (SPI 56-464-14192); Centre for Neurogenomics and Cognitive Research (CNCR-VU); Genome-wide analyses of European twin and population cohorts (EU/QLRT-2001-01254); Geestkracht program of ZonMW (10-000-1002); and matching funds from universities and mental health care institutes involved in NESDA (GGZ Buitenamstel-Geestgronden, Rivierduinen, University Medical Center Groningen, GGZ Lentis, GGZ Friesland, GGZ Drenthe). Major funding for this project is from the Genetic Association Information Network of the Foundation for the US National Institutes of Health, a public-private partnership between the NIH and Pfizer, Affymetrix and Abbott Laboratories.
The MONICA/KORA Augsburg studies were financed by the Helmholtz Zentrum München, German Research Center for Environmental Health, Neuherberg, Germany and supported by grants from the German Federal Ministry of Education and Research (BMBF). Part of this work was financed by the German National Genome Research Network (NGFN) and by the “Genomics of Lipid-associated Disorders - GOLD” of the “Austrian Genome Research Programme GEN-AU”. The KORA research was supported within the Munich Center of Health Sciences (MC Health) as part of LMUinnovativ. We gratefully acknowledge the contribution of P. Lichtner, G. Eckstein and T. Strom and all other members of the Helmholtz Zentrum München genotyping staff in generating and analyzing the SNP dataset. We thank all members of field staffs who were involved in the planning and conduct of the MONICA/KORA Augsburg studies. Finally, we express our appreciation to all study participants.
Genome-wide genotyping of the Rotterdam Study was supported by NWO (175.010.2005.011). The Vis study in the Croatian island of Vis was supported through the grants from the Medical Research Council UK to H.C., A.W. and I.R.; and Ministry of Science, Education and Sport of the Republic of Croatia to I.R. (number 108-1080315-0302). The ERF study was supported by grants from The Netherlands Organisation for Scientific Research, Erasmus MC and the Centre for Medical Systems Biology (CMSB). We are grateful to all study participants and their relatives, general practitioners and neurologists for their contributions and to P. Veraart for her help in genealogy, J. Vergeer for the supervision of the laboratory work and P. Snijders for his help in data collection. The Northern Swedish Population Health Study was funded by the Swedish Medical Research Council and the European Commission through the EUROSPAN project. We are greatly indebted to the participants in the study. The ORCADES study was supported by the Scottish Executive Health Department, the Royal Society and the Wellcome Trust Clinical Research Facility. We would like to acknowledge the data collection team in Orkney, the clerical team in Edinburgh and the people of Orkney.
Footnotes
URLs. ENGAGE consortium, http://www.euengage.org/; PLINK software for GWA analysis, http://pngu.mgh.harvard.edu/~purcell/plink/; GenABEL software for GWA analysis and MetABEL for GWA meta-analysis, http://mga.bionet.nsc.ru/~yurii/ABEL/; MACH software for SNP imputations, http://www.sph.umich.edu/csg/abecasis/MaCH/index.html; R language and environment: http://www.r-project.org/.
References
- 1.Pilia G, et al. Heritability of cardiovascular and personality traits in 6,148 Sardinians. PLoS Genet. 2006;2:e132. doi: 10.1371/journal.pgen.0020132. [DOI] [PMC free article] [PubMed] [Google Scholar]
- 2.Kannel WBDT, Kagan A, Revotskie N, Stokes JI. Factors of risk in the development of coronary heart disease-six year follow-up experience. The Framingham Study. Ann. Intern. Med. 1961;55:33–50. doi: 10.7326/0003-4819-55-1-33. [DOI] [PubMed] [Google Scholar]
- 3.Miller NE, Letter MG. High-density lipoprotein and atherosclerosis. Lancet. 1975;1:1033. doi: 10.1016/s0140-6736(75)91977-7. [DOI] [PubMed] [Google Scholar]
- 4.Friedlander YAA, Newman B, Edwards K, Mayer-Davis EJ, King M-C. Heritability of longitudinal changes in coronary-heart-disease risk factors in women twins. Am. J. Hum. Genet. 1997;60:1502–1512. doi: 10.1086/515462. [DOI] [PMC free article] [PubMed] [Google Scholar]
- 5.Kathiresan S, Musunuru K, Orho-Melander M. Defining the spectrum of alleles that contribute to blood lipid concentrations in humans. Curr. Opin. Lipidol. 2008;19:122–127. doi: 10.1097/MOL.0b013e3282f70296. [DOI] [PubMed] [Google Scholar]
- 6.Kooner J, et al. Genome-wide scan identifies variation in MLXIPL associated with plasma triglycerides. Nat. Genet. 2008;40:149–151. doi: 10.1038/ng.2007.61. [DOI] [PubMed] [Google Scholar]
- 7.Kathiresan S, et al. Six new loci associated with blood low-density lipoprotein cholesterol, high-density lipoprotein cholesterol or triglycerides in humans. Nat. Genet. 2008;40:189–197. doi: 10.1038/ng.75. [DOI] [PMC free article] [PubMed] [Google Scholar]
- 8.Willer CJ, et al. Newly identified loci that influence lipid concentrations and risk of coronary artery disease. Nat. Genet. 2008;40:161–169. doi: 10.1038/ng.76. [DOI] [PMC free article] [PubMed] [Google Scholar]
- 9.Wallace C, et al. Genome-wide association study identifies genes for biomarkers of cardiovascular disease: serum urate and dyslipidemia. Am. J. Hum. Genet. 2008;82:139–149. doi: 10.1016/j.ajhg.2007.11.001. [DOI] [PMC free article] [PubMed] [Google Scholar]
- 10.Sandhu M, Waterworth D, Debenham S, Wheeler W, Papadakis K. LDL-cholesterol concentrations: a genome-wide association study. Lancet. 2008;371:483–491. doi: 10.1016/S0140-6736(08)60208-1. [DOI] [PMC free article] [PubMed] [Google Scholar]
- 11.Heid I, et al. A genome-wide association analysis of HDL cholesterol in the population-based KORA Study sheds new light on intergenic regions. Circulation. Cardiovas.-Genet. 2008;1:10–20. doi: 10.1161/CIRCGENETICS.108.776708. [DOI] [PubMed] [Google Scholar]
- 12.Sing C, Davignon J. Role of the apolipoprotein E polymorphism in determining normal plasma lipid and lipoprotein variation. Am. J. Hum. Genet. 1985;37:268–285. [PMC free article] [PubMed] [Google Scholar]
- 13.Law S, et al. The molecular biology of human apoA-I, apoA-II, apoC-II and apoB. Adv. Exp. Med. Biol. 1986;201:151–162. doi: 10.1007/978-1-4684-1262-8_14. [DOI] [PubMed] [Google Scholar]
- 14.Kathiresan S, et al. Polymorphisms associated with cholesterol and risk of cardiovascular events. N. Engl. J. Med. 2008;358:1240–1249. doi: 10.1056/NEJMoa0706728. [DOI] [PubMed] [Google Scholar]
- 15.Wang K, Li M, Bucan M. Pathway-based approaches for analysis of genome-wide association studies. Am. J. Hum. Genet. 2007;81:1278–1283. doi: 10.1086/522374. [DOI] [PMC free article] [PubMed] [Google Scholar]
- 16.Rudkowska I, Jones P. Polymorphisms in ABCG5/G8 transporters linked to hypercholesterolemia and gallstone disease. Nutr. Rev. 2008;66:343–348. doi: 10.1111/j.1753-4887.2008.00042.x. [DOI] [PubMed] [Google Scholar]
- 17.Sabatti C, et al. Genome-wide association analysis of metabolic phenotypes in a birth cohort from a founder population. Nat. Genet. 2008 Dec 7; doi: 10.1038/ng.271. advance online publication, doi:10.1038/ng.271. [DOI] [PMC free article] [PubMed] [Google Scholar]
- 18.Weiss L, Pan L, Abney M, Ober C. The sex-specific genetic architecture of quantitative traits in humans. Nat. Genet. 2006;38:218–222. doi: 10.1038/ng1726. [DOI] [PubMed] [Google Scholar]
- 19.Tunstall-Pedoe H, et al. MONICA Monograph and Multimedia Sourcebook. World Health Organization; Geneva: 2003. [Google Scholar]
- 20.Endo A. The discovery and development of HMG-CoA reductase inhibitors. J. Lipid Res. 1992;33:1569–1582. [PubMed] [Google Scholar]
- 21.Kasper D. Harrison’s Principles of Internal Medicine. McGraw-Hill; New York: 2005. [Google Scholar]
- 22.Chasman D, et al. Pharmacogenetic study of statin therapy and cholesterol reduction. J. Am. Med. Assoc. 2004;291:2821–2827. doi: 10.1001/jama.291.23.2821. [DOI] [PubMed] [Google Scholar]
- 23.Howard B, Ruotolo G, Robbins D. Obesity and dyslipidemia. Endocrinol. Metab. Clin. North Am. 2003;32:855–867. doi: 10.1016/s0889-8529(03)00073-2. [DOI] [PubMed] [Google Scholar]
- 24.Janssens A, van Duijn C. Genome-based prediction of common diseases: advances and prospects. Hum. Mol. Genet. 2008;17:166–173. doi: 10.1093/hmg/ddn250. [DOI] [PubMed] [Google Scholar]
- 25.Anderson K, Odell P, Wilson P, Kannel W. Cardiovascular disease risk profiles. Am. Heart J. 1991;121:293–298. doi: 10.1016/0002-8703(91)90861-b. [DOI] [PubMed] [Google Scholar]
- 26.Hippisley-Cox J, Coupland C, Vinogradova Y, Robson J, Brindle P. Performance of the QRISK cardiovascular risk prediction algorithm in an independent UK sample of patients from general practice: a validation study. Heart. 2008;94:34–39. doi: 10.1136/hrt.2007.134890. [DOI] [PubMed] [Google Scholar]
- 27.Peltonen L. GenomEUtwin: a strategy to identify genetic influences on health and disease. Twin Res. 2003;6:354–360. doi: 10.1375/136905203770326358. [DOI] [PubMed] [Google Scholar]
- 28.Rantakallio P. Groups at risk in low birth weight infants and perinatal mortality. Acta Paediatr. Scand. 1969;193:1. [PubMed] [Google Scholar]
- 29.Hofman A, et al. The Rotterdam Study: objectives and design update. Eur. J. Epidemiol. 2007;22:819–829. doi: 10.1007/s10654-007-9199-x. [DOI] [PMC free article] [PubMed] [Google Scholar]
- 30.Friedewald WT, Levy RI, Fredrickson DS. Estimation of the concentration of low-density lipoprotein cholesterol in plasma, without use of the preparative ultracentrifuge. Clin. Chem. 1972;18:499–502. [PubMed] [Google Scholar]
- 31.Pardo LM, MacKay I, Oostra B, van Duijn CM, Aulchenko YS. The effect of genetic drift in a young genetically isolated population. Ann. Hum. Genet. 2005;69:288–295. doi: 10.1046/j.1529-8817.2005.00162.x. [DOI] [PubMed] [Google Scholar]
- 32.Pattaro C, et al. The genetic study of three population microisolates in South Tyrol (MICROS): study design and epidemiological perspectives. BMC Med. Genet. 2007;8:29. doi: 10.1186/1471-2350-8-29. [DOI] [PMC free article] [PubMed] [Google Scholar]
- 33.Rudan I, Campbell H, Rudan P. Genetic epidemiological studies of eastern Adriatic Island isolates, Croatia: objective and strategies. Coll. Antropol. 1999;23:531–546. [PubMed] [Google Scholar]
- 34.Boomsma D, et al. Genome-wide association of major depression: description of samples for the GAIN Major Depressive Disorder Study: NTR and NESDA biobank projects. Eur. J. Hum. Genet. 2008;16:335–342. doi: 10.1038/sj.ejhg.5201979. [DOI] [PubMed] [Google Scholar]
- 35.Wichmann H, Gieger C, Illig T. KORA-gen-resource for population genetics, controls and a broad spectrum of disease phenotypes. Gesundheitswesen. 2005;67:S26–S30. doi: 10.1055/s-2005-858226. [DOI] [PubMed] [Google Scholar]
- 36.Steemers F, et al. Whole-genome genotyping with the single-base extension assay. Nat. Methods. 2006;3:31–33. doi: 10.1038/nmeth842. [DOI] [PubMed] [Google Scholar]
- 37.Purcell S, et al. PLINK: a tool set for whole-genome association and population-based linkage analysis. Am. J. Hum. Genet. 2007;81:559–575. doi: 10.1086/519795. [DOI] [PMC free article] [PubMed] [Google Scholar]
- 38.Aulchenko YS, Ripke S, Isaacs A, van Duijn CM. GenABEL: an R library for genome-wide association analysis. Bioinformatics. 2007;23:1294–1296. doi: 10.1093/bioinformatics/btm108. [DOI] [PubMed] [Google Scholar]
- 39.Price AL, et al. Principal components analysis corrects for stratification in genome-wide association studies. Nat. Genet. 2006;38:904–909. doi: 10.1038/ng1847. [DOI] [PubMed] [Google Scholar]
- 40.Bacanu SA, Devlin B, Roeder K. The power of genomic control. Am. J. Hum. Genet. 2000;66:1933–1944. doi: 10.1086/302929. [DOI] [PMC free article] [PubMed] [Google Scholar]
- 41.Scott L, et al. A genome-wide association study of type 2 diabetes in Finns detects multiple susceptibility variants. Science. 2007;316:1341–1345. doi: 10.1126/science.1142382. [DOI] [PMC free article] [PubMed] [Google Scholar]
Associated Data
This section collects any data citations, data availability statements, or supplementary materials included in this article.