Abstract
The coelacanth, a “living fossil,” lives near the coast of the Comoros archipelago in the Indian Ocean. Living at a depth of about 200 m, the Comoran coelacanth receives only a narrow range of light, at about 480 nm. To detect the entire range of “color” at this depth, the coelacanth appears to use only two closely related paralogous RH1 and RH2 visual pigments with the optimum light sensitivities (λmax) at 478 nm and 485 nm, respectively. The λmax values are shifted about 20 nm toward blue compared with those of the corresponding orthologous pigments. Mutagenesis experiments show that each of these coadapted changes is fully explained by two amino acid replacements.
The coelacanth, Latimeria chalumnae, is the sole surviving species of the old lineage of crossopterygian fishes that were abundant during the Devonian period. The morphology of the coelacanth has changed very little over 400 million years (1–3). This “living fossil” lives at a depth of about 200 m near the Comoros archipelago in the western Indian Ocean (4, 5). Living at a depth of 200 m, the Comoran coelacanths receive only a narrow range of color, at about 480 nm (6). To see in this photic environment, the retina of the coelacanth consists mostly of rods, with a much smaller number of cones (7, 8). The molecular genetic basis of coelacanth vision is unknown, although one visual pigment from the Comoran coelacanth has been identified (9). Here we report the structure and function of the opsin genes of the coelacanth and elucidate how the coelacanth has modified its visual pigments to adapt to its natural habitat.
Visual pigments consist of a chromophore, 11-cis retinal, and a transmembrane protein, an opsin (10). Vertebrate retinal opsins (or pigments) are classified into five evolutionarily distinct groups: (i) rhodopsin (RH1), (ii) RH1-like (RH2), (iii) short wavelength-sensitive (SWS1), (iv) SWS1-like (SWS2), and (v) long wavelength-sensitive (LWS) or middle wavelength-sensitive (MWS) (LWS/MWS) opsin clusters (11–13). RH1 pigments are usually expressed in rods and the four other classes of pigments in cones. All five classes of pigments appear to have coexisted in the common ancestor of vertebrates (11–13). A central unanswered question in phototransduction is how these visual pigments achieve the wavelength of maximal absorption (λmax) ranging from 360 nm (ultraviolet) to 700 nm (infrared). Recent molecular genetic analyses show that the difference in the λmax values of LWS/MWS pigments in mammals is primarily controlled by amino acids at five critical sites (14). Receiving a restricted range of light, the Comoran coelacanth provides an excellent opportunity to study not only the molecular basis of blue-shifted color vision but also the processes of adaptive evolution to its unique photic environment.
MATERIALS AND METHODS
Genomic DNA Library Cloning and DNA Sequencing.
Genomic DNA was isolated from the Comoran coelacanth, which was obtained from the American Museum of Natural History, NY (tissue loan no. AMNH 59196). A genomic library of this coelacanth was constructed with BamHI-digested λEMBL3 vector and Sau3AI partially digested coelacanth genomic DNA (10–20 kb). By using bovine RH1 and human SWS1 cDNAs as probes, we screened about 1.4 × 10⁶ and 107 recombinant plaques, respectively. From the first screening, we isolated two clones, λLc16 and λLc58, which represent two distinct functional opsin genes. From the second screening, we isolated two nonoverlapping clones, λLc17 and λLc01, which represent a pseudogene. These genomic clones were subcloned into pBluescript SK(−), and the nucleotide sequences were determined for both strands by the dideoxy-chain-termination method (15).
Creation of Minigenes and Site-Directed Mutagenesis.
The five exon regions of each of the two functional opsin genes were PCR-amplified by using five sets of oligonucleotides. For λLc16, we used 5′-CCAAGGGAATTCCACCATGAATGGAACAGAGGGTCC-3′ (forward) and 5′-TTACCTCCTAGGGTAGCGAAAAATCCCTCAAT-3′ (reverse) for exon 1, 5′-CCTTCCCCTAGGAGGTCAAGTTGCTCTGTGG-3′ (forward) and 5′-GAGCTATCTAGACCATCCGAAAAGAGGAGGAAC-3′ (reverse) for exon 2, 5′-CTGAATTCTAGATATATCCCAGAGGGTATGCA-3′ (forward) and 5′-ACAAAGCTGCAGCATCCTTGACAGTGCAGAC-3′ (reverse) for exon 3, 5′-TTAGGCTGCAGCACAGCAGCAGGAGTCTGCC-3′ (forward) and 5′-TTTGGCATCCGGAACTGTTTGTTCAGGAGAATGTAG-3′ (reverse) for exon 4, and 5′-TACAGTTCCGGAACTGCAT GATCACCACCCTC-3′ (forward) and 5′-CCGCAGGTCGACGCGGGTGAGACACTGCTGGA-3′ (reverse) for exon 5. The underlined sequences indicate restriction enzyme site for cloning purposes. The extra 5–6 nt at the 5′ end are to facilitate restriction enzyme digestion. For λLc58, we used 5′-CAAACAGAATTCCACCATGAACGGCACGGAA-3′ (forward) and 5′-CTACCTCCTAGGGTGGCAAAGAAACCCTCCAT-3′ (reverse) for exon 1, 5′-TTCCTTCCTAGGAGGTCAGGTAGCTCTCTGG-3′ (forward) and 5′-ACCAA TCTAGACCAGCCAACGAGTGGCGGTGC-3′ (reverse) for exon 2, 5′-CCTTTTTCTAGATATATCCCCGAGGGACTGCAG-3′ (forward) and 5′-AAACAACTGCAGCCTCTTTGACTTTGCAGAT-3′ (reverse) for exon 3, 5′-CCAGGCTGCAGCACAACAGCAGGAATCTGCA-3′ (forward) and 5′-AAGAGCATCCGGAACTGCTTGTTCAACAACAC-3′ (reverse) for exon 4, and 5′-TCTAGTTCCGGAACTGTATGATCACCACGTTG-3′ (forward) and 5′-GAAGTGGTCGACGCGGGCGAAACCTGACTGGA-3′ (reverse) for exon 5. PCR was performed by using 30 cycles at 92°C for 45 sec, 55°C for 60 sec, and 72°C for 90 sec. At each cycle, the duration of the extension reaction was progressively extended by 3 sec. The PCR products were digested by appropriate restriction enzymes and ligated into pBluescript SK (−). Nucleotide sequences of the entire regions of the minigenes were determined. We selected clones that encode identical amino acid sequences to those of the corresponding sequences deduced from the genomic sequences.
Mutants were generated by using QuikChange site-directed mutagenesis kit from Stratagene. All DNA fragments that were subjected to mutagenesis were sequenced to rule out spurious mutations.
Absorption Spectra.
The two coelacanth minigenes were ligated into an expression vector pMT, expressed in cultured COS1 cells, and regenerated with 11-cis retinal, and the resulting visual pigments were purified as described (16, 17). UV–visible spectra were recorded at 20°C by using a Hitachi U-3000 dual beam spectrophotometer. Visual pigments were bleached for 3 min by using a 60 W standard light bulb equipped with a Kodak Wratten no. 3 filter at a distance of 20 cm. Data were analyzed with sigmaplot software (Jandel, San Rafael, CA).
Sequence Data Analyses.
The amino acid sequences of the coelacanth visual pigments were compared with those of other vertebrate pigments. The root of the phylogenetic tree of these pigments was determined by using goldfish LWS (GenBank accession no. L11867), African clawed frog LWS (U90895), chicken LWS (M62903), and human MWS (K03490–K03497) pigments as the outgroup. The number (K) of amino acid replacements per site for a pair of sequences was estimated by K = −ln (1 − p), where p is the proportion of different amino acids per site. Topology and branch lengths of the phylogenetic tree were evaluated by using the neighbor-joining method (18). The reliability of the neighbor-joining tree topology was evaluated by the bootstrap analysis with 1,000 replications (19).
The amino acid sequences of ancestral pigments were inferred by using likelihood-based Bayesian method (20) with a modified version of the Jones, Taylor, and Thorton (JTT; ref. 21), Dayhoff (22), and the equal-input models (20) of amino acid replacements.
RESULTS AND DISCUSSION
Coelacanth Opsin Genes.
To determine what types of opsin genes the Comoran coelacanths possess, we hybridized Southern blots containing the coelacanth genomic DNA, digested with various restriction enzymes, to bovine RH1 (23), human SWS1 (24), and human LWS (24) opsin cDNAs separately. The Southern analysis revealed strongly hybridizing bands to the first two probes, but no band to the third probe (data not shown). Thus, the coelacanth has RH1 and SWS1-like genes but no LWS/MWS genes.
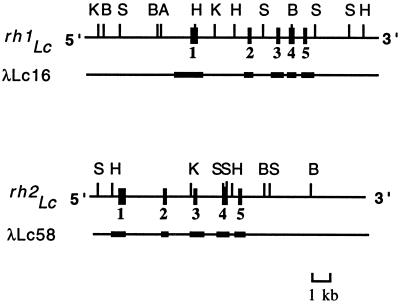
After genomic DNA library screening using bovine RH1 opsin cDNA as a probe, we isolated 12 positive phage clones. Among these, λLc16 and λLc58 were found to contain the entire coding regions of functional opsin genes, designated as rh1Lc and rh2Lc, respectively (Fig. 1). Similarly, by using human SWS1 opsin cDNA as a probe, we isolated 13 positive clones. Among these, 2 nonoverlapping clones, λLc17 containing exons 1 and 2 and λLc01 containing exons 3 and 4, were found to represent a pseudogene, designated as ψsws1Lc. As previously noted, the coelacanth does not have any LWS/MWS opsin genes. From an extensive screening of genomic DNA library with human SWS1 opsin cDNA as a probe, we could isolate only one SWS1 pseudogene. This strongly suggests that the coelacanth has also lost a functional SWS2 opsin gene.
Figure 1.
λclones and sequencing strategies of rh1Lc and rh2Lc. The five exons are indicated by black boxes in the restriction maps. DNA segments subcloned and sequenced are represented as thick bars in λ clones. A, SalI; B, BamHI; H, HindIII; K, KpnI; S, SstI.
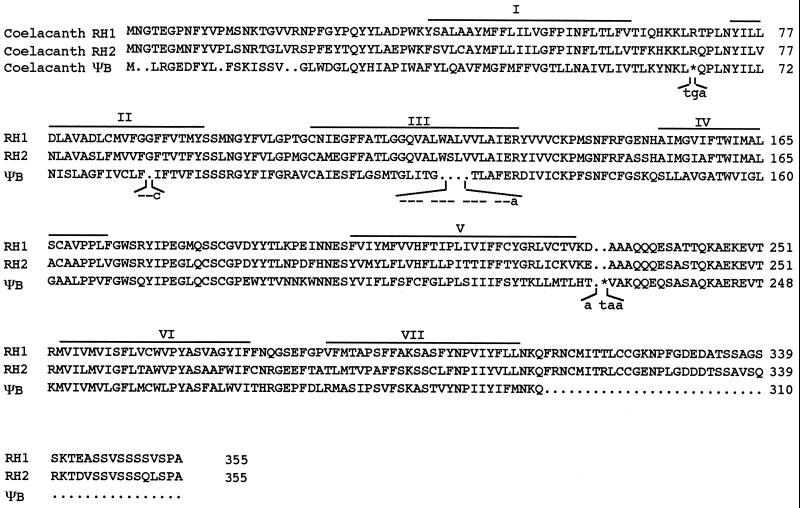
The RH1Lc and RH2Lc opsins, deduced from the DNA sequences of rh1Lc and rh2Lc, consist of 355 aa (Fig. 2). The pseudogene ψsws1Lc contains premature stop codons because of nonsense and frameshift mutations (Fig. 2). When the coding regions of rh1Lc and rh2Lc are compared, the proportion of identical nucleotides is 70%. When rh1Lc and rh2Lc are compared with bovine rh1, the sequence similarities are given by 76% and 71%, respectively. Thus, rh1Lc is more closely related to bovine rh1 gene than to rh2Lc, suggesting that rh1Lc and rh2Lc were duplicated before the vertebrate radition.
Figure 2.
The deduced amino acid sequences of coelacanth RH1 (RH1Lc), coelacanth RH2 (RH2Lc), and coelacanth ψB (ψBLc). Gaps, denoted by dots, were inserted in the sequences for the optimal alignment. Deletion, insertion, and nonsense nucleotide mutations in ψsws1Lc are noted by lower case letters. ∗ indicates a stop codon. Exon 5 of ψsws1Lc is missing. Putative transmembrane domains I–VII are indicated by horizontal lines.
Evolution of Coelacanth Visual Pigments.
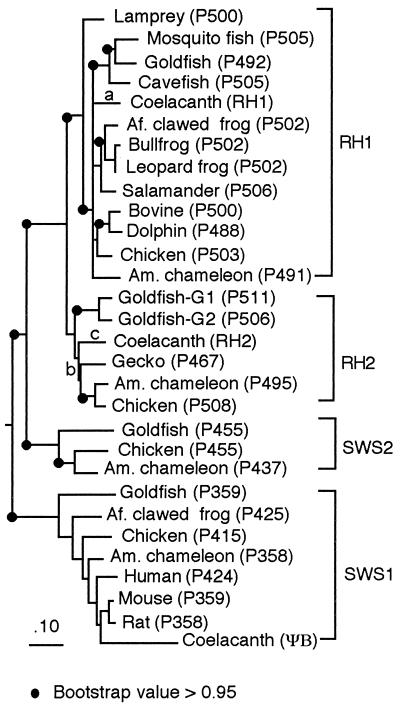
Fig. 3 shows the rooted phylogenetic tree of RH1Lc, RH2Lc, ψBLc, deduced from ψsws1Lc, and RH1, RH2, SWS1, and SWS2 pigments in other vertebrates whose λmax values have been directly determined. The bootstrap values of forming RH1, SWS1, and SWS2 clusters are 99%, 100%, and 100%, respectively, and are highly reliable, but that for RH2 cluster is only 81%. Note that RH1 cluster includes a wide range of vertebrates, from lamprey to mammals, and furthermore, the bootstrap value of forming the cluster of RH1 and RH2 groups is 100%. Thus, RH1 and RH2 clusters consist of two sets of paralogous pigments. These observations show that RH1Lc, RH2Lc, and ψBLc belong to the RH1, RH2, and SWS1 clusters, respectively.
Figure 3.
Phylogenetic tree of vertebrate visual pigments whose λmax values (given after P) have been evaluated. Opsin (or visual pigment) names and their references (accession numbers) are: lamprey, Lamptera japonica (M63632); mosquito fish, Gambusia affinis (Y11146); goldfish, Carassius auratus (L11863); cavefish, Astyanax fasciatus (U12328); African clawed frog, Xenopus laevis (L07770); bullfrog, Rana catesbeiona (S79840); leopard frog, Rana pipiens (S49004); salamander, Ambystoma tigrinum (U36574); American chameleon, Anolis caloninensis (L31503); chicken, Gallus gallus (D00702); bovine, Bos taurus (M21606); and dolphin, Tursiops truncatus (AF055456) for RH1 cluster; goldfish-G1 (L11865) and -G2 (L11866); chicken (M92038); American chameleon (31); and gecko, Gekko gekko (M92035) for RH2 cluster; goldfish (D85863); African clawed frog (U23463); American chameleon (32); chicken (M92039); human, Homo sapiens (M13295); mouse, Mus musculus (U49720); and rat, Rattus norvegicus (U63972) for SWS1 cluster; and goldfish (L11864); American chameleon (32); and chicken (M92037) for SWS2 cluster.
Within the SWS1 cluster, ψBLc is most closely related to mammalian opsins, but this “misclassification” is probably caused by the much faster evolutionary rate of ψsws1Lc, a characteristic of pseudogenes. Fig. 3 suggests that, in the RH1 cluster, American chameleon (P491) pigment is not closely related to chicken (P503) pigment. This unexpected tree topology arises because of an accelerated rate of amino acid replacements in the former pigment in the rodless American chameleon (13). In the RH2 cluster, the American chameleon (P495) pigment is more closely related to the chicken pigment than to the gecko pigment. This may be explained not only by the accelerated evolutionary rate of the gecko pigment but also by the decelerated rate of the chicken pigment. This can be seen by making pairwise comparisons of chicken (P508), gecko (P467), and American chameleon (P495) pigments with an appropriate outgroup. For example, although they are not statistically significant, chicken (P508) pigment has shorter branch lengths than gecko (P467) and American chameleon (P495) pigments (Table 1). The branch length, 0.149, for gecko (P467) pigment is significantly longer than 0.003 for American chameleon (P495) pigment (Table 1).
Table 1.
The numbers of amino acid replacements per site (K × 100) in the RH2 cluster
| Branch (pigment)
| |||
|---|---|---|---|
| Chicken (P508) | Gecko (P467) | American chameleon (P495) | Outgroup (pigment) |
| 3.1 ± 0.95 | — | 4.9 ± 1.21 | Goldfish (P511) |
| 7.8 ± 1.52 | 12.2 ± 1.93 | — | Goldfish (P511) |
| — | 14.9 ± 2.15* | 3.0 ± 0.93* | Chicken (P508) |
, Significantly different at 1% level.
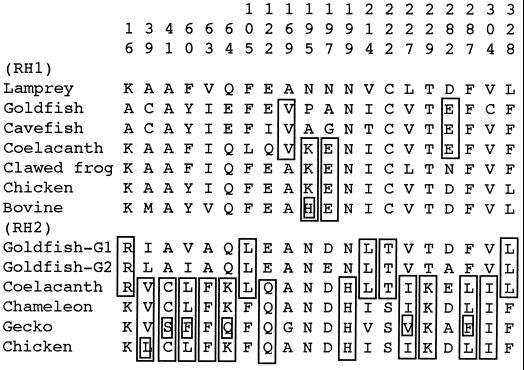
It is widely accepted that tetrapods originated from lobe-finned fish, which include the coelacanth (25). According to this scenario, RH1Lc and RH2Lc pigments should be more closely related to tetrapod pigments than to ray-finned fish pigments within each orthologous group. Although the opsin sequences alone are not sufficient to resolve the divergence of the coelacanths, tetrapods, and bony fishes (Fig. 3), there is other considerable evidence to support a common ancestor for tetrapods and coelacanth (25). But, if the coelacanth is more closely related to tetrapods than to ray-finned fishes, then amino acid replacements that occurred in the early stages of the coelacanth evolution are expected to be shared more often with tetrapods than with ray-finned fishes. Such shared amino acid replacements can be traced by inferring the amino acid sequences of the ancestral RH1 and RH2 pigments. Applying the JTT model of amino acid replacements, we inferred the amino acid sequences of all ancestral RH1 and RH2 pigments. Then, by comparing the amino acids of RH1Lc and RH2Lc pigments with those at the corresponding sites of the orthologous ancestral pigments, 20 shared amino acid replacements can be identified (Fig. 4). Among these, 13 favor the closer relationship of the coelacanth and tetrapods, whereas 7 disfavor the relationship. Even when the coelacanth pigments are assumed to be more closely related to ray-finned fishes than to tetrapods, the ratio between the favorable and unfavorable amino acid replacements becomes 12:7. Similar ratios were obtained with the Dayhoff and equal-input models of amino acid replacements (data not shown). Although none of the ratios is significantly different from 1:1, they do suggest a closer relationship between the coelacanth and tetrapods. Of interest, the rh1 genes of the coelacanth and tetrapods contain four introns at identical positions, whereas those of ray-finned fishes contain no introns, having lost them during evolution (26). These observations are compatible with the notion that the coelacanth is more closely related to tetrapods than to ray-finned fishes.
Figure 4.
Amino acid replacements at informative residues of RH1Lc and RH2Lc pigments. Those surrounded by a single rectangle denote a 1-aa replacement event. Ancestral amino acids were inferred by considering tree topology: (((lamprey [P500], ((goldfish [P492], cavefish [P505]), (RH1Lc, (African clawed frog [P502], (chicken [P503], bovine [P500]))))), ((goldfish [P511], goldfish [P506]), (RH2Lc, ((gecko [P467], American chameleon [P495]), chicken [P508])))), (goldfish [P455], (chicken [P455], American chameleon [P437]))).
Absorption Spectra of RH1Lc and RH2Lc Pigments.
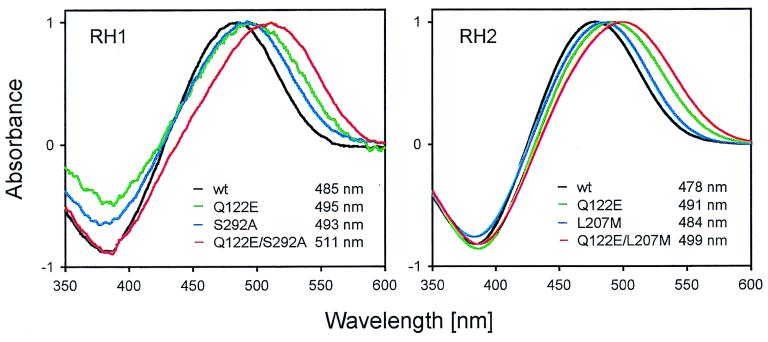
The spectral sensitivity of visual pigments usually is evaluated directly by expressing opsin cDNAs in cultured cells (16, 17). However, because the retina of the coelacanth is not available to us, the 5′- and 3′-flanking regions and the four intron segments of rh1Lc and rh2Lc were deleted by using recombinant DNA techniques (see Materials And Methods). The resulting minigenes containing only the five exon sequences were ligated into an expression vector pMT, expressed in COS1 cells, and reconstituted with 11-cis retinal. The RH1Lc and RH2Lc pigments constructed in this way were shown to have λmax values of 485 ± 3 nm and 478 ± 1 nm, respectively (Fig. 5). The latter λmax of the cone-specific pigment corresponds to the previously described pigment with a λmax of 473 nm (9), suggesting that the coelacanth pigment described by Dartnall (9) might have been sampled from a rare cone photoreceptor cell.
Figure 5.
Absorption spectra of the wild-type (wt) RH1Lc and RH2Lc and mutant pigments evaluated by the dark–light difference spectra.
With the exception of gecko (P467) pigment, most RH1 and RH2 pigments have λmax values of about 500 nm (Fig. 3). Compared with them, the λmax values of RH1Lc and RH2Lc pigments are about 20 nm blue-shifted. The fascinating part of the two λmax values (478 nm and 485 nm) is that they correspond to the narrow range of light around 480 nm in the Comoran coelacanth’s natural photic environment (6). Thus, the RH1Lc and RH2Lc pigments have coevolved to detect two edges of the available light spectra so that the coelacanths can distinguish the entire range of “colors” available to them. Because the coelacanth retina has both rods and cones (7, 8), the finding of a rod-specific RH1Lc pigment and at least one cone-specific pigment is expected. However, it was unexpected to find that the coelacanth uses RH2 pigment instead of SWS1 or SWS2 pigments for its blue vision. It has been demonstrated that color vision is possible with only rods and a single class of cones in cats. By using rods and blue-sensitive cones simultaneously, cats can distinguish wavelengths in the range 440–500 nm at twilight (27). Evidently, the coelacanths use rod-specific RH1Lc pigments and cone-specific RH2Lc pigments to visualize the entire, albeit limited, range of color available to them.
Adaptive Mechanisms of RH1Lc and RH2Lc Pigments.
How did RH1Lc and RH2Lc pigments achieve the blue shifts? It is known that amino acid changes E122Q and A292S in the bovine (P500) pigment shift the λmax value 20 nm (28) and 10 nm (29) toward blue, respectively. Within the RH1 cluster, these two amino acid replacements E122Q and A292S occurred in the coelacanth after its divergence from other organisms (Fig. 3, branch a). Our mutagenesis analysis shows that single mutants Q122E and S292A and a double mutant Q122E/S292A of RH1Lc pigment have λmax values of 495 ± 2 nm, 493 ± 1 nm, and 511 ± 2 nm, respectively (Fig. 5). Thus, E122Q and A292S together can cause a 25 nm blue-shift in the λmax and fully explain the observed λmax of RH1Lc pigment.
The blue-shifted λmax of RH2Lc pigment also is explained by two amino acid replacements, E122Q and M207L. Q122 is shared by the RH2 pigments of coelacanth, gecko, chicken, and American chameleon, and the E122Q replacement occurred before the divergence of coelacanth and tetrapods (Fig. 3, branch b). Figs. 3 and 4 clearly show that amino acid replacements E122Q in RH1Lc and in RH2Lc occurred independently from each other. With the exception of RH2Lc pigment, all RH1 and RH2 pigments have M207, whereas virtually all SWS1 and SWS2 pigments have L207. Thus, L207 is associated with the pigments with blue-shifted λmax values and M207L is suspected to cause a blue-shift in the λmax of RH2Lc pigment. M207L occurred in RH2Lc pigment after its divergence from the rest of RH2 pigments (Fig. 3, branch c). The inferred amino acids of the ancestral pigments support these amino acid replacements at branches b and c in Fig. 3. Mutants Q122E, L207M, and Q122E/L207M of RH2Lc pigment have λmax values of 491 ± 1 nm, 484 ± 1 nm, and 499 ± 1 nm, respectively (Fig. 5). Thus, E122Q and M207L can cause a 21 nm blue-shift in the λmax and fully explain the adaptation of RH2Lc pigment.
As already noted, the gecko RH2 pigment has a λmax value of 467 nm (Fig. 3). By constructing chimeric pigments, the cause of this blue-shift in the λmax was previously localized somewhere between transmembrane domains I and III (30). The present analysis strongly suggests that E122Q in transmembrane domain III (Fig. 2) is a major cause of the blue shift in the λmax of the gecko RH2 pigment.
CONCLUSIONS
The molecular mechanisms of color vision in vertebrates may be elucidated in three steps: (i) cloning and characterization of the opsin genes; (ii) identification of amino acid changes that are potentially important in shifting the λmax of the pigments by using phylogenetic inferences; and (iii) determination of the actual effects of these mutations identified in the second step on the shifts in the λmax of visual pigments by using the in vitro assays (12–14). By so doing, we identified the potentially important amino acid replacements and tested specific hypotheses on the molecular mechanisms of adaptive evolution in the Comoran coelacanth.
The Comoran coelacanth evolved rod-rich retinas to adapt to a depth of about 200 m, where only a narrow range of colors at around 480 nm reaches from the surface. To visualize the entire range of available colors, coelacanths appear to have lost SWS1, SWS2, and LWS/MWS pigments and modified RH1Lc and RH2Lc pigments so that they can detect the two edges of the available light spectra, 478 nm and 485 nm. Our mutagenesis analyses based on this evolutionary hypothesis demonstrate that the coelacanth accomplished the coadaptations of RH1Lc and RH2Lc pigments to its unique habitat by two independent sets of amino acid replacements E122Q/A292S and E122Q/M207L, respectively.
Acknowledgments
We thank R. DeSalle for providing coelacanth tissue and J. Belote, P. Dunham, D. Frank, E. Maine, D. T. Sullivan, and R. Yokoyama for their comments on the manuscript. We also gratefully thank an anonymous reviewer for critically reviewing an earlier draft. This work was supported by National Institutes of Health Grant GM 42379.
ABBREVIATIONS
- RH1Lc
rhodopsin (or pigment) of coelacanth
- RH2Lc
RH1-like opsin (or pigment) of coelacanth
- SWS
short wavelength-sensitive
- MWS
middle wavelength-sensitive
- LWS
long wavelength-sensitive
Footnotes
References
- 1.Cloutier R, Ahlberg P E. In: Interrelationships of Fishes. Stiassny M L, Parenti L R, Johnson G D, editors. San Diego: Academic Press; 1996. pp. 445–479. [Google Scholar]
- 2.Maisey J G. Discovering Fossil Fishes. New York: Henry Holt; 1996. [Google Scholar]
- 3.Thompson K. Living Fossil: The Story of the Coelacanth. London: Hutchinson; 1991. [Google Scholar]
- 4.Schliewen U, Fricke H, Schartl M, Epplen J T, Paabo S. Nature (London) 1993;363:405. [Google Scholar]
- 5.Fricke H, Hissmann K, Schauer J, Plante R. Nature (London) 1995;374:314. [Google Scholar]
- 6.Jerlov N G. Marine Optics. Amsterdam: Elsevier; 1976. [Google Scholar]
- 7.Locket N A. Philos Trans R Soc London B. 1973;266:493–521. doi: 10.1098/rstb.1973.0054. [DOI] [PubMed] [Google Scholar]
- 8.Locket N A. Proc R Soc London Ser B. 1980;208:265–307. doi: 10.1098/rspb.1980.0052. [DOI] [PubMed] [Google Scholar]
- 9.Dartnall H J T. Nature (London) 1972;239:341–342. doi: 10.1038/239341a0. [DOI] [PubMed] [Google Scholar]
- 10.Wald G. Nature (London) 1968;219:800–807. doi: 10.1038/219800a0. [DOI] [PubMed] [Google Scholar]
- 11.Yokoyama S. Mol Biol Evol. 1994;11:32–39. doi: 10.1093/oxfordjournals.molbev.a040090. [DOI] [PubMed] [Google Scholar]
- 12.Yokoyama S. Mol Biol Evol. 1995;12:53–61. doi: 10.1093/oxfordjournals.molbev.a040190. [DOI] [PubMed] [Google Scholar]
- 13.Yokoyama S. Annu Rev Genet. 1997;31:315–336. doi: 10.1146/annurev.genet.31.1.315. [DOI] [PubMed] [Google Scholar]
- 14.Yokoyama S, Radlwimmer F B. Mol Biol Evol. 1998;15:560–567. doi: 10.1093/oxfordjournals.molbev.a025956. [DOI] [PubMed] [Google Scholar]
- 15.Sambrook J, Fritsch E F, Maniatis T. Molecular Cloning: A Laboratory Manual. 2nd Ed. Plainview, NY: Cold Spring Harbor Lab. Press; 1989. [Google Scholar]
- 16.Kawamura S, Yokoyama S. Vision Res. 1998;38:37–44. doi: 10.1016/s0042-6989(97)00160-0. [DOI] [PubMed] [Google Scholar]
- 17.Yokoyama S, Radlwimmer F B, Kawamura S. FEBS Lett. 1998;423:155–158. doi: 10.1016/s0014-5793(98)00086-6. [DOI] [PubMed] [Google Scholar]
- 18.Saitou N, Nei M. Mol Biol Evol. 1987;4:406–425. doi: 10.1093/oxfordjournals.molbev.a040454. [DOI] [PubMed] [Google Scholar]
- 19.Felsenstein J. Evolution. 1985;39:783–791. doi: 10.1111/j.1558-5646.1985.tb00420.x. [DOI] [PubMed] [Google Scholar]
- 20.Yang Z. paml, Phylogenetic Analysis by Maximum Likelihood. London: Univ. College London; 1998. , Version 1.4. [Google Scholar]
- 21.Jones D T, Taylor W R, Thornton J M. Comput Appl Biosci. 1992;8:275–282. doi: 10.1093/bioinformatics/8.3.275. [DOI] [PubMed] [Google Scholar]
- 22.Dayhoff M O, Schwartz R M, Orcutt B C. In: Atlas of Protein Sequences and Structure. Dayhoff M O, editor. Vol. 5. Washington, DC: National Biomedical Research Foundation; 1978. pp. 345–352. [Google Scholar]
- 23.Nathans J, Hogness D S. Cell. 1983;34:807–814. doi: 10.1016/0092-8674(83)90537-8. [DOI] [PubMed] [Google Scholar]
- 24.Nathans J, Thomas D, Hogness D S. Science. 1986;232:193–202. doi: 10.1126/science.2937147. [DOI] [PubMed] [Google Scholar]
- 25.Zardoya R, Meyer A. Genetics. 1997;146:995–1010. doi: 10.1093/genetics/146.3.995. [DOI] [PMC free article] [PubMed] [Google Scholar]
- 26.Hope A J, Partridge J C, Dulai K S, Hunt D M. Proc R Soc London Ser B. 1997;264:155–163. doi: 10.1098/rspb.1997.0023. [DOI] [PMC free article] [PubMed] [Google Scholar]
- 27.Reitner A, Sharpe L T, Zrenner E. Nature (London) 1991;352:798–800. doi: 10.1038/352798a0. [DOI] [PubMed] [Google Scholar]
- 28.Sakmar T P, Franke R R, Khorana H G. Proc Natl Acad Sci USA. 1989;86:8309–8313. doi: 10.1073/pnas.86.21.8309. [DOI] [PMC free article] [PubMed] [Google Scholar]
- 29.Sun H, Macke J P, Nathans J. Proc Natl Acad Sci USA. 1997;94:8860–8865. doi: 10.1073/pnas.94.16.8860. [DOI] [PMC free article] [PubMed] [Google Scholar]
- 30.Kojima D, Oura T, Hisatomi O, Tokunaga F, Fukada Y, Yoshizawa T, Shichida Y. Biochemistry. 1996;35:2625–2629. doi: 10.1021/bi9511548. [DOI] [PubMed] [Google Scholar]
- 31.Kawamura S, Yokoyama S. J Mol Evol. 1995;40:594–600. doi: 10.1007/BF00160506. [DOI] [PubMed] [Google Scholar]
- 32.Kawamura S, Yokoyama S. Vision Res. 1996;36:2797–2804. doi: 10.1016/0042-6989(96)00034-x. [DOI] [PubMed] [Google Scholar]


