Abstract
In adult protease inhibitor (PI)-experienced patients, a lopinavir (LPV) phenotypic inhibitory quotient (PIQ) of >15 has been associated with a higher likelihood of viral suppression. The aims of this study were to develop a population pharmacokinetic (PK) model of LPV in children and to estimate the probability of achieving a PIQ of >15. HIV-infected, PI-experienced children receiving LPV were intensively sampled for 12 h to measure plasma LPV. The data were fitted to candidate PK models (using MM-USCPACK software), and the final model was used to simulate 1,000 children to determine the probability of achieving an LPV PIQ of >15. In 50 patients (4 to 18 years old), the median LPV plasma 12-hour-postdose concentration was 5.9 mg/liter (range, 0.03 to 16.2 mg/liter) lower than that reported in adults. After a delay, LPV was absorbed linearly into a central compartment whose size was dependent on the weight and age of the patient. Elimination was dependent on weight. The regression line of observed versus predicted LPV had an R2 of 0.99 and a slope of 1.0. Visual predictive checks against all available measured concentrations showed good predictive ability of the model. The probability of achieving an LPV PIQ of >15 was >90% for wild-type virus but <10% for even moderately resistant virus. The currently recommended dose of LPV/ritonavir appears to be adequate for children infected with wild-type virus but is unlikely to provide adequate inhibitory concentrations for even moderately resistant human immunodeficiency virus (HIV). PI-experienced HIV-infected children will likely benefit from longitudinal, repeated LPV measurement in plasma to ensure that drug exposure is most often near the maximal end of the observed safe range.
Lopinavir/ritonavir (LPV/RTV) (Kaletra) is the first and only coformulated RTV-boosted protease inhibitor (PI) approved for use in children. The recommended doses for children who weigh more than 15 kg are 10 mg/kg of body weight or 230 mg/m2 (body surface area) twice daily, with a maximum of 400 mg per dose unless it is combined with drugs affecting cytochrome (CYP) P450 metabolism, which require LPV dose adjustment (4, 28). Introduced as a salvage agent (22), LPV/RTV has become one of the preferred PI choices for first-line regimens in children >6 months of age in the countries with access to the drug.
Despite evidence for good antiviral efficacy among children in a clinical trial setting (16, 17, 23), the standard dose may not be adequate for every child. Noncompartmental analysis has shown that the average LPV plasma 12-hour-postdose concentration (Ctrough) in children given the currently recommended pediatric dose of LPV is 67% lower than in adults (24). Recently, Jullien et al. published a population pharmacokinetics (PK) model of LPV in children aged 0 to 18 years (15). The model was based on a retrospective analysis of LPV plasma measurements in 157 children, with a median of 3 samples (range, 1 to 14) per patient, obtained for monitoring purposes after self-reported LPV intake. In that model, clearance (CL) and volume were dependent on body weight, and there was an additional increase in CL in boys after the age of 12 relative to girls. The study suggested that a distinct possibility of LPV underdosing exists in young infants and adolescent males.
PK measures of LPV exposure, such as area under the time-concentration curve (AUC) or Ctrough, are most relevant to clinical practice in the context of an estimated concentration-response relationship. Different LPV Ctrough targets have been proposed for PI-naïve patients (1 mg/liter) (20) and for PI-experienced patients (3 to 5.7 mg/liter) (5, 6, 8, 27). A more comprehensive target, the phenotypic inhibitory quotient (PIQ), incorporates viral drug susceptibility, which is measured as the concentration of drug required to achieve 50% in vitro inhibition of replication of the virus (IC50) relative to the replication of human immunodeficiency virus (HIV) in drug-free medium. The PIQ is the ratio of a patient's Ctrough to the IC50 of the dominant viral strain. For LPV, a PIQ target of 15 has been associated with more than 90% chance of achieving <400 HIV copies/ml when combined with active background antiretroviral therapy (ART) comprising efavirenz (13) or two nucleoside reverse transcriptase inhibitors (21).
We conducted a prospective study to develop a population PK model of LPV in a large cohort of HIV-infected children, with intense PK sampling after observed LPV intake. Additionally, we used Monte Carlo simulation to estimate the proportion of all children who would fail to achieve the LPV PIQ target of 15 when given the currently recommended dose of LPV.
MATERIALS AND METHODS
Patients.
The participants were children with HIV type 1 infection who were receiving care at the large metropolitan pediatric HIV program at Children's National Medical Center, Washington, DC. The research protocol, parental consent, and assent documents (for children older than 7 years of age) were approved by the institutional review board.
All subjects in this study were on uninterrupted, twice-daily doses of LPV/RTV-based ART for at least 4 weeks prior to study entry. Blood samples for LPV measurement were obtained during a 12-hour admission to the Pediatric Clinical Research Center. The subjects were administered their standard prescribed LPV/RTV dose under direct observation with a standard light snack. Plasma samples were obtained before and 0.5, 1, 2, 4, 8, and 12 h after observed intake of LPV/RTV.
Tandem mass spectrometry analysis.
For each measurement of the plasma LPV concentration, 2 ml of venous blood was obtained. The blood was collected in a heparin tube and separated by centrifugation at 4,000 rpm for 10 min. The plasma was stored at −70°C pending analysis. The plasma samples were incubated for 30 min at 56°C to deactivate the HIV particles. Heating of the samples has been proven not to produce degradation of LPV (12, 26).
The LPV plasma concentrations were determined by a tandem-mass spectrometric method using the Applied Biosystems/Sciex API-2000 (12, 26). Within-run error was below 7%, and between-day error was below 10% for all analytes at the tested concentrations. The lower limit of quantification was 0.1 mg/liter. The laboratory at Children's National Medical Center that performed the LPV assays is an accredited member of the International Quality Control Program for Therapeutic Drug Monitoring in HIV infection (University Medical Center, Nijmegen, The Netherlands) (1, 11).
PK modeling and simulation.
MM-USCPACK, a parametric/nonparametric population-modeling software collection (available by license through the University of Southern California at http://www.lapk.org) was used to fit candidate PK models to the time-concentration data for LPV (14). The models were evaluated on the basis of maximization of the log likelihood, visual inspection of observed versus predicted plots, visual predictive checks, and parsimony.
To minimize model bias from uncertainty in dose times (9, 19, 25), for each patient, the initial amount of LPV in the PK dosing compartment was set equal to zero under the reasonable assumption that the previous LPV dose approximately 12 h before had completed its passage through the gut. In contrast, the initial amount in the central PK compartment was set equal to the measured LPV trough plasma concentration just prior to the observed dose multiplied by the estimated volume of the central compartment, which was updated after each iteration. Beyond these initial conditions, the only drug input to the model was the observed dose. By restricting model inputs to observed or measured data, this technique eliminated misspecification associated with variable adherence prior to the PK sampling and potentially false assumptions of steady state.
In accordance with the allometric size scaling of PK parameters in children proposed by Anderson et al. (2), among others, the model was initially parameterized with the volume of distribution (V) proportional to weight and CL proportional to weight0.75. However, V and CL were strongly correlated (R = 0.76; P < 0.0001), leading to highly variable parameter estimates; therefore, the model was reparameterized in terms of V being proportional to weight and elimination (kel) being proportional to weight−0.25, which were independent of each other (R = 0.10; P = 0.47). By the relationship CL = kel·V, the net allometric power scaling on weight was the same in the CL-based and kel-based models. Effects of age and sex were added to the allometric model and retained if they improved the 2·log likelihood by at least 4 (P < 0.05; chi-square with 1 degree of freedom) and resulted in some qualitative improvement in either the observed versus predicted plots or the visual predictive check.
Data for the modeling were weighted by the reciprocal of the LPV assay variance. This error model was obtained from the MM-USCPACK software, which fits up to a third-order polynomial (C0 + C1·[drug] + C2·[drug]2 + C3·[drug]3) to the entire data set. The initial values for the polynomial coefficients were set at 0, 0.1, 0, and 0 to reflect the standard deviation at each of the standard concentrations in the assay validation set. The final assay error coefficients were 0.385, 0.013, 0, and 0. A multiplicative scalar, gamma, on the polynomial was iteratively fitted to capture additional random error and approximate homoscedasticity in the residuals of predicted versus observed concentrations; gamma on the final run (cycle 1,290) was 1.78.
In order to compare the results of the present study with published LPV PK parameter values, CL and half-life (t1/2) were calculated using the following formulae: CL = dose/AUC and t1/2 = ln(2)/kel, where AUC is the AUC from dose time to infinity postdose as estimated by MM-USCPACK from model parameters, and kel is the LPV elimination rate constant estimated by MM-USCPACK. As a numerical check, CL was also calculated using the formula CL = kel·V.
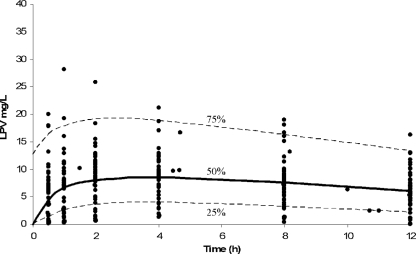
A visual predictive check was made to validate a model's ability to provide realistic predictions. Full-parameter mean and covariance data from the model, including weight, were passed to the simulation subroutine of the MM-USCPACK software so that LPV could be administered on the standard basis of body surface area (BSA). The BSA was calculated from weight (kg), which was also a simulated parameter, using the simplified formula BSA (m2) = 0.111·weight0.65 (7). BSA calculated using this formula in the real population was nearly perfectly correlated (R = 0.995; P < 0.0001) with BSA calculated with the more familiar height- and weight-based Mosteller formula (18). The median dose in the study population was used for the simulation, and parameters were log transformed. One thousand patients were simulated by Monte Carlo sampling, and LPV concentrations, which were calculated at the same sampling times as for the original (real) population, were compared to the measured, true LPV concentrations. The 25th, 50th, and 75th percentile concentrations of LPV from the 1,000 simulated patients were plotted versus time. Superimposed upon these plots were the real concentrations of each compound measured in the patients. The visual predictive check was acceptable if the distribution of the simulated population was similar to that of the real population.
Using the final model, a second simulation was performed, identical to the first, except that the LPV dose used was the recommended dose of 230 mg/m2. This simulated population was used to define the increase in the LPV IC50 that would result in 50% of children falling below a PIQ of >15. Furthermore, since a target PIQ of 15 was simply derived as the observed PIQ that was associated with 100% virologic response (13), a continuous model relating the PIQ to percent “clinical activity” of lopinavir could be made so that percent activity was equal to  , where PIQ is the PIQ calculated as before; Emin is the virologic response rate at minimal LPV PIQ (i.e., the response due to other drugs in the regimen); H is the “Hill constant,” which determines the shape of the sigmoid curve when plotted on semilog paper; and PIQ50 is the PIQ that results in a 50% loss of LPV activity, i.e., (1 − Emin)/2. Emin, H, and PIQ50 were derived from the data of Hsu et al. as 0.66, 1.7, and 8.7, respectively (13).
RESULTS
Fifty-two full 12-hour PK studies were conducted with 50 PI-experienced children and adolescents on ART with LPV/RTV as a single PI, with 2 participants repeating the PK study after LPV dose adjustments made through the study protocol. The majority of the children were African-American (78%), the median age was 11.0 years (range, 5.3 to 17.5 years), and equal numbers of boys and girls were enrolled. The median LPV dose was 275 mg/m2 (interquartile range, 246 to 287 mg/m2); 31 children were dosed with 200 mg LPV/50 mg RTV Kaletra capsules and the remainder with liquid LPV/RTV (80 mg LPV/20 mg RTV/ml). At the time of the PK studies, the new tablet formulation of LPV/RTV was not available.
PK modeling.
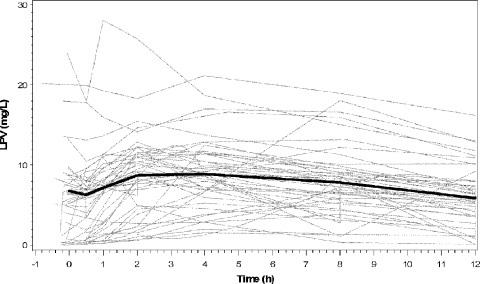
From 52 study visits, there were 359 possible PK samples, 6 (1.7%) of which were missing and 14 (3.9%) of which were reported as below the assay's limits of quantification. Treating the latter simply as missing data was unlikely to significantly bias the results (3). The median plasma LPV postdose Ctrough was 5.9 mg/liter (range, 0.03 to 16.2 mg/liter); the median peak was 10.3 mg/liter (range, 0.6 to 28.8 mg/liter), occurring a median of 3.1 h (range, 0 to 12 h) after the dose. The wide ranges in these values are reinforced by the variability in a plot of the individual LPV time-concentration curves, shown in Fig. 1.
FIG. 1.
Individual observed LPV time-concentration curves for each of the 52 patient visits (gray lines). The median observed time-concentration curve for the entire population is superimposed (black line).
The final model consisted of linear absorption, after a delay, into a single compartment. The volume was dependent on weight and inversely dependent on age, so that a 17-year-old adolescent would have an 80% smaller V per kilogram of body weight than a 4 year-old child. Elimination was inversely dependent on weight0.25. The net effect of the parameter dependence on age and weight implied a higher LPV Ctrough on average in older children. Indeed, age was moderately correlated with the LPV Ctrough in the study population (R = 0.21; P = 0.16) by the same magnitude as in the simulated population (R = 0.21; P < 0.0001), with the latter achieving statistical significance due to the large number of samples. Sex was not significantly related to any PK parameter estimate. The median and interquartile ranges of the individual Bayesian posterior parameter estimates, using the population parameter estimates as Bayesian priors, are reported in Table 1. The distributions of estimates for CL were similar whether calculated from the dose and AUC or kel and V, and the paired values were tightly correlated (R = 1.0; P < 0.0001).
TABLE 1.
Estimated and calculated PK parameters in the final PK model
| Parametera | Median (interquartile range) |
|---|---|
| Estimated | |
| tlag (h) | 0.37 (0.12-0.86) |
| ka (h−1) | 0.64 (0.21-1.71) |
| V (liters) = θ1·wt/ageθ2 | 25.15 (14.00-32.88) |
| liters/kg | 0.69 (0.45-0.98) |
| θ1 | 15.04 (10.30-17.79) |
| θ2 | 11.44 (3.69-90.66) |
| kel (h−1) = θ3/wt0.25 | 0.09 (0.07-0.15) |
| θ3 | 0.22 (0.18-0.37) |
| AUC0-12 (mg*h/liter) | 96.09 (62.73-114.30) |
| AUC∞ (mg·h/liter) | 190.40 (123.50-321.20) |
| Calculated | |
| CL (liters/h) = dose/AUC | 1.79 (1.00-2.57) |
| (liters/kg0.75) | 0.11 (0.07-0.20) |
| CL (liters/h) = kel·V | 2.17 (1.39-3.18) |
| liters/kg0.75 | 0.14 (0.09-0.24) |
| t1/2 (h) = ln(2)/kel | 7.69 (4.63-10.44) |
tlag, lag time; ka, rate constant of absorption.
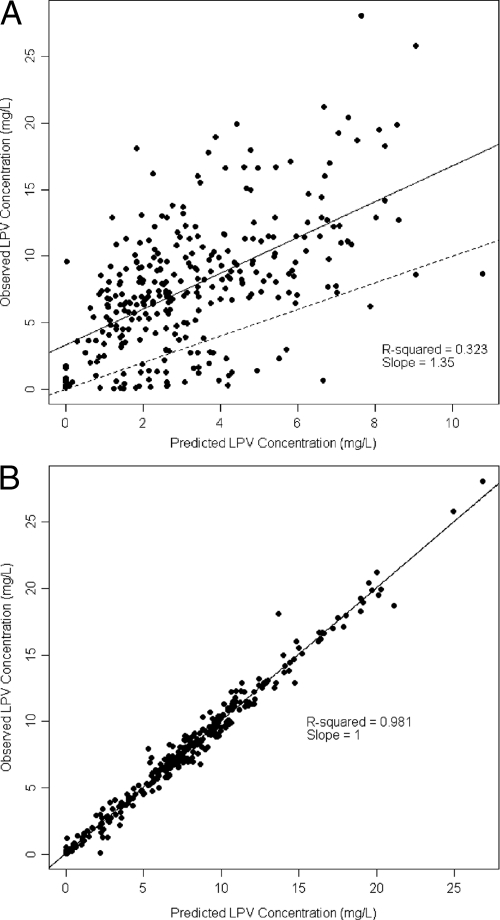
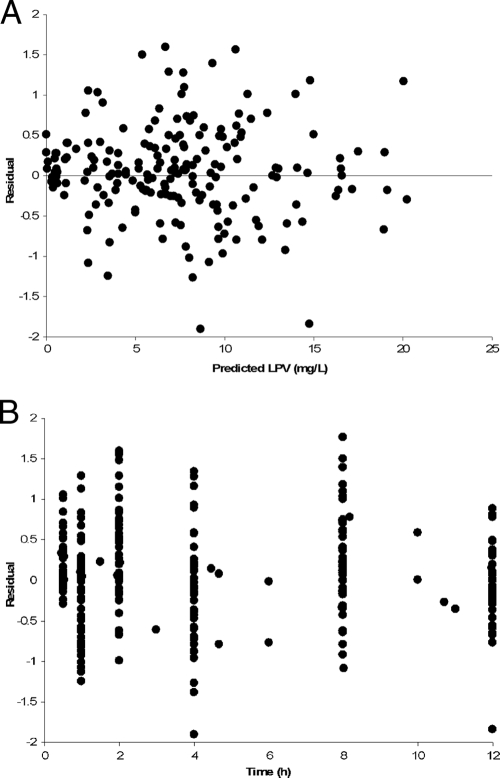
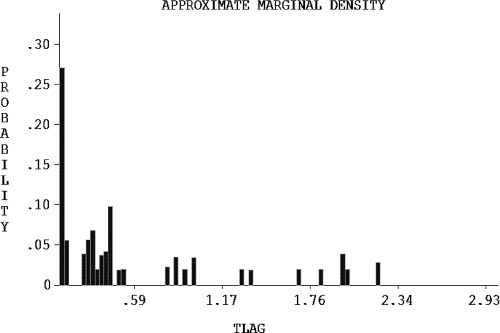
The quality of the fit for the model population, as measured by linear regression of observed versus predicted LPV concentrations, was poor for the model-based predictions (Fig. 2A) but excellent for the Bayesian posterior predictions (Fig. 2B), reinforcing the high degree of interindividual LPV PK variability. Plots of the residuals between observed and predicted concentrations with respect to either the Bayesian predicted concentration or time were homoscedastic and centered on zero (Fig. 3). The visual predictive check showed that the model described the population well (Fig. 4), despite the fact that the two Ctrough values differed by more than 50% in half of the children (range, 5% to 9,000%), indicating that many were not at steady state. Finally, the advantage of the nonparametric approach is obvious in Fig. 5, which shows that, for example, lag time is clearly not normally distributed and that, although the bulk of the children had delays in absorption of less than 30 min, a subgroup of 15 children had delays of up to approximately 2 h. This can be seen by careful inspection of Fig. 1 for the trajectories that peak much later than the majority. The LPV/RTV formulation was significantly associated with absorption lag time: children dosed with LPV/RTV liquid had a twofold-shorter median lag time than those dosed with capsules (P = 0.005).
FIG. 2.
Linear regression of individual observed versus predicted LPV concentrations. Predictions using mean model parameter values (A) and using the means of the individual Bayesian posterior parameter distributions (B) are shown. The solid line is the fitted regression line. The dashed line is the unity line, which is fully superimposed on the regression line in panel B.
FIG. 3.
Model residual errors with respect to predicted LPV (A) and time (B).
FIG. 4.
Visual predictive check of concentration percentiles from model-simulated data (lines) superimposed on measured patient concentrations from the entire population (dots).
FIG. 5.
Distribution of lag times in the population.
Probability of achieving PIQ targets.
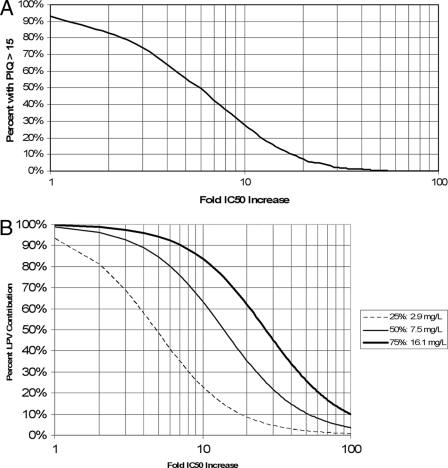
As shown in Fig. 6A, for wild-type virus, >90% of children are predicted to achieve an LPV IQ of >15. However, at the Phenosense (Monogram Biosciences, Inc., CA) or Vircotype (Virco Labs, Inc., NJ) cutoffs between fully sensitive and intermediate virus (ninefold and sixfold increases in IC50, respectively), only 32% or 48% of children are likely to achieve a PIQ of >15. If resistance increases to 20-fold, well within the “partially sensitive” range, which extends up to 55- and 51-fold, respectively, fewer than 10% of children are likely to achieve a PIQ of >15, given the currently recommended LPV dose.
FIG. 6.
Relationship between LPV concentrations and antiviral effect. (A) Percentages of children who will achieve a steady-state PIQ target of at least 15 when given the standard dose of 230 mg/m2 LPV/RTV twice daily for a given viral IC50. (B) Clinical activity of LPV plotted against increasingly resistant strains for the 25th, 50th, and 75th percentiles of LPV Ctrough concentrations in children given the standard dose.
Considering the LPV contribution to virologic effect as a continuous function of the PIQ, it can be seen in Fig. 6B that the standard dose of LPV will maintain >90% LPV activity against wild-type virus in >75% of children. Children whose LPV dose is sufficient to ensure a Ctrough of 16.1 mg/liter (the 75th percentile for the population) will maintain at least 50% LPV effect until resistance increases to >27 times that of the wild type; in contrast, children whose Ctrough is only 2.9 mg/liter (the 25th percentile for the population) will lose 94% of their LPV effect at this same level of resistance. Alternatively, children whose LPV Ctrough is at the 25th percentile will fall below a PIQ of 15 at a 2.8-fold increase in the IC50 compared to those at the 75th percentile, who will not drop below a PIQ of 15 until their viral IC50 is increased 15.4-fold relative to the wild type.
DISCUSSION
In this study, a model of LPV disposition in children and adolescents 4 through 18 years of age was developed and validated by a visual predictive check of the distribution of LPV concentrations in 1,000 model-simulated patients compared with the distribution of LPV concentrations in the study population. In the final model, LPV was rapidly absorbed after an initial formulation-dependent delay, with an apparent V that increased nonlinearly as a function of weight over age. Overall, the drug CL varied according to weight0.75, in accordance with the allometric scaling principles in children suggested by Anderson et al. (2), among others.
Because of high correlation between V and CL, the model was parameterized in terms of fractional elimination (kel) that declined with increasing weight. The CL-V correlation indicates that in the model clearance of LPV was driven primarily by the apparent V, which raises the possibility that LPV bioavailability may have been variable. Due to the lack of an intravenous formulation, the absolute bioavailability of LPV has not been established. Close inspection of Fig. 1 reinforces the fact that most of the LPV PK variability is in absorption and bioavailability, since after an individual trajectory peaks, it generally declines consistently thereafter. In other words, between-individual variability is larger than within-individual variability, which enables the close fit shown in Fig. 2B versus that in Fig. 2A.
In adults given the standard dose of 400/100 mg LPV/RTV twice daily, the Kaletra package insert reports a steady-state LPV AUC of 92.6 mg·h/liter, a Cmax of 9.8 mg/liter occurring 4 h after a dose, and a Ctrough of 7.1 mg/liter. For children given 230/57.5 mg/m2 LPV/RTV twice daily, the package insert reports a steady-state LPV AUC of 72.6 mg·h/liter, a Cmax of 8.2 mg/liter occurring 4 h after a dose, and a Ctrough of 3.4 mg/liter. The children in our study received a median LPV dose of 275 mg/m2, which is 20% higher than the recommended dose. The median LPV AUC, Cmax, and Ctrough were correspondingly higher than those reported for children in the package insert and were similar to adult values, with the exception of the Ctrough, which was slightly lower than that of adults.
With large interpatient variability in LPV PK, it is very important to estimate the chance of a child on ART having suboptimal LPV exposure. Other studies have suggested that the currently recommended dose of LPV/RTV might result in suboptimal exposure in HIV-infected children (4, 10, 24). Based on our PK model and the LPV pharmacodynamic models by Hsu et al. and Podzamczer et al. (13, 21), we have shown that the majority of children are unlikely to achieve therapeutic plasma LPV concentrations against virus that is moderately resistant to LPV, at degrees far below the clinical cutoffs suggested by current phenotypic resistance testing. Furthermore, patients with fewer than two active background antiretroviral agents would have even higher IQ targets (13, 21) and would require correspondingly higher doses of LPV. It is this population of PI-experienced patients who would most likely derive direct benefit from measurement of plasma LPV concentrations and dose adjustment if necessary to avoid excessive dependence on the remaining drugs in the therapeutic regimen. Separate analysis in this cohort of HIV-infected children will compare the measured relationships of individual LPV PK and phenotypic and genotypic IQs to virologic responses.
Conclusion.
In this study, a model of LPV disposition in pediatric patients >4 years of age was developed and validated by a visual predictive check of the distribution of LPV concentrations in 1,000 model-simulated patients compared with the distribution of LPV concentrations in the study population. Based on this PK population model, the currently recommended dose of LPV/RTV appears to be adequate for children infected with wild-type virus but is unlikely to provide adequate inhibitory concentrations for even moderately resistant HIV. PI-experienced HIV-infected children would likely benefit from longitudinal, repeated LPV drug measurement in plasma in combination with resistance evaluation to ensure that LPV dosing is sufficient to maximize the contribution of LPV to virologic control.
Acknowledgments
We thank the children who participated in this study, their families and caregivers, the clinic staff, and laboratory and Pediatric Clinical Research Center personnel for their dedication and support.
This work was supported by Department of Health and Human Services, NIH, PHS grants NIBIB R01 EB005803-01A1 (M.N.N. and N.R.) and NIAID K23 AI076106-01 (M.N.N.), MO1-RR-020359 and NICHD 1U10 HD45993 (J.V.D.A.), and NCRR 1K12 RR017613 (N.R.).
Footnotes
Published ahead of print on 2 March 2009.
REFERENCES
- 1.Aarnoutse, R. E., C. P. W. G. M. Verweij-van Wissen, E. W. J. van Ewijk-Beneken Kolmer, E. W. Wuis, P. P. Koopmans, Y. A. Hekster, and D. M. Burger. 2002. International interlaboratory quality control program for measurement of antiretroviral drugs in plasma. Antimicrob. Agents Chemother. 46:884-886. [DOI] [PMC free article] [PubMed] [Google Scholar]
- 2.Anderson, B., K. Allegaert, and N. Holford. 2006. Population clinical pharmacology of children: modelling covariate effects. Eur. J. Pediatr. 165:819-829. [DOI] [PubMed] [Google Scholar]
- 3.Beal, S. 2001. Ways to fit a PK model with some data below the quantification limit. J. Pharmacokinet. Pharmacodyn. 28:481-504. [DOI] [PubMed] [Google Scholar]
- 4.Bergshoeff, A., P. Fraaij, J. Ndagijimana, G. Verweel, N. Hartwig, T. Niehues, G. R. De, and D. Burger. 2005. Increased dose of lopinavir/ritonavir compensates for efavirenz-induced drug-drug interaction in HIV-1-infected children. J. Acquir. Immune. Defic. Syndr. 39:63-68. [DOI] [PubMed] [Google Scholar]
- 5.Boffito, M., I. Arnaudo, R. Raiteri, S. Bonora, A. Sinicco, A. Di Garbo, H. E. Reynolds, P. G. Hoggard, D. J. Back, and G. Di Perri. 2002. Clinical use of lopinavir/ritonavir in a salvage therapy setting: pharmacokinetics and pharmacodynamics. AIDS 16:2081-2083. [DOI] [PubMed] [Google Scholar]
- 6.Boffito, M., P. G. Hoggard, D. J. Back, S. Bonora, A. Maiello, A. Lucchini, and G. Di Perri. 2002. Lopinavir measurement in pleural effusion in a human immunodeficiency virus type 1-infected patient with Kaposi's sarcoma. Antimicrob. Agents Chemother. 46:3684-3685. [DOI] [PMC free article] [PubMed] [Google Scholar]
- 7.Boxenbaum, H., and C. DiLea. 1995. First-time-in-human dose selection: allometric thoughts and perspectives. J. Clin. Pharmacol. 35:957-966. [DOI] [PubMed] [Google Scholar]
- 8.Breilh, D., I. Pellegrin, A. Rouzes, K. Berthoin, F. Xuereb, H. Budzinski, M. Munck, H. Fleury, M. Saux, and J. Pellegrin. 2004. Virological, intracellular and plasma pharmacological parameters predicting response to lopinavir/ritonavir (KALEPHAR study). AIDS 18:1305-1310. [DOI] [PubMed] [Google Scholar]
- 9.Charpiat, B., V. Breant, C. Pivot-Dumarest, P. Maire, and R. Jelliffe. 1994. Prediction of future serum concentrations with Bayesian fitted pharmacokinetic models: results with data collected by nurses versus trained pharmacy residents. Ther. Drug Monit. 16:166-173. [DOI] [PubMed] [Google Scholar]
- 10.Crommentuyn, K., B. Kappelhoff, J. Mulder, A. Mairuhu, E. van Gorp, P. Meenhorst, A. Huitema, and J. Beijnen. 2005. Population pharmacokinetics of lopinavir in combination with ritonavir in HIV-1-infected patients. Br. J. Clin. Pharmacol. 60:378-389. [DOI] [PMC free article] [PubMed] [Google Scholar]
- 11.Droste, J. A. H., P. P. Koopmans, Y. A. Hekster, and D. M. Burger. 2005. TDM: therapeutic drug measuring or therapeutic drug monitoring? Ther. Drug Monit. 27:412-416. [DOI] [PubMed] [Google Scholar]
- 12.Ghoshal, A. K., and S. J. Soldin. 2003. Improved method for concurrent quantification of antiretrovirals by liquid chromatography-tandem mass spectrometry. Ther. Drug Monit. 25:541-543. [DOI] [PubMed] [Google Scholar]
- 13.Hsu, A., J. Isaacson, S. Brun, B. Bernstein, W. Lam, R. Bertz, C. Foit, K. Rynkiewicz, B. Richards, M. King, R. Rode, D. Kempf, G. Granneman, and E. Sun. 2003. Pharmacokinetic-pharmacodynamic analysis of lopinavir-ritonavir in combination with efavirenz and two nucleoside reverse transcriptase inhibitors in extensively pretreated human immunodeficiency virus-infected patients. Antimicrob. Agents Chemother. 47:350-359. [DOI] [PMC free article] [PubMed] [Google Scholar]
- 14.Jelliffe, R. 1991. The USC*PACK PC programs for population pharmacokinetic modeling, modeling of large kinetic/dynamic systems, and adaptive control of drug dosage regimens, p. 922-924. In Proceedings of the Annual Symposium on Computer Applications in Medical Care. [PMC free article] [PubMed]
- 15.Jullien, V., S. Urien, D. Hirt, C. Delaugerre, E. Rey, J. P. Teglas, P. Vaz, C. Rouzioux, M. L. Chaix, E. Macassa, G. Firtion, G. Pons, S. Blanche, and J. M. Treluyer. 2006. Population analysis of weight-, age-, and sex-related differences in the pharmacokinetics of lopinavir in children from birth to 18 years. Antimicrob. Agents Chemother. 50:3548-3555. [DOI] [PMC free article] [PubMed] [Google Scholar]
- 16.Kline, M. W., S. Rugina, M. Ilie, R. F. Matusa, A. Schweitzer, N. R. Calles, and H. L. Schwarzwald. 2007. Long-term follow-up of 414 HIV-infected Romanian children and adolescents receiving lopinavir/ritonavir-containing highly active antiretroviral therapy. Pediatrics 119:e1116-e1120. [DOI] [PubMed] [Google Scholar]
- 17.Larrú, B., S. Resino, J. M. Bellón, M. I. de José, C. Fortuny, M. L. Navarro, M. D. Gurbindo, J. T. Ramos, P. Soler Palacín, J. A. Léon, M. Asensi, M. J. Mellado, and M. A. Muñoz-Fernández. 2008. Long-term response to highly active antiretroviral therapy with lopinavir/ritonavir in pre-treated vertically HIV-infected children. J. Antimicrob. Chemother. 61:183-190. [DOI] [PubMed] [Google Scholar]
- 18.Mosteller, R. 1987. Simplified calculation of body-surface area. N. Engl. J. Med. 317:1098. [DOI] [PubMed] [Google Scholar]
- 19.Mu, S., and T. M. Ludden. 2003. Estimation of population pharmacokinetic parameters in the presence of non-compliance. J. Pharmacokinet. Pharmacodyn. 30:53-81. [DOI] [PubMed] [Google Scholar]
- 20.Panel on Antiretroviral Guidelines for Adults and Adolescents. November 3, 2008. Guidelines for the use of antiretroviral agents in HIV-1-infected adults and adolescents, p. 1-139. Department of Health and Human Services, Washington, DC. http://www.aidsinfo.nih.gov/ContentFiles/AdultandAdolescentGL.pdf.
- 21.Podzamczer, D., M. S. King, C. E. Klein, C. Flexner, C. Katlama, D. V. Havlir, S. L. Letendre, J. J. Eron, S. C. Brun, and B. Bernstein. High-dose lopinavir/ritonavir in highly treatment-experienced HIV-1 patients: efficacy, safety, and predictors of response. HIV Clin. Trials 8:193-204. [DOI] [PubMed]
- 22.Ramos, J. T., M. I. De José, J. Dueñas, C. Fortuny, R. González-Montero, M. J. Mellado, A. Mur, M. Navarro, C. Otero, I. Pocheville, M. A. Muñoz-Fernández, and E. Cabrero. 2005. Safety and antiviral response at 12 months of lopinavir/ritonavir therapy in human immunodeficiency virus-1-infected children experienced with three classes of antiretrovirals. Pediatr. Infect. Dis. J. 24:867-873. [DOI] [PubMed] [Google Scholar]
- 23.Resino, S., J. M. Bellón, and M. A. Muñoz-Fernández. 2006. Antiretroviral activity and safety of lopinavir/ritonavir in protease inhibitor-experienced HIV-infected children with severe-moderate immunodeficiency. J. Antimicrob. Chemother. 57:579-582. [DOI] [PubMed] [Google Scholar]
- 24.Saez-Llorens, X., A. Violari, C. Deetz, R. Rode, P. Gomez, E. Handelsman, S. Pelton, O. Ramilo, P. Cahn, E. Chadwick, U. Allen, S. Arpadi, M. Castrejon, R. Heuser, D. Kempf, R. Bertz, A. Hsu, B. Bernstein, C. Renz, and E. Sun. 2003. Forty-eight-week evaluation of lopinavir/ritonavir, a new protease inhibitor, in human immunodeficiency virus-infected children. Pediatr. Infect. Dis. J. 22:216-224. [DOI] [PubMed] [Google Scholar]
- 25.Sun, H., E. Ette, and T. Ludden. 1996. On the recording of sample times and parameter estimation from repeated measures pharmacokinetic data. J. Pharmacokinet. Biopharm. 24:637-650. [DOI] [PubMed] [Google Scholar]
- 26.Volosov, A., C. Alexander, L. Ting, and S. J. Soldin. 2002. Simple rapid method for quantification of antiretrovirals by liquid chromatography-tandem mass-spectrometry. Clin. Biochem. 35:99-103. [DOI] [PubMed] [Google Scholar]
- 27.Wateba, M. I., E. Billaud, E. Dailly, P. Jolliet, and F. Raffi. 2006. Low initial trough plasma concentrations of lopinavir are associated with an impairment of virological response in an unselected cohort of HIV-1-infected patients. HIV Med. 7:197-199. [DOI] [PubMed] [Google Scholar]
- 28.Working Group on Antiretroviral Therapy and Medical Management of HIV-Infected Children. 29 July 2008. Guidelines for the use of antiretroviral agents in pediatric HIV infection, p.1-134. http://aidsinfo.nih.gov/ContentFiles/PediatricGuidelines.pdf.


