

Abstract
Escherichia coli O157:H7 has caused serious outbreaks of food-borne illness via transmission in a variety of food vehicles, including unpasteurized apple juice, dried salami, and spinach. To understand how this pathogen responds to the multiple stresses of the food environment, we compared global transcription patterns before and after exposure to model apple juice. Transcriptomes of mid-exponential- and stationary-phase cells were evaluated after 10 min in model apple juice (pH 3.5) using microarrays probing 4,886 open reading frames. A total of 331 genes were significantly induced upon exposure of cells to model apple juice, including genes involved in the acid, osmotic, and oxidative stress responses as well as the envelope stress response. Acid and osmotic stress response genes, including asr, osmC, osmB, and osmY, were significantly induced in response to model apple juice. Multiple envelope stress responses were activated as evidenced by increased expression of CpxR and Rcs phosphorelay-controlled genes. Genes controlled by CpxR (cpxP, degP, and htpX) were significantly induced 2- to 15-fold upon exposure to apple juice. Inactivation of CpxRA resulted in a significant decrease in survival of O157:H7 in model apple juice compared to the isogenic parent strain. Of the 331 genes induced in model apple juice, 104 are O157-specific genes, including those encoding type three secretion effectors (espJ, espB, espM2, espL3, and espZ). Elucidating the response of O157:H7 to acidic foods provides insight into how this pathogen is able to survive in food matrices and how exposure to foods influences subsequent transmission and virulence.
Enterohemorrhagic Escherichia coli (EHEC), a food- and waterborne pathogen of zoonotic origin, is an important cause of acute gastroenteritis in humans. O157:H7 is the predominant serotype of EHEC in the United States (54), and contaminated food is the most frequent cause of EHEC outbreaks (62). E. coli O157:H7 outbreaks have occurred as a consequence of contamination of ground beef (14, 17, 70), lettuce (36), alfalfa sprouts (11), raw milk (13), apple cider (8, 37), apple juice (19), dry cured salami (15), and spinach (16). O157:H7 strains are capable of survival and growth in a number of additional foods, including refrigerated fruit pulps (51), sour cream and buttermilk (29), and mayonnaise (85, 92). While it is evident that E. coli O157:H7 can effectively persist in a variety of food products posing multiple environmental stresses, the mechanisms contributing to persistence under these conditions are poorly understood.
Methods commonly used to preserve foods include storage at low temperature, reduced water activity, and addition of organic acids, all of which confer stress on bacterial contaminants. The physiological responses of E. coli to many of these conditions, when experienced as a single stress, have been described (32, 72, 89). E. coli combats increased osmotic pressure through the synthesis of trehalose (12) and accumulation of compatible solutes, including betaine, proline, and carnitine when available from the external environment (21, 84). E. coli responds to acid stress by decreasing membrane permeability (41) and altering membrane fatty acid profiles (90), as well as by induction of amino acid decarboxylase systems that act to maintain the internal pH (50, 69). E. coli reacts to heat stress by increasing synthesis of chaperones and proteases involved in protein folding and degradation. These physiological responses are typically regulated on the molecular level by a number of distinct yet overlapping regulons controlled by alternative sigma factors and two-component response regulators (89). The general stress response modulated by the sigma factor RpoS contributes to E. coli survival under many adverse conditions, including acid stress (3), H2O2 stress (48), high pressure (71), and osmotic stress (35), as well as to survival of E. coli O157:H7 in apple cider (61) and dry fermented sausage (18).
Activation of the general stress response occurs when cells enter stationary phase as well as under adverse environmental conditions. As the general stress response confers resistance to a number of potential stressors, stationary-phase cells are commonly found to be more stress resistant than cells undergoing exponential growth. Late-stationary-phase cells have greater heat resistance than log-phase cells (44). The ability to persist under low-pH conditions is dependent on growth phase, as stationary-phase cells are more resistant than log-phase cells (6). Stationary-phase cells are also more resistant to osmotic stress (39) and H2O2 (40). In a model apple juice (MAJ) medium at pH 3.7, stationary-phase cells of O157:H7 had superior survival compared to exponential-phase cells (64). As E. coli cells present in the external environment are likely to be growing slowly or not at all, it is more likely that stress-resistant stationary-phase cells will be introduced into food products rather than the relatively stress-sensitive exponential-phase cells.
The ability of E. coli O157:H7 to persist in food is critical for subsequent transmission and infection. Although components of the stress response regulons have been defined for E. coli K-12 (53, 86, 93) under single-stress conditions, stress response regulons that may be activated during exposure to multiple stresses are mostly uncharacterized, particularly in E. coli O157:H7. Here we utilized genome-wide transcription profiling to identify gene transcripts that accumulate in O157:H7 upon exposure to MAJ. As stress tolerance of E. coli is influenced by growth phase, we compared expression profiles of exponential- and stationary-phase cells to discern any growth phase-dependent and -independent responses. Results from this study indicate that E. coli O157:H7 induced multiple stress response regulons, including those controlled by CpxRA, σH, and σS, in response to a low-pH, high-osmolarity environment designed to mimic apple juice.
MATERIALS AND METHODS
Strain and growth conditions.
E. coli O157:H7 RIMD0509952 (Sakai), implicated in a radish sprout outbreak (55), was stored at −70°C in LB broth and 10% glycerol and grown as described previously (7). Briefly, E. coli O157:H7 was inoculated into 10 ml of LB from freezer stock and grown to an optical density at 600 nm (OD600) of 0.1 and then inoculated into 50 ml of MOPS (morpholinepropanesulfonic acid) minimal medium (57) with 0.1% glucose and grown to stationary phase at 37°C and 180 rpm. Cultures were transferred to 100 ml MOPS at a ratio of 1:75 and grown for 9 h before transfer to 100 ml MOPS at a ratio of 1:30, which was used for sampling at different growth phases for survival studies and RNA extraction.
Survival assays in MAJ.
MAJ containing 66 g fructose, 22 g glucose, 27 g sucrose, 6 g sorbitol, 6 g malic acid, 0.1 g sodium citrate, 2 g potassium phosphate dibasic trihydrate, 0.24 × 10⁻⁴ M calcium chloride, 0.25 × 10⁻⁵ M zinc chloride, and 2.09 × 10⁻⁶ M ferric sulfate per liter was prepared as described by Reinders et al. (64) with modifications based on the work of Mattick and Moyer (52). The pH was adjusted to 3.5 with 4 M sodium hydroxide, and the MAJ was then filter sterilized through a 0.22-μm filter (Millipore, Billerica, MA) and stored at 4°C until needed. The osmolarity of MAJ was 660 mosmol/liter, which is within the range of osmolarity for apple juice (650 to 730 mosmol/liter) (77). MAJ was chosen for these experiments rather than apple juice because we were unable to extract high-quality RNA from O157:H7 inoculated into apple juice in preliminary experiments, as a component of the apple juice coprecipitated with RNA. Survival assays were conducted with cells from four independent culture replicates at two time points, i.e., mid-exponential phase (OD600 of ∼0.25) and 1.5 h after entry into stationary phase (OD600 of ∼1) as determined by previous growth studies in MOPS minimal medium (7). Culture samples at each time point were directly inoculated into 100 ml of MAJ, prewarmed to 37°C, for an initial concentration of ∼106 CFU/ml. Inoculated MAJ was incubated statically at 37°C and vortexed for 5 s before sampling, serial dilution in phosphate-buffered saline, and plating onto plate count agar using an Autoplate 4000 (Spiral Biotech, Bethesda, MD) at 20, 40, 60, and 120 min for the exponential-phase samples and at 30, 60, 120, 180, and 240 min for the stationary-phase samples. Plates were incubated at 37°C overnight before colonies were counted using the Q Count (Spiral Biotech). The limit of detection was determined to be 100 CFU/ml.
RNA isolation.
At exponential phase (OD600 = 0.25, 3 h after inoculation) and stationary phase (OD600 = 0.95, 6.5 h after inoculation) (7), 10 ml of culture was mixed with 40 ml of MAJ held at 37°C. For comparison to cultures in MOPS medium, 10 ml of exponential-phase culture was added to 40 ml MOPS medium, and 10 ml of stationary-phase culture was added to 40 ml MOPS medium without glucose. A 10-min incubation time in MAJ was chosen to minimize cell death in the exponential-phase cells, as they were found to be more sensitive to the MAJ than the stationary-phase cells. After 10 min, 5 ml of 10% phenol-ethanol stop solution was added to the 50 ml of MAJ, vortexed, and poured into a 250-ml centrifuge bottle. Samples were centrifuged immediately at 6,000 rpm and 4°C for 30 min to pellet cells. The supernatant was removed, and cell pellets were suspended in 5 ml lysis buffer (20 mM sodium acetate, 2 mM EDTA) and immediately mixed with 5 ml of hot-acid-phenol-chloroform. Samples were held at 65°C for at least 10 min, with periodic shaking, before centrifuging at 4,000 rpm for 20 min. The supernatant was extracted again with acid-phenol-chloroform and then with chloroform-is amyl alcohol (24:1). RNA was precipitated overnight at −80°C in 2.5 volumes of 100% ethanol and 1/10 volume 3 M sodium acetate, pH 5.2. RNA samples were purified and treated with DNase using the RNeasy kit (Qiagen, Valencia, CA).
cDNA synthesis and hybridizations.
Reverse transcription reactions contained 6 μg RNA and 3 μg random primers and were conducted as described previously (7). cDNA was purified using PCR cleanup columns (Qiagen), and amino-allyl-labeled cDNA was coupled with either Cy3 or Cy5 (Amersham Biosciences, Piscataway, NJ) as described previously (7). The concentration of cDNA and amount of incorporated dye were measured for each sample using a Nanodrop spectrophotometer (Ambion).
The E. coli oligonucleotide set version 1 (Operon) was printed onto Corning UltraGaps (Corning Incorporated, Acton, MA)-coated slides at the Research Technology Support Facility at Michigan State University. Arrays were cross-linked, blocked, and washed, and labeled cDNA samples were prepared for hybridization as described previously (7). A total of 14 hybridizations were conducted: 5 biological replicate samples from stationary-phase cells in MOPS were directly hybridized with the corresponding replicate samples of stationary-phase cells in MAJ, 5 biological replicate samples from exponential-phase cells in MOPS were directly hybridized with the corresponding replicate samples of exponential-phase cells in MAJ, and 4 biological replicate samples of stationary-phase cells in MAJ were directly hybridized to 4 biological replicate samples of exponential-phase cells in MAJ. Hybridizations were carried out at 47°C for 16 to 18 h, as described elsewhere (7). Arrays were scanned using an Axon 4000b scanner, and images were analyzed using GenePix 6.0.
Microarray data analysis.
Raw intensity values for each array were normalized using pin-tip LOWESS in R (63) with the MAANOVA (v. 0.98-8) package. Signals from two replicate probes on each array were averaged and log2 transformation applied. Differences in transcript levels were determined using a mixed model ANOVA in R/MAANOVA that tested for significant differences due to growth phase (exponential or stationary), treatment (MOPS or MAJ), and the interaction of these two factors using the following linear model: array + dye + sample (biological replicate) + phase + treatment + phase × treatment. The analysis of variance (ANOVA) modeling allows for consideration of appropriate error structures for experiments with multiple sources of variation in microarray measurements (46). The random effects of the model were biological replicate and array effects, whereas the fixed effects were growth phase, treatment, and dye effects (22). The Fs statistic, a shrinkage estimator for gene-specific variance components that makes no assumptions about the distribution of variances across genes, was estimated (23). Significant changes in expression over time were determined by calculating the P values for the Fs statistic for each gene using 1,000 random permutations. The P values were adjusted to correct for type I error with the Benjamini-Hochberg linear step-up correction implemented in R/MAANOVA and a cutoff adjusted P value of 0.05. The fold change in expression between treatments and growth phases was determined by calculating the difference in log2 expression between the treatments or growth phases of interest.
GSEA.
For gene set enrichment analysis (GSEA), GSEA v2.0 (http://www.broad.mit.edu/gsea/) was utilized to determine if the expression of certain groups of genes was overrepresented in MAJ compared to MOPS. The normalized log2 expression ratios generated from the microarray analysis were ranked in order from highest to lowest and used as the input for GSEA of a preranked data set. Two gene sets were used for GSEA: the first set was based on the JCVI CMR role categories for E. coli O157:H7 Sakai (http://cmr.jcvi.org/tigr-scripts/CMR/CmrHomePage.cgi), and the second set was based on genes found to be upregulated under acid stress (2, 43, 53, 78, 83), under osmotic stress (86, 87), by RpoS (47, 59, 88), by CpxRA (27), by RpoH (58), by RpoE (68), and by the Rcs phosphorelay system (33). Gene sets with an FDR q value of <0.25 were determined to be significantly enriched (80).
qRT-PCR.
The expression levels of seven open reading frames (ORFs) with known roles in acid, osmotic, or membrane stress responses and that were determined to be differentially expressed were verified by quantitative real-time PCR (qRT-PCR). Primer pairs were designed based on the published reference genome sequence of E. coli O157:H7 Sakai (see Table S1 in the supplemental material). cDNA was synthesized from 1 μg of total RNA using the iScript Select cDNA synthesis kit (Bio-Rad, Hercules, CA) and random hexamers supplied with the kit. Template cDNA was diluted to 10−1 to 10−3 for use in qRT-PCRs, which were performed in triplicate for each cDNA sample tested and were carried out as described previously (7). Relative expression was determined using the method described by Pfaffl et al. (60), and the fluorescence data from the 16S rRNA target were used for normalization within samples. All samples were then compared to the expression levels of the exponential-phase culture in MOPS medium. The average log2 change in transcript levels from MOPS medium to MAJ and standard deviation from two independent RNA samples are reported for each growth phase tested.
Mutant creation and complementation.
A ΔcpxRA mutation was created in O157:H7 Sakai using the lambda red recombinase procedure (25, 56). pKM208 containing IPTG (isopropyl-β-d-thiogalactopyranoside)-inducible lambda red recombinase was inserted into O157:H7 Sakai using the electroporation procedure described by Murphy and Campellone (56). A PCR product containing a kanamycin cassette and cpxRA homology sequences was generated from pKD4 (25) (see Table S2 in the supplemental material) and transformed into Sakai carrying pKM208. Kanr mutants were confirmed with the KT and K2 primers (25), and the kanamycin cassette was subsequently removed using FLP recombinase encoded on pCP20. In-frame deletion of cpxRA was confirmed by sequencing.
For complementation of ΔcpxRA, a 2,727-bp DNA fragment containing the wild-type cpxRA sequence was amplified with complementation primers cpxRA-F and cpxRA-R (see Table 2 in the supplemental material) using TaKaRa LA Taq polymerase with the following cycle conditions: 1 min at 94°C; followed by 30 cycles of 30 s at 94°C, 30 s at 57°C, and 10 min at 72°C; followed by a final 10 min at 72°C. The PCR product was then cloned into pCR2.1-TOPO vector (Invitrogen), producing a pCR2.1-cpxRA plasmid. Subsequently, a second recombinant plasmid was constructed by cloning the cpxRA fragment digested with XbaI and HindIII from the pCR2.1-cpxRA plasmid into a low-copy vector, pACYC184 (XbaI/HindIII), generating the pACYC-cpxRA plasmid. The complement was created by transforming the purified pACYC-cpxRA plasmid into the cpxRA mutant.
TABLE 2.
Gene set enrichment analysis for genes upregulated in MAJ compared to MOPS minimal medium
| Gene set regulated bya: | FDR q valueb
|
|
|---|---|---|
| Exponential-phase MAJ/MOPS | Stationary-phase MAJ/MOPS | |
| RpoS | <0.001 | NS |
| Rcs phosphorelay | <0.001 | NS |
| RpoH | 0.208 | NS |
| CpxRA | NS | 0.001 |
| RpoE | NS | NS |
| Acid stress | 0.002 | 0.119 |
| Osmotic stress | <0.001 | 0.057 |
The RpoS (47, 59, 88), Rcs phosphorelay system (33), RpoH (58), CpxRA (27), RpoE (68), acid stress (2, 43, 53, 78, 83), and osmotic stress (86, 87) gene sets were determined from E. coli K-12 transcriptome and proteome studies.
FDR q values are reported for gene sets found to be significantly enriched in MAJ compared to MOPS. Only significant q values (<0.25) are reported. NS, not significant.
Survival studies for mutants.
Stationary-phase cultures of ΔcpxRA, O157:H7 Sakai, and ΔcpxRA complemented with pACYC-cpxRA were assayed for survival in MAJ at 37°C as described above. Survival of these strains was also quantified in MAJ at 22 and 4°C as described above except that cell numbers were enumerated at 0 and 24 h for samples at 22°C and at 0, 24, and 48 h for samples at 4°C. At least two independent replicates were tested in MAJ at each incubation temperature. Significant differences in log reduction in MAJ at each temperature were determined using ANOVA with the Tukey correction in SAS 9.1 Proc GLM (SAS Institute, Cary, NC).
Microarray data accession number.
Array data are available at NCBI GEO under accession no. GSE11052.
RESULTS
Survival of E. coli O157:H7 in MAJ.
The decrease in viable cells inoculated in MAJ (pH 3.5, 37°C) was measured to determine differences in survival between exponential- and stationary-phase cells of O157:H7 Sakai. In exponential phase, the average log decrease per hour was 1.42 ± 0.34, and in stationary phase it was 0.35 ± 0.32, indicating a significant increase (two sided t test, t = −4.54, df = 5.9, P = 0.004) in the survival rate from exponential to stationary phase (Fig. 1).
FIG. 1.
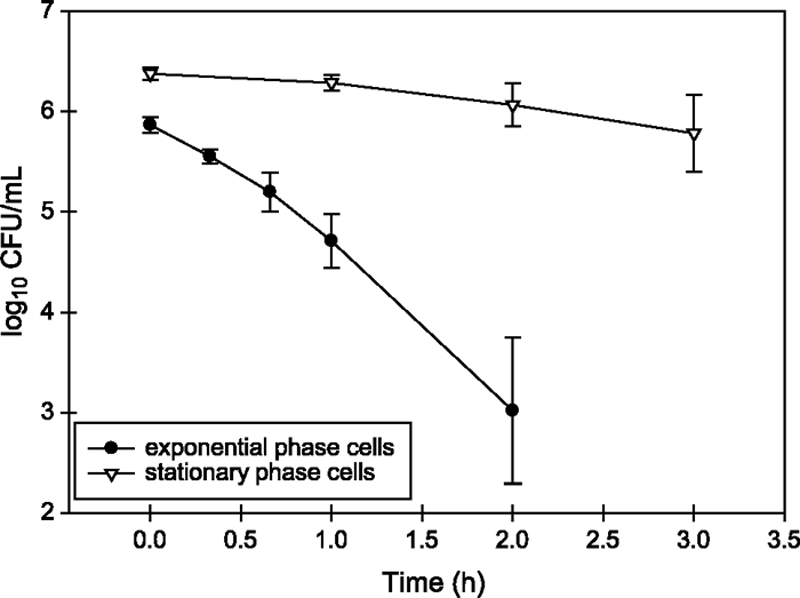
Survival of exponential-phase cells and stationary-phase cells of O157:H7 in MAJ at pH 3.5 and 37°C. The average of three independent replicates is plotted with the standard deviation for each time point that was sampled.
Significant changes in gene expression after 10 min of exposure to MAJ.
Significant changes in gene expression following exposure to MAJ (pH 3.5, 37°C) were observed for the 4,886 O157:H7 Sakai ORFs targeted on the microarray. A two-way ANOVA was utilized to identify changes in gene expression due to exposure to MAJ and if the transcriptional response to MAJ differed by growth phase. A total of 331 genes were significantly (adjusted P value of <0.05, fold change of ≥1.5) upregulated in MAJ; 164 genes exhibited a significant increase in expression due to exposure to MAJ and did not vary between exponential and stationary phases (Table 1). Among the remaining 167 genes, a significant growth phase effect was observed, with 72 genes having significantly higher levels of expression in stationary-phase cells and 96 having higher levels in exponential-phase cells (Table 1). Of the 331 significantly upregulated genes, 227 are backbone genes shared between E. coli K-12 and E. coli O157:H7 and 104 are O157-specific genes. Upregulated O157-specific genes include effector protein genes that are translocated through the type three secretion system (TTSS) (82), such as espJ, espB, espM2, espL3, and espZ (Table 1). In addition, a total of 228 genes were significantly downregulated upon exposure to MAJ (see Table S3 in the supplemental material). Forty-three genes had a significant interaction effect, indicating that expression of these transcripts upon exposure to MAJ was different depending on growth phase (see Table S4 in the supplemental material). Because we were most interested in genes with increased expression upon exposure to MAJ, those genes with decreased expression are not discussed further.
TABLE 1.
Genes significantly (adjusted P value of <0.05) induced 1.5-fold or greater upon exposure to MAJ
| Category and ECs no.a | Geneb | Log2 expression ratio
|
|
|---|---|---|---|
| MAJ/MOPS | Exponential phase/stationary phasec | ||
| Amino acid biosynthesis | |||
| ECs0512 | ylaD | 1.01 | |
| ECs0646 | ybdQ | 1.06 | −2.52 |
| ECs0704 | asnB | 0.77 | 2.72 |
| ECs2509 | yeaU | 4.51 | |
| ECs2638 | O157 | 0.60 | |
| ECs2784 | nac | 3.69 | |
| ECs3696 | lysR | 0.64 | |
| ECs4791 | glnL | 1.94 | 1.78 |
| ECs4867 | metJ | 1.07 | −1.34 |
| ECs4937 | metH | 0.73 | 1.71 |
| Biosynthesis of cofactors, prosthetic groups, and carriers | |||
| ECs0475 | ispA | 1.03 | 1.60 |
| ECs0632 | entC | 1.03 | |
| ECs2594 | cheR | 2.98 | 1.49 |
| ECs5311 | yjiA | 0.89 | −0.91 |
| Cell envelope | |||
| ECs0100 | lpxC | 0.99 | |
| ECs1428 | yceK | 0.65 | −2.08 |
| ECs2001 | hslJ | 2.25 | 1.35 |
| ECs2306 | mdtJ | 1.98 | 2.63 |
| ECs2348 | ydhA | 0.87 | 1.04 |
| ECs2515 | yeaY | 0.92 | −1.40 |
| ECs2690 | rcsA | 1.59 | 2.43 |
| ECs2859 | wcaF | 1.45 | 1.15 |
| ECs2914 | O157 | 0.64 | |
| ECs3151 | yfbB | 1.11 | |
| ECs3669 | ygdI | 2.83 | |
| ECs3860 | O157 | 0.93 | 0.85 |
| ECs4321 | dcrB | 1.30 | 1.58 |
| ECs4493 | yibD | 0.79 | −1.54 |
| ECs4666 | O157 | 1.73 | 1.51 |
| ECs4884 | yijP | 1.30 | 1.65 |
| ECs5011 | yjbG | 1.32 | |
| ECs5098 | adiY | 1.34 | |
| ECs5188 | ytfF | 0.86 | 1.22 |
| ECs5350 | slt | 0.90 | 0.82 |
| Cellular processes | |||
| ECs2086 | osmC | 1.59 | |
| ECs3258 | ddg | 0.73 | −1.37 |
| ECs1351 | terZ | 1.16 | 2.28 |
| ECs1652 | O157 | 1.60 | |
| ECs1766 | O157 | 0.72 | 2.36 |
| ECs2086 | osmC | 1.59 | |
| ECs2365 | sodB | 0.70 | |
| ECs2511 | yeaW | 0.74 | |
| ECs2597 | cheW | 1.79 | 2.89 |
| ECs2974 | stx1A | 0.63 | 0.89 |
| ECs3910 | mdaB | 3.68 | |
| ECs4307 | O157 | 1.18 | |
| ECs4367 | uspA | 0.79 | |
| ECs4399 | treF | 1.11 | −1.99 |
| ECs4626 | ibpB | 1.87 | |
| ECs4971 | O157 | 0.93 | |
| ECs5233 | yjgM | 1.23 | 1.69 |
| ECs5313 | yjiY | 0.76 | −0.74 |
| ECs5315 | tsr | 1.17 | |
| Central intermediary metabolism | |||
| ECs0899 | ybiV | 1.17 | 1.97 |
| ECs1487 | ndh | 1.99 | 1.61 |
| ECs2132 | yneI | 1.23 | |
| ECs2239 | O157 | 1.36 | |
| ECs2511 | yeaW | 0.74 | |
| ECs3604 | cysC | 1.41 | |
| ECs3668 | gcvA | 0.88 | |
| ECs5086 | phnE | 0.85 | |
| DNA metabolism | |||
| ECs1477 | holB | 1.47 | 1.11 |
| ECs2056 | yncE | 0.71 | |
| ECs2571 | ruvA | 0.85 | |
| ECs3556 | recA | 0.96 | 0.68 |
| Energy metabolism | |||
| ECs0117 | pdhR | 2.02 | |
| ECs0512 | ylaD | 1.01 | |
| ECs1054 | yccA | 1.93 | 1.95 |
| ECs1487 | ndh | 1.99 | 1.61 |
| ECs1862 | O157 | 1.54 | 1.34 |
| ECs2002 | ldhA | 0.62 | −0.97 |
| ECs2056 | yncE | 0.71 | |
| ECs2078 | fdnG | 0.85 | |
| ECs2132 | yneI | 1.23 | |
| ECs2239 | O157 | 1.36 | |
| ECs2511 | yeaW | 0.74 | |
| ECs2583 | yecK | 1.26 | |
| ECs3346 | hyfD | 0.92 | −2.17 |
| ECs3527 | ygaE | 0.84 | |
| ECs4217 | nirD | 1.30 | |
| ECs4355 | O157 | 1.12 | 1.32 |
| ECs4399 | treF | 1.11 | −1.99 |
| ECs4627 | ibpA | 1.66 | |
| ECs4819 | fdoH | 0.98 | |
| ECs4820 | fdoG | 1.02 | |
| ECs4867 | metJ | 1.07 | −1.34 |
| ECs4934 | aceK | 1.65 | |
| ECs5003 | O157 | 1.06 | |
| ECs5055 | nrfD | 0.57 | 1.70 |
| ECs5061 | fdhF | 1.06 | −2.00 |
| ECs5216 | treC | 1.02 | |
| Fatty acid and phospholipid metabolism | |||
| ECs0529 | ybaC | 0.57 | |
| ECs1255 | rutD | 1.67 | 1.46 |
| ECs1682 | fadR | 0.97 | 0.96 |
| ECs3693 | aas | 1.00 | 1.38 |
| Mobile element functions | |||
| ECs1881 | pspA | 1.80 | |
| ECs1882 | pspB | 0.99 | |
| ECs3240 | O157 | 1.07 | |
| ECs4535 | O157 | 0.91 | |
| ECs4537 | O157 | 0.93 | |
| ECs4960 | O157 | 1.18 | 0.88 |
| Protein fate | |||
| ECs0165 | htrA | 1.34 | |
| ECs0813 | O157 | 0.63 | |
| ECs2056 | yncE | 0.71 | |
| ECs2539 | htpX | 1.80 | 1.39 |
| ECs2882 | mdtA | 0.90 | |
| ECs4007 | sohA | 0.59 | |
| ECs4626 | ibpB | 1.87 | |
| ECs5122 | yjeH | 0.77 | |
| Protein synthesis | |||
| ECs3077 | rplY | 0.67 | 4.06 |
| ECs3398 | trmJ | 0.65 | 1.76 |
| ECs3460 | yfiA | 1.66 | |
| ECs3503 | O157 | 0.62 | |
| ECs4968 | O157 | 1.24 | −1.19 |
| ECs4969 | O157 | 0.87 | |
| ECs4970 | O157 | 0.77 | |
| ECs4977 | O157 | 0.99 | 1.19 |
| ECs4982 | O157 | 1.03 | −1.03 |
| ECs5147 | miaA | 2.13 | 1.40 |
| ECs5350 | slt | 0.90 | 0.82 |
| Purines, pyrimidines, and nucleotides | |||
| ECs1476 | tmk | 1.52 | 1.30 |
| ECs2559 | purT | 1.02 | |
| ECs3117 | nrdA | 1.37 | 1.64 |
| ECs4947 | O157 | 1.17 | |
| ECs5191 | cpdB | 0.76 | |
| Regulatory functions | |||
| ECs0504 | glnK | 4.88 | |
| ECs0507 | ybaY | 2.08 | |
| ECs0755 | O157 | 1.12 | |
| ECs0902 | ybiY | 1.34 | |
| ECs0967 | yljA | 0.64 | |
| ECs1199 | O157 | 0.67 | |
| ECs1250 | O157 | 1.52 | |
| ECs1489 | ycfQ | 1.14 | |
| ECs1557 | O157 | 0.58 | 0.68 |
| ECs1682 | fadR | 0.97 | 0.96 |
| ECs1880 | pspF | 0.75 | −1.65 |
| ECs2445 | osmE | 1.61 | −1.27 |
| ECs2706 | yedV | 1.08 | 1.19 |
| ECs2783 | cbl | 1.95 | 1.36 |
| ECs2784 | nac | 3.69 | |
| ECs2988 | O157 | 0.65 | |
| ECs2993 | O157 | 1.01 | |
| ECs3014 | yehV | 1.09 | 1.33 |
| ECs3058 | yeiC | 1.79 | 1.61 |
| ECs3136 | yfaX | 2.23 | 1.92 |
| ECs3260 | ypdA | 1.05 | −1.04 |
| ECs3427 | yfhH | 0.90 | |
| ECs3668 | gcvA | 0.88 | |
| ECs3911 | ygiN | 1.83 | |
| ECs4310 | rpoH | 1.23 | |
| ECs4697 | yieP | 0.75 | 1.05 |
| ECs4867 | metJ | 1.07 | −1.34 |
| ECs4890 | oxyR | 0.69 | 1.75 |
| ECs5004 | O157 | 1.18 | −0.67 |
| ECs5044 | soxS | 1.77 | 2.05 |
| ECs5313 | yjiY | 0.76 | −0.74 |
| ECs5325 | yjjQ | 0.76 | |
| Transcription | |||
| ECs3248 | evgA | 0.89 | −0.71 |
| ECs4048 | rbfA | 1.30 | 0.87 |
| ECs4060 | greA | 1.51 | |
| ECs4310 | rpoH | 1.23 | |
| ECs5220 | yjgF | 0.65 | 2.49 |
| Transport and binding proteins | |||
| ECs0377 | O157 | 0.63 | −1.60 |
| ECs0505 | amtB | 4.01 | |
| ECs0537 | copA | 0.80 | |
| ECs0624 | fes | 1.26 | |
| ECs0694 | ybeJ | 1.42 | |
| ECs0780 | ybgR | 2.04 | |
| ECs0887 | glnQ | 1.21 | 1.06 |
| ECs0888 | glnP | 1.85 | |
| ECs0889 | glnH | 2.08 | |
| ECs1746 | oppD | 1.11 | −2.23 |
| ECs2087 | ddpF | 1.04 | 1.03 |
| ECs2103 | ydeN | 0.79 | |
| ECs2302 | ynfM | 1.61 | |
| ECs2443 | celB | 0.69 | |
| ECs2510 | yeaV | 1.28 | |
| ECs2569 | yebI | 1.21 | |
| ECs3061 | fruB | 0.65 | |
| ECs3354 | focB | 2.21 | 2.38 |
| ECs3540 | proV | 1.99 | |
| ECs3541 | proW | 1.57 | 1.62 |
| ECs3543 | ygaY | 0.80 | |
| ECs3819 | galP | 1.41 | 2.38 |
| ECs4013 | O157 | 0.65 | |
| ECs4250 | feoA | 1.30 | |
| ECs4352 | O157 | 1.07 | −0.84 |
| ECs4422 | dppC | 0.65 | 0.75 |
| ECs4450 | xylG | 0.68 | |
| ECs4646 | tnaB | 1.09 | |
| ECs4839 | cpxP | 3.12 | |
| ECs5086 | phnE | 0.85 | |
| ECs5093 | proP | 1.76 | 1.25 |
| ECs5316 | yjiZ | 1.32 | 0.94 |
| Viral functions | |||
| ECs0278 | O157 | 0.59 | |
| ECs0507 | ybaY | 2.08 | |
| ECs0902 | ybiY | 1.34 | |
| ECs0967 | yljA | 0.64 | |
| ECs1110 | O157 | 0.60 | |
| ECs1758 | O157 | 1.50 | −0.94 |
| ECs3058 | yeiC | 1.79 | 1.61 |
| ECs3503 | O157 | 0.62 | |
| ECs3911 | ygiN | 1.83 | |
| ECs4588 | ler | 1.17 | 2.17 |
| ECs4968 | O157 | 1.24 | −1.19 |
| ECs4969 | O157 | 0.87 | |
| ECs4970 | O157 | 0.77 | |
| ECs4977 | O157 | 0.99 | 1.19 |
| ECs4982 | O157 | 1.03 | −1.03 |
| Hypothetical or unknown function | |||
| ECs0069 | yabI | 1.07 | |
| ECs0191 | yaeO | 1.18 | −1.18 |
| ECs0202 | yaeD | 1.15 | 1.66 |
| ECs0203 | yafB | 3.25 | |
| ECs0214 | O157 | 0.70 | −1.50 |
| ECs0233 | O157 | 0.88 | |
| ECs0239 | O157 | 0.74 | −0.87 |
| ECs0247 | ykfE | 2.23 | 1.75 |
| ECs0252 | yafQ | 0.80 | |
| ECs0253 | dinJ | 1.42 | −1.38 |
| ECs0266 | yafA | 0.74 | |
| ECs0272 | O157 | 0.62 | |
| ECs0429 | yaiY | 2.49 | 1.74 |
| ECs0445 | rdgC | 1.17 | 2.00 |
| ECs0478 | thiJ | 0.68 | 1.69 |
| ECs0514 | ybaJ | 1.14 | |
| ECs0552 | ybbK | 1.27 | |
| ECs0561 | ybbD | 1.27 | |
| ECs0629 | fepD | 1.10 | −0.58 |
| ECs0646 | ybdQ | 1.06 | −2.52 |
| ECs0661 | crcA | 2.45 | |
| ECs0728 | ybfA | 2.23 | −2.16 |
| ECs0781 | ybgS | 3.38 | |
| ECs0896 | ybiS | 0.87 | 1.84 |
| ECs0963 | ybjX | 1.07 | 1.60 |
| ECs1068 | O157 | 1.29 | −0.95 |
| ECs1091 | pchA | 2.07 | −1.79 |
| ECs1180 | O157 | 1.32 | |
| ECs1181 | O157 | 1.17 | −0.87 |
| ECs1182 | O157 | 1.27 | −1.25 |
| ECs1183 | O157 | 1.45 | 1.17 |
| ECs1184 | O157 | 1.14 | |
| ECs1197 | O157 | 1.52 | −1.15 |
| ECs1198 | O157 | 1.10 | −1.33 |
| ECs1243 | O157 | 0.89 | |
| ECs1246 | O157 | 0.80 | −0.86 |
| ECs1293 | O157 | 0.61 | |
| ECs1318 | O157 | 1.16 | −1.23 |
| ECs1342 | O157 | 0.66 | |
| ECs1350 | O157 | 0.57 | |
| ECs1397 | O157 | 0.90 | |
| ECs1438 | yceP | 1.76 | −1.80 |
| ECs1441 | yceB | 1.49 | |
| ECs1488 | ycfJ | 4.02 | 2.83 |
| ECs1490 | ycfR | 4.88 | |
| ECs1576 | O157 | 0.69 | −1.18 |
| ECs1588 | O157 | 0.77 | |
| ECs1593 | O157 | 1.34 | −0.82 |
| ECs1612 | O157 | 0.70 | |
| ECs1654 | O157 | 0.99 | |
| ECs1655 | O157 | 0.72 | −1.60 |
| ECs1691 | ycgR | 1.36 | 1.79 |
| ECs1760 | O157 | 0.76 | |
| ECs1763 | O157 | 0.59 | |
| ECs1771 | O157 | 0.90 | −0.98 |
| ECs1775 | O157 | 1.92 | −1.36 |
| ECs1823 | O157 | 0.69 | 0.97 |
| ECs1824 | nleG | 1.30 | 1.09 |
| ECs1829 | yciE | 0.89 | −2.67 |
| ECs1830 | yciF | 1.67 | −2.54 |
| ECs1831 | yciG | 1.89 | −3.55 |
| ECs1845 | O157 | 1.01 | |
| ECs2000 | ydbK | 0.95 | −1.76 |
| ECs2019 | O157 | 1.04 | 2.23 |
| ECs2020 | ydcF | 1.90 | 1.80 |
| ECs2085 | bdm | 4.28 | |
| ECs2144 | ydeH | 2.03 | 1.43 |
| ECs2182 | pchB | 1.75 | −1.65 |
| ECs2196 | O157 | 1.21 | −1.01 |
| ECs2200 | O157 | 1.03 | |
| ECs2265 | O157 | 1.03 | |
| ECs2278 | O157 | 0.96 | −0.65 |
| ECs2279 | O157 | 1.46 | −1.53 |
| ECs2280 | O157 | 1.37 | −1.09 |
| ECs2281 | O157 | 0.79 | −1.17 |
| ECs2283 | O157 | 0.67 | −1.48 |
| ECs2289 | ynfB | 1.05 | 1.22 |
| ECs2292 | ynfD | 1.07 | |
| ECs2303 | asr | 3.55 | |
| ECs2392 | ydiH | 0.92 | |
| ECs2449 | spy | 2.80 | |
| ECs2505 | yoaG | 0.84 | |
| ECs2506 | yeaR | 0.96 | |
| ECs2536 | mgrB | 1.09 | 1.35 |
| ECs2544 | yebT | 0.87 | 1.31 |
| ECs2558 | yebG | 1.16 | |
| ECs2581 | yecP | 1.06 | |
| ECs2614 | yecH | 0.84 | |
| ECs2622 | O157 | 0.74 | |
| ECs2623 | O157 | 0.68 | |
| ECs2692 | yodD | 1.09 | −4.09 |
| ECs2714 | espJ | 0.75 | |
| ECs2737 | pchC | 2.13 | −1.53 |
| ECs2758 | O157 | 0.94 | |
| ECs2759 | O157 | 0.59 | |
| ECs2987 | O157 | 0.77 | |
| ECs3105 | yojN | 0.75 | 1.86 |
| ECs3264 | frc | 0.80 | |
| ECs3267 | fryB | 1.35 | |
| ECs3270 | ypeC | 2.85 | 1.50 |
| ECs3355 | perM | 1.21 | |
| ECs3358 | hda | 1.14 | −1.61 |
| ECs3426 | yfhB | 1.10 | −1.82 |
| ECs3441 | yfiC | 1.40 | 1.54 |
| ECs3485 | espM2 | 0.84 | |
| ECs3526 | ygaU | 1.00 | −1.20 |
| ECs3529 | ygaP | 0.99 | −1.48 |
| ECs3531 | ygaW | 0.95 | |
| ECs3643 | chpR | 0.62 | 0.67 |
| ECs3692 | ygeD | 1.78 | 1.25 |
| ECs3779 | pepP | 0.75 | |
| ECs3780 | ygfB | 0.72 | 1.33 |
| ECs3887 | yghA | 0.64 | |
| ECs3906 | ygiW | 0.82 | −0.61 |
| ECs3953 | yqjI | 1.81 | |
| ECs3983 | yqjF | 2.07 | |
| ECs4034 | yhbO | 1.11 | |
| ECs4158 | yhdN | 1.35 | 1.04 |
| ECs4204 | yheT | 1.37 | |
| ECs4256 | yhgI | 0.76 | |
| ECs4294 | yhhA | 1.33 | |
| ECs4335 | O157 | 0.97 | 1.18 |
| ECs4357 | O157 | 0.63 | −1.19 |
| ECs4361 | yhiJ | 0.63 | −1.11 |
| ECs4384 | chuX | 1.32 | |
| ECs4453 | bax | 0.71 | 1.89 |
| ECs4554 | espB | 1.06 | |
| ECs4571 | sepZ | 1.07 | |
| ECs4584 | O157 | 0.57 | 1.38 |
| ECs4585 | O157 | 0.95 | 1.14 |
| ECs4599 | yicN | 0.82 | 0.73 |
| ECs4608 | O157 | 1.18 | |
| ECs4610 | O157 | 1.17 | 1.14 |
| ECs4642 | espL3 | 0.85 | |
| ECs4836 | yiiM | 1.36 | |
| ECs4958 | O157 | 0.61 | −1.30 |
| ECs4959 | O157 | 1.22 | −1.00 |
| ECs4981 | O157 | 0.80 | −0.91 |
| ECs5013 | yjbA | 0.68 | −1.03 |
| ECs5028 | yjbJ | 3.16 | |
| ECs5042 | yjcB | 0.82 | 1.49 |
| ECs5043 | yjcC | 1.18 | 2.20 |
| ECs5110 | yjdK | 1.81 | |
| ECs5126 | yjeJ | 1.09 | 2.63 |
| ECs5187 | ytfE | 0.73 | 1.69 |
| ECs5189 | ytfH | 0.85 | −2.18 |
| ECs5190 | ytfG | 0.89 | −1.71 |
| ECs5255 | O157 | 0.58 | −1.24 |
| ECs5312 | yjiX | 0.84 | −0.64 |
| ECs5326 | bglJ | 0.79 | |
| ECs5327 | fhuF | 0.63 | |
| ECs5334 | osmY | 2.23 | |
| ECs5338 | yjjI | 0.78 | −0.63 |
ECs numbers that are underlined were previously found to be upregulated under acid stress in E. coli K-12 (2, 43, 53, 78, 83). ECs numbers that are bolded were previously found to be upregulated under osmotic stress in E. coli K-12 (86, 87). ECs numbers that are italicized were previously found to be upregulated in stationary phase in MOPS minimal medium in E. coli O157:H7 (7).
“O157” indicates O157-specific genes.
Expression ratios are reported only for ORFs with a significant (adjusted P value of <0.05) growth phase effect.
Exposure to MAJ leads to increased expression of genes involved in the acid, osmotic, and envelope stress responses.
The O157:H7 transcriptional response to MAJ exposure included upregulation of many genes involved in the acid and osmotic stress responses. GSEA indicated that genes known to be upregulated under acid stress (2, 43, 53, 78, 83) and osmotic stress (86, 87) were significantly enriched in MAJ (Table 2). Genes known to be induced by acid, including asr (53, 83), osmY (2, 83), glnK (2), and adiY (43, 53), were significantly induced in MAJ (Table 1). Genes induced by exposure to hydrogen peroxide (93) were also found to be induced upon exposure to MAJ, including yfiA, ibpAB, soxS, and ycfR, further supporting the link between acid stress and oxidative stress (53). Similarly, genes known to be induced by osmotic stress, such as bdm, proV, proW, osmC, and osmY (86, 87), were significantly induced in MAJ (Table 1).
Regulons typically activated in response to envelope stress were upregulated during exposure to the MAJ environment. Genes regulated by CpxR (27) were induced in MAJ, including cpxP, spy, copA, and htrA, as well as ORFs regulated by RpoE (68), such as htrA, greA, rpoH, and ddg (Table 1). Ten genes regulated by the RcsCDB phosphorelay system (33), including bdm, osmY, wcaF, spy, ydcF, and yhbO, were significantly induced in MAJ. Two genes in the phage shock response system, pspA and pspB, were induced 2- to 3.5-fold in MAJ. GSEA further supported these findings, as genes known to be regulated by CpxRA, RpoH, and the Rcs phosphorelay were significantly enriched in either exponential- or stationary-phase cells exposed to MAJ (Table 2). Overall, these results indicate that damage to the cell membrane occurred in the MAJ environment, as evidenced by the activation of a number of the membrane stress responses.
Growth phase-dependent changes in gene expression upon exposure to MAJ.
Of the 331 genes significantly induced in MAJ compared to MOPS minimal medium, 167 genes also had significantly different transcript levels in exponential phase compared to stationary phase (Table 1). Ninety-five genes had significantly higher transcript levels in exponential phase, including transcriptional regulators soxS, oxyR, and rcsA (Table 1). Genes encoding components of the high-affinity transport system for the osmoprotectant glycine betaine (proW) and the proline/betaine symporter (proP) were expressed at 2.3- to 3-fold-higher levels in exponential-phase cells. Genes encoding heat shock proteins HslJ and HtpX had higher transcript levels in exponential phase, as did genes found to be upregulated during biofilm formation (4), such as ydfJ, metH, rplY, and yccA (Table 1). GSEA did not identify significant enrichment of any of the annotated role categories of genes in MAJ in exponential-phase cells but did identify significant enrichment of genes involved in amino acid biosynthesis and aerobic energy metabolism in exponential-phase cells in MOPS compared to MAJ (see Table S5 in the supplemental material), indicating overall downregulation of metabolic function upon exposure of exponential-phase cells to MAJ. However, GSEA did identify significant enrichment of RpoS-regulated genes in exponential-phase cells exposed to MAJ (Table 2), indicating activation of the general stress response.
O157-specific genes that were induced in MAJ with higher levels in exponential phase included the locus of enterocyte effacement (LEE)-encoded regulator, ler, and orf4 (ECs4585) and orf5 (ECs4584), encoded on the LEE pathogenicity island (Table 1). A gene present on the tellurite and adherence island, terZ, had increased expression upon exposure to MAJ and was expressed at higher levels in exponential phase. A TTSS non-LEE-encoded effector, nleG, was also induced upon exposure to MAJ and at higher levels in exponential phase. Along with nleG, four other ORFs (yjeJ, yhiJ, yibD, and rdgC) that are associated with O157:H7 colonization of the bovine gastrointestinal tract (30) were also induced in MAJ and had elevated transcript levels in exponential phase.
A total of 72 genes had increased transcript levels in stationary phase, including many previously shown to be induced in stationary phase (7), such as treF, dinJ, and oppD (Table 1). Genes known to be regulated by RpoS (59, 88) had significantly higher transcript levels in stationary phase, including yodD, yeaY, ygaU, yciG, and yceK. Transcripts of O157-specific genes encoding the PerC-like regulators PchA, -B, and -C, which regulate TTSS expression (38), were present at 2.8- to 3.2-fold-higher levels in stationary-phase cells.
qRT-PCR confirmation of changes in gene expression.
qRT-PCR confirmed the increased expression of seven ORFs upon exposure to MAJ (Fig. 2). The periplasmic protease encoded by degP was induced ∼3.5-fold in both exponential- and stationary-phase cells, and rpoH, encoding the alternate sigma factor σ32, as well as pspA, encoding a phage shock protein, had similar levels of induction in exponential- and stationary-phase cells. Microarray analyses did not detect significant differences in growth phase of the following genes, but a growth phase difference in transcript levels was determined by qRT-PCR. Transcripts of asr, encoding the acid shock protein, were found to be expressed at a greater level in exponential-phase cells (>1,000-fold) than in stationary-phase cells (320-fold) after the 10-min exposure to MAJ. Transcript levels of cpxP upon exposure to MAJ were higher in stationary phase (675-fold) than in exponential phase (108-fold). Transcript levels of the osmotically inducible proteins encoded by osmY and osmC exhibited a growth phase-specific response, with a larger induction in exponential-phase cells than in stationary-phase cells.
FIG. 2.
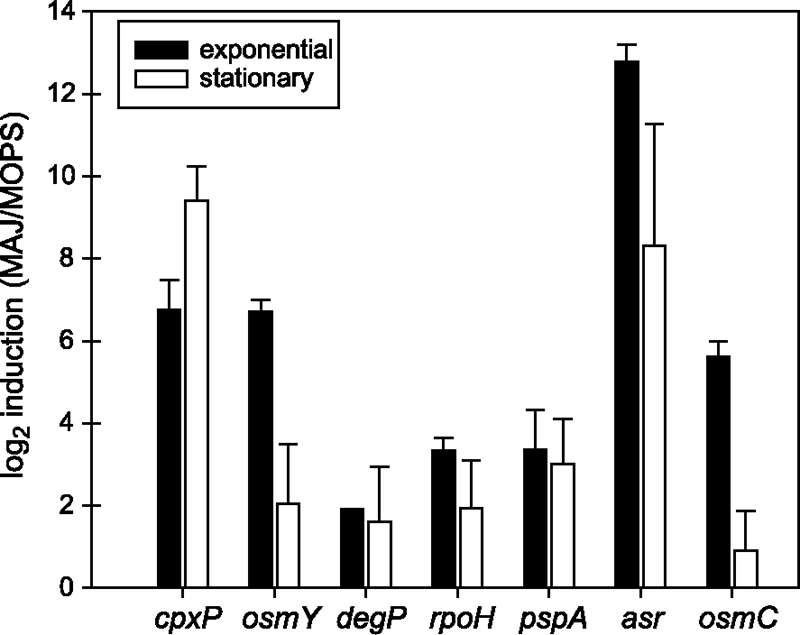
Changes in transcript levels upon exposure of O157:H7 Sakai to MAJ for exponential- and stationary-phase cultures determined by qRT-PCR. The mean log2 induction and standard deviation is reported for two independent replicates.
The Cpx membrane stress response contributes to survival of O157:H7 in MAJ.
As cpxP was one of the highly induced ORFs identified in the microarray experiment (Table 1; Fig. 2) and is one of the target genes most highly induced by the activated CpxRA system (28), we constructed ΔcpxRA in E. coli O157:H7 Sakai and complemented this mutant with pACYC-cpxRA to assess the contribution of the Cpx membrane stress response to survival of O157:H7 Sakai in MAJ. After 4 h of incubation in MAJ at 37°C, ΔcpxRA had a significantly (P < 0.01) higher log reduction (1.13 ± 0.39) than either O157:H7 Sakai (0.48 ± 0.21) or ΔcpxRA complemented with pACYC-cpxRA (0.35 ± 0.17) (Fig. 3). These results indicated that the Cpx system does influence survival of O157:H7 in MAJ at 37°C, so we extended our experiment to include MAJ incubated at 22 and 4°C, more typical storage temperatures for a juice product. Log reductions in MAJ at 4°C were similar for O157:H7 Sakai and the ΔcpxRA mutant. Significant differences in log reduction were observed between O157:H7 Sakai and the ΔcpxRA mutant in MAJ at 22°C (P = 0.038) (Fig. 3). In MAJ at 22°C, complementation of ΔcpxRA with pACYC-cpxRA did not restore the wild-type level of survival, indicating possible temperature-dependent effects on CpxRA.
FIG. 3.
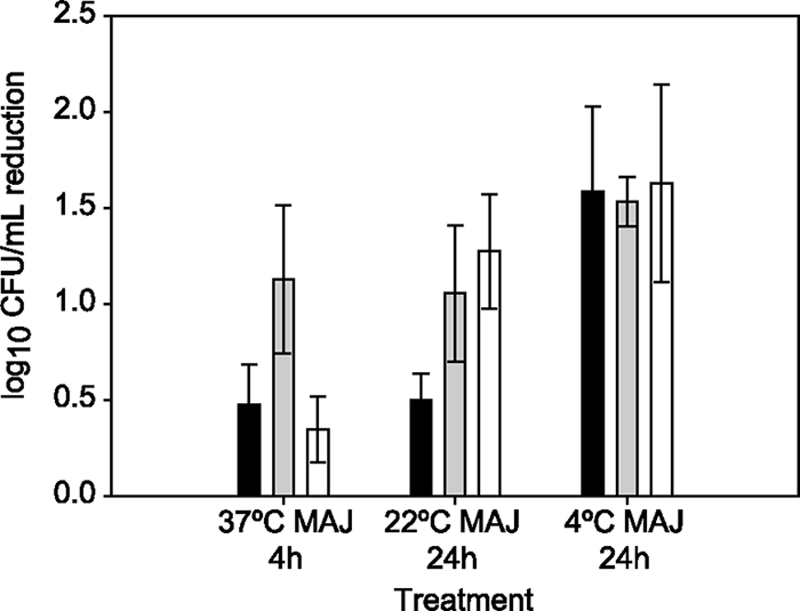
Survival of O157:H7 Sakai (black bars), the ΔcpxRA mutant (gray bars), and the ΔcpxRA mutant complemented with pACYC cpxRA (white bars) in MAJ at pH 3.5 when held at different storage temperatures. The mean log reduction and standard deviation for the specified time interval for at least two independent replicates are plotted.
DISCUSSION
Using whole-genome transcriptional profiling, we have identified transcript pattern alterations that occurred after 10 min of exposure to MAJ (pH 3.5, 37°C). The data presented here indicate that E. coli O157:H7 responds to the MAJ environment by increasing expression of genes involved in the response to acid, osmotic, oxidative, and envelope stresses. Genes involved in the acid and osmotic stress responses were significantly upregulated in MAJ in both exponential- and stationary-phase cells, indicating that these responses occur in a growth phase-independent manner. Expression of genes involved in the RpoH and Rcs phosphorelay-controlled membrane stress responses were significantly enriched in exponential-phase cells in MAJ, while the CpxRA-controlled membrane stress response was significantly enriched in stationary-phase cells in MAJ, indicating that these different membrane stress response systems were activated in a growth phase-dependent manner. Genes known to be regulated by the general stress response sigma factor RpoS were induced in exponential-phase cells in MAJ, while most of the RpoS-controlled genes were already expressed in stationary-phase cells in MOPS, prior to exposure to MAJ. Some of these RpoS-controlled genes induced by exposure to MAJ were expressed at significantly higher levels in stationary-phase cells, which may have contributed to the superior survival of stationary-phase cells in MAJ. The CpxRA-regulated envelope stress response was significantly upregulated upon exposure to MAJ and was shown to play an important role in survival of O157:H7 in MAJ.
The MAJ environment posed a combination of low pH (pH 3.5) and osmotic stress (13% sugar). Multiple studies have compared E. coli transcriptomes during steady-state (exponential) growth at acidic and neutral pHs, and a number of genes upregulated in response to MAJ are induced by acid during steady-state growth, including asr, yjbJ, and adiY (2, 34, 53, 83). Asr is an acid shock protein that is strongly induced at pHs of <5 and is transcribed by RpoS in stationary phase (73, 74). YjbJ is a predicted stress response protein that is also controlled by RpoS (88). AdiY is a transcriptional regulator of the arginine decarboxylase acid resistance system (50, 79). We did not observed increased expression of the glutamate decarboxylase or acid resistance fitness island genes upon exposure to MAJ, which complements the findings of Price et al., which indicated that the glutamate decarboxylase system was not essential for survival of E. coli O157:H7 in apple cider (61). Maurer et al. reported that growth at pH 5.0 led to increased expression of genes involved in oxidative stress, including those known to respond to H2O2 (53, 93). Here we also observed that oxidative stress response genes, including the heat shock protein genes ibpAB, the soxS regulator, and ycfR encoding a putative membrane protein involved in multiple-stress resistance (91), were expressed at significantly higher levels in MAJ. These data confirm that the response to the sublethal stress posed by the MAJ involve the activation of diverse stress response networks.
Few studies, however, have investigated the transcriptional response during the short-term adaptation to environmental stress. In a targeted analysis of stress response gene expression in E. coli O157:H7, Allen et al. identified activation of common stress responses, including those controlled by RpoS, RpoH, and RpoE after 15 min of exposure to either nutrient replenishment, cold shock, or acid shock (1). In E. coli K-12, Kannan et al. identified rapid changes in gene expression that were induced during the first 10 min of acid stress (43). Specifically, it was demonstrated that the 67 genes that were significantly induced in the MAJ environment also were upregulated during the initial transcriptional response when the pH shifted from 7.6 to 5.5 (43). Some of these genes, including rcsA and bdm, have not been previously characterized as acid-induced genes during steady-state growth. In addition, a number of genes involved in biofilm formation (4, 67) were identified as part of the dynamic response to low pH (43); these genes also were upregulated in MAJ. Together these data suggest that transcriptional alterations induced during growth in a biofilm overlap with the transcriptional response of adaptation to acid stress (pH 5.5 from pH 7.6) and to the low pH and high osmolarity of the MAJ environment.
It has been suggested that many of the genes and proteins induced by osmotic stress also play a more general role in cross-protection against diverse stress conditions. This cross-protection is reflected by direct or indirect transcriptional control through the general stress response sigma factor RpoS (87, 88). A number of genes encoding osmotically inducible proteins also are known to be induced during acid stress, including osmY, bdm, and osmC (83, 86, 88). In this study, 10 min of exposure to MAJ resulted in induction of osmY, bdm, and osmC as well as osmotically inducible transporter genes proV and proP. Osmotic stress activates the RcsBCD phosphorelay system, which in turn activates transcription of genes involved in colanic acid synthesis as well as lipoproteins and periplasmic proteins (33, 76). Here we observed increased expression of a number of RcsBCD-controlled genes, including osmC, bdm, and wcaF, which are involved in colanic acid biosynthesis. Production of colanic acid protects E. coli O157:H7 during storage in yogurt, another low-pH, high-osmolarity food product (49).
A number of O157-specific genes were upregulated in MAJ, including components of the TTSS and regulators of TTSS gene expression, including pchA, pchB, and ler. Secretion of TTSS proteins has been found to be highest under conditions similar to those in the gastrointestinal tract, which includes osmotic stress (31, 45). High osmolarity induces transcription of the genes encoding TTSS secreted proteins; Beltrametti et al. found that espA, espB, and espD transcript levels were 8- to 10-fold higher in the presence of 430 mM NaCl or an equimolar concentration of sucrose (5). This increase in expression was independent of growth phase, as esp expression increased in exponential- as well as stationary-phase cells after the shift to high osmolarity. Here we also observed a significant increase in expression of the TTSS effectors encoded by espB, espJ, and espZ. In contrast to osmotic stress as a positive signal for TTSS expression, a low-pH environment leads to decreased expression of LEE genes (75). Transcription of TTSS genes and secretion of TTSS proteins are temperature dependent, with maximal expression and secretion at 37°C (5, 31, 45). To avoid temperature-induced changes in gene expression, we assessed the transcriptional response to MAJ at 37°C, the same temperature at which the cultures were grown. Multiple regulators control LEE expression, including two-component response regulators that respond to environmental conditions. We observed that genes controlled by RcsB were upregulated in MAJ, and RcsB has been shown to positively or negatively influence LEE expression, via GrvA and PchA, depending on the growth medium (81). The TTSS had been predicted to be under the control of RpoE (68), one of the envelope stress responses activated in the MAJ environment. Here we observed increased expression of the positive regulators of ler encoded by pchA, -B, and -C in MAJ, which, along with osmotic stress, may have led to the elevated LEE expression observed in MAJ. pchA, pchB, and pchC are expressed at significantly higher levels in stationary phase (7), but other environmental signals that lead to activation of these genes are unknown.
The MAJ did not contain any sources of nitrogen and posed a nitrogen limitation stress, as evidenced by the strong induction of multiple genes encoding transporters that respond to low-nitrogen conditions (66, 94), including glnHPQ, amtB, oppD, and dppC. σN controls expression of genes involved in the response to nitrogen limitation, including glnK, which had one of the highest levels of induction in the MAJ. GlnK regulates nitrogen response gene expression during nitrogen starvation (10) and was also found to be induced in E. coli O157:H7 in response to acetate (2). Other genes with confirmed and putative σN binding sites were upregulated in MAJ, including the phage shock response genes pspA and pspB, the formate dehydrogenase gene fdfH, the nitrogen assimilation control regulator gene nac, and the glutamine synthetase gene glnA (66). σN is thought to mainly control nitrogen assimilation, and the other genes regulated by σN may alleviate problems associated with stresses that make nitrogen assimilation difficult (65).
Envelope stress was an important stress perceived by O157:H7 cells after 10 min of exposure to MAJ, as genes potentially regulated by three different envelope stress response regulons were activated. The phage shock response is activated by a number of environmental conditions, including osmotic stress (87); here we observed significant induction of the phage shock genes. The envelope stress responses controlled by CpxRA and σE upregulate genes encoding factors involved in envelope maintenance, such as extracytoplasmic chaperones and proteases. While stress is sensed through different mechanisms by Cpx and σE, an overlap exists in terms of the factors activated by both systems (72). Exposure to the acidic, high-osmolarity environment of MAJ led to increased expression of genes that are regulated by Cpx (27) and σE (68), including the periplasmic protease DegP, which can be regulated by both systems (20). During hyperosmotic shock, σE can induce expression of σH and thus the σH regulon (9); here we also observed increased expression of genes controlled by σH (58). The Cpx system is activated by alkaline pH, entry into stationary phase, osmotic stress, and accumulation of proteins in the periplasm (24, 26, 42). The Cpx system is downregulated in response to low pH (24, 43, 53). In contrast, we found increased expression of CpxRA-regulated genes after exposure to MAJ, potentially in response to misfolded proteins in the periplasm induced by the combination of osmotic and low-pH stress. We also determined that the CpxRA system significantly contributed to survival of O157:H7 Sakai in MAJ (Fig. 3). The storage temperature did influence the contribution of CpxRA to survival of O157:H7 in MAJ, with a significant contribution at 37 and 22°C but not at 4°C. The effect of the cpxRA deletion could be complemented at 37°C but not at 22°C, possibly due to the involvement of other transcriptional regulators or other factors that control CpxRA at this temperature. While it is clear that the Cpx system plays an important role in high-temperature stress (20), the impact of low temperature on Cpx expression and function has not been investigated.
E. coli O157:H7 induced multiple stress response regulons in response to a low-pH, high-osmolarity environment designed to mimic apple juice. Based on the changes in gene expression observed here, multiple sigma factors, including σH and σS, and two-component response regulators, including CpxRA, play a role in responding to this environment. Characterization of the stress responses induced during exposure to a food matrix could lead to selection and development of prudent strategies for inhibiting growth and survival of pathogens in foods, such as blocking stress signaling pathways.
Supplementary Material
Acknowledgments
This work was supported by Food Safety NRI 2005-35201-16362 from the U.S. Department of Agriculture and in part by funds from the NIAID, NIH, and DHHS under the Food and Waterborne Diseases Integrated Research Network (NIH research contract N01-AI-30058).
Footnotes
Published ahead of print on 3 April 2009.
Supplemental material for this article may be found at http://aem.asm.org/.
REFERENCES
- 1.Allen, K. J., D. Lepp, R. C. McKellar, and M. W. Griffiths. 2008. Examination of stress and virulence gene expression in Escherichia coli O157:H7 using targeted microarray analysis. Foodborne Pathog. Dis. 5:437-447. [DOI] [PubMed] [Google Scholar]
- 2.Arnold, C. N., J. McElhanon, A. Lee, R. Leonhart, and D. A. Siegele. 2001. Global analysis of Escherichia coli gene expression during the acetate-induced acid tolerance response. J. Bacteriol. 183:2178-2186. [DOI] [PMC free article] [PubMed] [Google Scholar]
- 3.Arnold, K. W., and C. W. Kaspar. 1995. Starvation- and stationary-phase-induced acid tolerance in Escherichia coli O157:H7. Appl. Environ. Microbiol. 61:2037-2039. [DOI] [PMC free article] [PubMed] [Google Scholar]
- 4.Beloin, C., J. Valle, P. Latour-Lambert, P. Faure, M. Kzreminski, D. Balestrino, J. A. Haagensen, S. Molin, G. Prensier, B. Arbeille, and J. M. Ghigo. 2004. Global impact of mature biofilm lifestyle on Escherichia coli K-12 gene expression. Mol. Microbiol. 51:659-674. [DOI] [PubMed] [Google Scholar]
- 5.Beltrametti, F., A. U. Kresse, and C. A. Guzman. 1999. Transcriptional regulation of the esp genes of enterohemorrhagic Escherichia coli. J. Bacteriol. 181:3409-3418. [DOI] [PMC free article] [PubMed] [Google Scholar]
- 6.Benjamin, M. M., and A. R. Datta. 1995. Acid tolerance of enterohemorrhagic Escherichia coli. Appl. Environ. Microbiol. 61:1669-1672. [DOI] [PMC free article] [PubMed] [Google Scholar]
- 7.Bergholz, T. M., L. M. Wick, W. Qi, J. T. Riordan, L. M. Ouellette, and T. S. Whittam. 2007. Global transcriptional response of Escherichia coli O157:H7 to growth transitions in glucose minimal medium. BMC Microbiol. 7:97. [DOI] [PMC free article] [PubMed] [Google Scholar]
- 8.Besser, R. E., S. M. Lett., J. T. Weber, M. P. Doyle, T. J. Barrett, J. G. Wells, and P. M. Griffin. 1993. An outbreak of diarrhea and hemolytic uremic syndrome from Escherichia coli O157:H7 in fresh-pressed apple cider. JAMA 269:2217-2220. [PubMed] [Google Scholar]
- 9.Bianchi, A. A., and F. Baneyx. 1999. Hyperosmotic shock induces the sigma32 and sigmaE stress regulons of Escherichia coli. Mol. Microbiol. 34:1029-1038. [DOI] [PubMed] [Google Scholar]
- 10.Blauwkamp, T. A., and A. J. Ninfa. 2002. Physiological role of the GlnK signal transduction protein of Escherichia coli: survival of nitrogen starvation. Mol. Microbiol. 46:203-214. [DOI] [PubMed] [Google Scholar]
- 11.Breuer, T., D. H. Benkel, R. L. Shapiro, W. N. Hall, M. M. Winnett, M. J. Linn, J. Neimann, T. J. Barrett, S. Dietrich, F. P. Downes, D. M. Toney, J. L. Pearson, H. Rolka, L. Slutsker, and P. M. Griffin. 2001. A multistate outbreak of Escherichia coli O157:H7 infections linked to alfalfa sprouts grown from contaminated seeds. Emerg. Infect. Dis. 7:977-982. [DOI] [PMC free article] [PubMed] [Google Scholar]
- 12.Cayley, S., B. A. Lewis, H. J. Guttman, and M. T. Record, Jr. 1991. Characterization of the cytoplasm of Escherichia coli K-12 as a function of external osmolarity. Implications for protein-DNA interactions in vivo. J. Mol. Biol. 222:281-300. [DOI] [PubMed] [Google Scholar]
- 13.Centers for Disease Control and Prevention. 2007. Escherichia coli O157:H7 infection associated with drinking raw milk—Washington and Oregon, November-December 2005. MMWR Morb. Mortal. Wkly. Rep. 56:165-167. [PubMed] [Google Scholar]
- 14.Centers for Disease Control and Prevention. 1997. Escherichia coli O157:H7 infections associated with eating a nationally distributed commercial brand of frozen ground beef patties and burgers—Colorado, 1997. MMWR Morb. Mortal. Wkly. Rep. 46:777-778. [PubMed] [Google Scholar]
- 15.Centers for Disease Control and Prevention. 1995. Escherichia coli O157:H7 outbreak linked to commercially distributed dry-cured salami—Washington and California, 1994. MMWR Morb. Mortal. Wkly. Rep. 44:157-160. [PubMed] [Google Scholar]
- 16.Centers for Disease Control and Prevention. 2006. Ongoing multistate outbreak of Escherichia coli serotype O157:H7 infections associated with consumption of fresh spinach—United States, September 2006. MMWR Morb. Mortal. Wkly. Rep. 55:1045-1046. [PubMed] [Google Scholar]
- 17.Centers for Disease Control and Prevention. 1993. Update: multistate outbreak of Escherichia coli O157:H7 infections from hamburgers—western United States, 1992-1993. MMWR Morb. Mortal. Wkly. Rep. 42:258-263. [PubMed] [Google Scholar]
- 18.Cheville, A. M., K. W. Arnold, C. Buchrieser, C. M. Cheng, and C. W. Kaspar. 1996. rpoS regulation of acid, heat, and salt tolerance in Escherichia coli O157:H7. Appl. Environ. Microbiol. 62:1822-1824. [DOI] [PMC free article] [PubMed] [Google Scholar]
- 19.Cody, S. H., M. K. Glynn, J. A. Farrar, K. L. Cairns, P. M. Griffin, J. Kobayashi, M. Fyfe, R. Hoffman, A. S. King, J. H. Lewis, B. Swaminathan, R. G. Bryant, and D. J. Vugia. 1999. An outbreak of Escherichia coli O157:H7 infection from unpasteurized commercial apple juice. Ann. Intern. Med. 130:202-209. [DOI] [PubMed] [Google Scholar]
- 20.Connolly, L., A. De Las Penas, B. M. Alba, and C. A. Gross. 1997. The response to extracytoplasmic stress in Escherichia coli is controlled by partially overlapping pathways. Genes Dev. 11:2012-2021. [DOI] [PMC free article] [PubMed] [Google Scholar]
- 21.Csonka, L. N. 1989. Physiological and genetic responses of bacteria to osmotic stress. Microbiol. Rev. 53:121-147. [DOI] [PMC free article] [PubMed] [Google Scholar]
- 22.Cui, X., and G. A. Churchill. 2003. Statistical tests for differential expression in cDNA microarray experiments. Genome Biol. 4:210. [DOI] [PMC free article] [PubMed] [Google Scholar]
- 23.Cui, X., J. T. Hwang, J. Qiu, N. J. Blades, and G. A. Churchill. 2005. Improved statistical tests for differential gene expression by shrinking variance components estimates. Biostatistics 6:59-75. [DOI] [PubMed] [Google Scholar]
- 24.Danese, P. N., and T. J. Silhavy. 1998. CpxP, a stress-combative member of the Cpx regulon. J. Bacteriol. 180:831-839. [DOI] [PMC free article] [PubMed] [Google Scholar]
- 25.Datsenko, K. A., and B. L. Wanner. 2000. One-step inactivation of chromosomal genes in Escherichia coli K-12 using PCR products. Proc. Natl. Acad. Sci. USA 97:6640-6645. [DOI] [PMC free article] [PubMed] [Google Scholar]
- 26.De Wulf, P., O. Kwon, and E. C. Lin. 1999. The CpxRA signal transduction system of Escherichia coli: growth-related autoactivation and control of unanticipated target operons. J. Bacteriol. 181:6772-6778. [DOI] [PMC free article] [PubMed] [Google Scholar]
- 27.De Wulf, P., A. M. McGuire, X. Liu, and E. C. Lin. 2002. Genome-wide profiling of promoter recognition by the two-component response regulator CpxR-P in Escherichia coli. J. Biol. Chem. 277:26652-26661. [DOI] [PubMed] [Google Scholar]
- 28.DiGiuseppe, P. A., and T. J. Silhavy. 2003. Signal detection and target gene induction by the CpxRA two-component system. J. Bacteriol. 185:2432-2440. [DOI] [PMC free article] [PubMed] [Google Scholar]
- 29.Dineen, S. S., K. Takeuchi, J. E. Soudah, and K. J. Boor. 1998. Persistence of Escherichia coli O157:H7 in dairy fermentation systems. J. Food Prot. 61:1602-1608. [DOI] [PubMed] [Google Scholar]
- 30.Dziva, F., P. M. van Diemen, M. P. Stevens, A. J. Smith, and T. S. Wallis. 2004. Identification of Escherichia coli O157:H7 genes influencing colonization of the bovine gastrointestinal tract using signature-tagged mutagenesis. Microbiology 150:3631-3645. [DOI] [PubMed] [Google Scholar]
- 31.Ebel, F., C. Deibel, A. U. Kresse, C. A. Guzman, and T. Chakraborty. 1996. Temperature- and medium-dependent secretion of proteins by Shiga toxin-producing Escherichia coli. Infect. Immun. 64:4472-4479. [DOI] [PMC free article] [PubMed] [Google Scholar]
- 32.Foster, J. W. 2004. Escherichia coli acid resistance: tales of an amateur acidophile. Nat. Rev. Microbiol. 2:898-907. [DOI] [PubMed] [Google Scholar]
- 33.Hagiwara, D., M. Sugiura, T. Oshima, H. Mori, H. Aiba, T. Yamashino, and T. Mizuno. 2003. Genome-wide analyses revealing a signaling network of the RcsC-YojN-RcsB phosphorelay system in Escherichia coli. J. Bacteriol. 185:5735-5746. [DOI] [PMC free article] [PubMed] [Google Scholar]
- 34.Hayes, E. T., J. C. Wilks, P. Sanfilippo, E. Yohannes, D. P. Tate, B. D. Jones, M. D. Radmacher, S. S. BonDurant, and J. L. Slonczewski. 2006. Oxygen limitation modulates pH regulation of catabolism and hydrogenases, multidrug transporters, and envelope composition in Escherichia coli K-12. BMC Microbiol. 6:89. [DOI] [PMC free article] [PubMed] [Google Scholar]
- 35.Hengge-Aronis, R. 1996. Back to log phase: sigma S as a global regulator in the osmotic control of gene expression in Escherichia coli. Mol. Microbiol. 21:887-893. [DOI] [PubMed] [Google Scholar]
- 36.Hilborn, E. D., J. H. Mermin, P. A. Mshar, J. L. Hadler, A. Voetsch, C. Wojtkunski, M. Swartz, R. Mshar, M. A. Lambert-Fair, J. A. Farrar, M. K. Glynn, and L. Slutsker. 1999. A multistate outbreak of Escherichia coli O157:H7 infections associated with consumption of mesclun lettuce. Arch. Intern. Med. 159:1758-1764. [DOI] [PubMed] [Google Scholar]
- 37.Hilborn, E. D., P. A. Mshar, T. R. Fiorentino, Z. F. Dembek, T. J. Barrett, R. T. Howard, and M. L. Cartter. 2000. An outbreak of Escherichia coli O157:H7 infections and haemolytic uraemic syndrome associated with consumption of unpasteurized apple cider. Epidemiol. Infect. 124:31-36. [DOI] [PMC free article] [PubMed] [Google Scholar]
- 38.Iyoda, S., and H. Watanabe. 2004. Positive effects of multiple pch genes on expression of the locus of enterocyte effacement genes and adherence of enterohaemorrhagic Escherichia coli O157:H7 to HEp-2 cells. Microbiology 150:2357-2571. [DOI] [PubMed] [Google Scholar]
- 39.Jenkins, D. E., S. A. Chaisson, and A. Matin. 1990. Starvation-induced cross protection against osmotic challenge in Escherichia coli. J. Bacteriol. 172:2779-2781. [DOI] [PMC free article] [PubMed] [Google Scholar]
- 40.Jenkins, D. E., J. E. Schultz, and A. Matin. 1988. Starvation-induced cross protection against heat or H2O2 challenge in Escherichia coli. J. Bacteriol. 170:3910-3914. [DOI] [PMC free article] [PubMed] [Google Scholar]
- 41.Jordan, K. N., L. Oxford, and C. P. O'Byrne. 1999. Survival of low-pH stress by Escherichia coli O157:H7: correlation between alterations in the cell envelope and increased acid tolerance. Appl. Environ. Microbiol. 65:3048-3055. [DOI] [PMC free article] [PubMed] [Google Scholar]
- 42.Jubelin, G., A. Vianney, C. Beloin, J. M. Ghigo, J. C. Lazzaroni, P. Lejeune, and C. Dorel. 2005. CpxR/OmpR interplay regulates curli gene expression in response to osmolarity in Escherichia coli. J. Bacteriol. 187:2038-2049. [DOI] [PMC free article] [PubMed] [Google Scholar]
- 43.Kannan, G., J. C. Wilks, D. M. Fitzgerald, B. D. Jones, S. S. Bondurant, and J. L. Slonczewski. 2008. Rapid acid treatment of Escherichia coli: transcriptomic response and recovery. BMC Microbiol. 8:37. [DOI] [PMC free article] [PubMed] [Google Scholar]
- 44.Kaur, J., D. A. Ledward, R. W. Park, and R. L. Robson. 1998. Factors affecting the heat resistance of Escherichia coli O157:H7. Lett. Appl. Microbiol. 26:325-330. [DOI] [PubMed] [Google Scholar]
- 45.Kenny, B., A. Abe, M. Stein, and B. B. Finlay. 1997. Enteropathogenic Escherichia coli protein secretion is induced in response to conditions similar to those in the gastrointestinal tract. Infect. Immun. 65:2606-2612. [DOI] [PMC free article] [PubMed] [Google Scholar]
- 46.Kerr, M. K. 2003. Linear models for microarray data analysis: hidden similarities and differences. J. Comput. Biol. 10:891-901. [DOI] [PubMed] [Google Scholar]
- 47.Lacour, S., and P. Landini. 2004. SigmaS-dependent gene expression at the onset of stationary phase in Escherichia coli: function of σS-dependent genes and identification of their promoter sequences. J. Bacteriol. 186:7186-7195. [DOI] [PMC free article] [PubMed] [Google Scholar]
- 48.Lange, R., and R. Hengge-Aronis. 1991. Identification of a central regulator of stationary-phase gene expression in Escherichia coli. Mol. Microbiol. 5:49-59. [DOI] [PubMed] [Google Scholar]
- 49.Lee, S. M., and J. Chen. 2004. Survival of Escherichia coli O157:H7 in set yogurt as influenced by the production of an exopolysaccharide, colanic acid. J. Food Prot. 67:252-255. [DOI] [PubMed] [Google Scholar]
- 50.Lin, J., M. P. Smith, K. C. Chapin, H. S. Baik, G. N. Bennett, and J. W. Foster. 1996. Mechanisms of acid resistance in enterohemorrhagic Escherichia coli. Appl. Environ. Microbiol. 62:3094-3100. [DOI] [PMC free article] [PubMed] [Google Scholar]
- 51.Marques, P. A., D. Worcman-Barninka, S. C. Lannes, and M. Landgraf. 2001. Acid tolerance and survival of Escherichia coli O157:H7 inoculated in fruit pulps stored under refrigeration. J. Food Prot. 64:1674-1678. [DOI] [PubMed] [Google Scholar]
- 52.Mattick, L. R., and J. C. Moyer. 1983. Composition of apple juice. J. Assoc. Off. Anal. Chem. 66:1251-1255. [PubMed] [Google Scholar]
- 53.Maurer, L. M., E. Yohannes, S. S. Bondurant, M. Radmacher, and J. L. Slonczewski. 2005. pH regulates genes for flagellar motility, catabolism, and oxidative stress in Escherichia coli K-12. J. Bacteriol. 187:304-319. [DOI] [PMC free article] [PubMed] [Google Scholar]
- 54.Mead, P. S., L. Slutsker, V. Dietz, L. F. McCaig, J. S. Bresee, C. Shapiro, P. M. Griffin, and R. V. Tauxe. 1999. Food-related illness and death in the United States. Emerg. Infect. Dis. 5:607-625. [DOI] [PMC free article] [PubMed] [Google Scholar]
- 55.Michino, H., K. Araki, S. Minami, S. Takaya, N. Sakai, M. Miyazaki, A. Ono, and H. Yanagawa. 1999. Massive outbreak of Escherichia coli O157:H7 infection in schoolchildren in Sakai City, Japan, associated with consumption of white radish sprouts. Am. J. Epidemiol. 150:787-796. [DOI] [PubMed] [Google Scholar]
- 56.Murphy, K. C., and K. G. Campellone. 2003. Lambda Red-mediated recombinogenic engineering of enterohemorrhagic and enteropathogenic E. coli. BMC Mol. Biol. 4:11. [DOI] [PMC free article] [PubMed] [Google Scholar]
- 57.Neidhardt, F. C., P. L. Bloch, and D. F. Smith. 1974. Culture medium for enterobacteria. J. Bacteriol. 119:736-747. [DOI] [PMC free article] [PubMed] [Google Scholar]
- 58.Nonaka, G., M. Blankschien, C. Herman, C. A. Gross, and V. A. Rhodius. 2006. Regulon and promoter analysis of the E. coli heat-shock factor, sigma32, reveals a multifaceted cellular response to heat stress. Genes Dev. 20:1776-1789. [DOI] [PMC free article] [PubMed] [Google Scholar]
- 59.Patten, C. L., M. G. Kirchhof, M. R. Schertzberg, R. A. Morton, and H. E. Schellhorn. 2004. Microarray analysis of RpoS-mediated gene expression in Escherichia coli K-12. Mol. Genet. Genomics 272:580-591. [DOI] [PubMed] [Google Scholar]
- 60.Pfaffl, M. W. 2001. A new mathematical model for relative quantification in real-time RT-PCR. Nucleic Acids Res. 29:e45. [DOI] [PMC free article] [PubMed] [Google Scholar]
- 61.Price, S. B., J. C. Wright, F. J. DeGraves, M. P. Castanie-Cornet, and J. W. Foster. 2004. Acid resistance systems required for survival of Escherichia coli O157:H7 in the bovine gastrointestinal tract and in apple cider are different. Appl. Environ. Microbiol. 70:4792-4799. [DOI] [PMC free article] [PubMed] [Google Scholar]
- 62.Rangel, J. M., P. H. Sparling, C. Crowe, P. M. Griffin, and D. L. Swerdlow. 2005. Epidemiology of Escherichia coli O157:H7 outbreaks, United States, 1982-2002. Emerg. Infect. Dis. 11:603-609. [DOI] [PMC free article] [PubMed] [Google Scholar]
- 63.R Core Development Team. 2005. R: a language and environment for statistical computing. R Foundation for Statistical Computing, Vienna, Austria.
- 64.Reinders, R. D., S. Biesterveld, and P. G. Bijker. 2001. Survival of Escherichia coli O157:H7 ATCC 43895 in a model apple juice medium with different concentrations of proline and caffeic acid. Appl. Environ. Microbiol. 67:2863-2866. [DOI] [PMC free article] [PubMed] [Google Scholar]
- 65.Reitzer, L. 2003. Nitrogen assimilation and global regulation in Escherichia coli. Annu. Rev. Microbiol. 57:155-176. [DOI] [PubMed] [Google Scholar]
- 66.Reitzer, L., and B. L. Schneider. 2001. Metabolic context and possible physiological themes of σ54-dependent genes in Escherichia coli. Microbiol. Mol. Biol. Rev. 65:422-444. [DOI] [PMC free article] [PubMed] [Google Scholar]
- 67.Ren, D., L. A. Bedzyk, S. M. Thomas, R. W. Ye, and T. K. Wood. 2004. Gene expression in Escherichia coli biofilms. Appl. Microbiol. Biotechnol. 64:515-524. [DOI] [PubMed] [Google Scholar]
- 68.Rhodius, V. A., W. C. Suh, G. Nonaka, J. West, and C. A. Gross. 2006. Conserved and variable functions of the sigmaE stress response in related genomes. PLoS Biol. 4:e2. [DOI] [PMC free article] [PubMed] [Google Scholar]
- 69.Richard, H., and J. W. Foster. 2004. Escherichia coli glutamate- and arginine-dependent acid resistance systems increase internal pH and reverse transmembrane potential. J. Bacteriol. 186:6032-6041. [DOI] [PMC free article] [PubMed] [Google Scholar]
- 70.Riley, L. W., R. S. Remis, S. D. Helgerson, H. B. McGee, J. G. Wells, B. R. Davis, R. J. Hebert, E. S. Olcott, L. M. Johnson, N. T. Hargrett, P. A. Blake, and M. L. Cohen. 1983. Hemorrhagic colitis associated with a rare Escherichia coli serotype. N. Engl. J. Med. 308:681-685. [DOI] [PubMed] [Google Scholar]
- 71.Robey, M., A. Benito, R. H. Hutson, C. Pascual, S. F. Park, and B. M. Mackey. 2001. Variation in resistance to high hydrostatic pressure and rpoS heterogeneity in natural isolates of Escherichia coli O157:H7. Appl. Environ. Microbiol. 67:4901-4907. [DOI] [PMC free article] [PubMed] [Google Scholar]
- 72.Ruiz, N., and T. J. Silhavy. 2005. Sensing external stress: watchdogs of the Escherichia coli cell envelope. Curr. Opin. Microbiol. 8:122-126. [DOI] [PubMed] [Google Scholar]
- 73.Seputiene, V., D. Motiejunas, K. Suziedelis, H. Tomenius, S. Normark, O. Melefors, and E. Suziedeliene. 2003. Molecular characterization of the acid-inducible asr gene of Escherichia coli and its role in acid stress response. J. Bacteriol. 185:2475-2484. [DOI] [PMC free article] [PubMed] [Google Scholar]
- 74.Seputiene, V., K. Suziedelis, S. Normark, O. Melefors, and E. Suziedeliene. 2004. Transcriptional analysis of the acid-inducible asr gene in enterobacteria. Res. Microbiol. 155:535-542. [DOI] [PubMed] [Google Scholar]
- 75.Shin, S., M. P. Castanie-Cornet, J. W. Foster, J. A. Crawford, C. Brinkley, and J. B. Kaper. 2001. An activator of glutamate decarboxylase genes regulates the expression of enteropathogenic Escherichia coli virulence genes through control of the plasmid-encoded regulator, Per. Mol. Microbiol. 41:1133-1150. [DOI] [PubMed] [Google Scholar]
- 76.Sledjeski, D. D., and S. Gottesman. 1996. Osmotic shock induction of capsule synthesis in Escherichia coli K-12. J. Bacteriol. 178:1204-1206. [DOI] [PMC free article] [PubMed] [Google Scholar]
- 77.Snyder, J. D. 1982. From pedialyte to popsicles: a look at oral rehydration therapy used in the United States and Canada. Am. J. Clin. Nutr. 35:157-161. [DOI] [PubMed] [Google Scholar]
- 78.Stancik, L. M., D. M. Stancik, B. Schmidt, D. M. Barnhart, Y. N. Yoncheva, and J. L. Slonczewski. 2002. pH-dependent expression of periplasmic proteins and amino acid catabolism in Escherichia coli. J. Bacteriol. 184:4246-4258. [DOI] [PMC free article] [PubMed] [Google Scholar]
- 79.Stim-Herndon, K. P., T. M. Flores, and G. N. Bennett. 1996. Molecular characterization of adiY, a regulatory gene which affects expression of the biodegradative acid-induced arginine decarboxylase gene (adiA) of Escherichia coli. Microbiology 142:1311-1320. [DOI] [PubMed] [Google Scholar]
- 80.Subramanian, A., P. Tamayo, V. K. Mootha, S. Mukherjee, B. L. Ebert, M. A. Gillette, A. Paulovich, S. L. Pomeroy, T. R. Golub, E. S. Lander, and J. P. Mesirov. 2005. Gene set enrichment analysis: a knowledge-based approach for interpreting genome-wide expression profiles. Proc. Natl. Acad. Sci. USA 102:15545-15550. [DOI] [PMC free article] [PubMed] [Google Scholar]
- 81.Tobe, T., H. Ando, H. Ishikawa, H. Abe, K. Tashiro, T. Hayashi, S. Kuhara, and N. Sugimoto. 2005. Dual regulatory pathways integrating the RcsC-RcsD-RcsB signalling system control enterohaemorrhagic Escherichia coli pathogenicity. Mol. Microbiol. 58:320-333. [DOI] [PubMed] [Google Scholar]
- 82.Tobe, T., S. A. Beatson, H. Taniguchi, H. Abe, C. M. Bailey, A. Fivian, R. Younis, S. Matthews, O. Marches, G. Frankel, T. Hayashi, and M. J. Pallen. 2006. An extensive repertoire of type III secretion effectors in Escherichia coli O157 and the role of lambdoid phages in their dissemination. Proc. Natl. Acad. Sci. USA 103:14941-14946. [DOI] [PMC free article] [PubMed] [Google Scholar]
- 83.Tucker, D. L., N. Tucker, and T. Conway. 2002. Gene expression profiling of the pH response in Escherichia coli. J. Bacteriol. 184:6551-6558. [DOI] [PMC free article] [PubMed] [Google Scholar]
- 84.Verheul, A., J. A. Wouters, F. M. Rombouts, and T. Abee. 1998. A possible role of ProP, ProU and CaiT in osmoprotection of Escherichia coli by carnitine. J. Appl. Microbiol. 85:1036-1046. [DOI] [PubMed] [Google Scholar]
- 85.Weagant, S. D., J. L. Bryant, and D. H. Bark. 1994. Survival of Escherichia coli O157:H7 in mayonnaise and mayonnaise-based sauces at room and refrigerated temperatures. J. Food Prot. 57:629-631. [DOI] [PubMed] [Google Scholar]
- 86.Weber, A., and K. Jung. 2002. Profiling early osmostress-dependent gene expression in Escherichia coli using DNA macroarrays. J. Bacteriol. 184:5502-5507. [DOI] [PMC free article] [PubMed] [Google Scholar]
- 87.Weber, A., S. A. Kogl, and K. Jung. 2006. Time-dependent proteome alterations under osmotic stress during aerobic and anaerobic growth in Escherichia coli. J. Bacteriol. 188:7165-7175. [DOI] [PMC free article] [PubMed] [Google Scholar]
- 88.Weber, H., T. Polen, J. Heuveling, V. F. Wendisch, and R. Hengge. 2005. Genome-wide analysis of the general stress response network in Escherichia coli: σS-dependent genes, promoters, and sigma factor selectivity. J. Bacteriol. 187:1591-1603. [DOI] [PMC free article] [PubMed] [Google Scholar]
- 89.Wick, L. M., and T. Egli. 2004. Molecular components of physiological stress responses in Escherichia coli. Adv. Biochem. Eng. Biotechnol. 89:1-45. [DOI] [PubMed] [Google Scholar]
- 90.Yuk, H. G., and D. L. Marshall. 2004. Adaptation of Escherichia coli O157:H7 to pH alters membrane lipid composition, verotoxin secretion, and resistance to simulated gastric fluid acids. Appl. Environ. Microbiol. 70:3500-3505. [DOI] [PMC free article] [PubMed] [Google Scholar]
- 91.Zhang, X. S., R. Garcia-Contreras, and T. K. Wood. 2007. YcfR (BhsA) influences Escherichia coli biofilm formation through stress response and surface hydrophobicity. J. Bacteriol. 189:3051-3062. [DOI] [PMC free article] [PubMed] [Google Scholar]
- 92.Zhao, T., and M. P. Doyle. 1994. Fate of enterohemorrhagic Escherichia coli O157:H7 in commercial mayonnaise. J. Food Prot. 57:780-783. [DOI] [PubMed] [Google Scholar]
- 93.Zheng, M., X. Wang, L. J. Templeton, D. R. Smulski, R. A. LaRossa, and G. Storz. 2001. DNA microarray-mediated transcriptional profiling of the Escherichia coli response to hydrogen peroxide. J. Bacteriol. 183:4562-4570. [DOI] [PMC free article] [PubMed] [Google Scholar]
- 94.Zimmer, D. P., E. Soupene, H. L. Lee, V. F. Wendisch, A. B. Khodursky, B. J. Peter, R. A. Bender, and S. Kustu. 2000. Nitrogen regulatory protein C-controlled genes of Escherichia coli: scavenging as a defense against nitrogen limitation. Proc. Natl. Acad. Sci. USA 97:14674-14679. [DOI] [PMC free article] [PubMed] [Google Scholar]
Associated Data
This section collects any data citations, data availability statements, or supplementary materials included in this article.