Abstract
Purpose: To evaluate the effects of total scanning time (TST), interscan delay (ISD), inclusion of image at peak vascular enhancement (IPVE), and selection of the input function vessel on the accuracy of tumor blood flow (BF) calculation with computed tomography (CT) in an animal model.
Materials and Methods: All animal protocols and experiments were approved by the institutional animal care and use committee prior to study initiation. After injection of 0.2 or 0.4 mL of iodinated contrast material, six rats with mammary adenocarcinoma (three tumors each) were scanned in the axial mode for 5 minutes with 1-second ISD (reference scan), 2.5-mm section thickness, 2.5-mm interval, pitch of 1.3, 120 kV, 240 mA, and 0.5-second rotation time. A total of 126 dynamic data sets were created with commercial software by varying TST and ISD, including or excluding the IPVE, and using the aorta or inferior vena cava (IVC) as the input function. Comparative analyses were used to test for significant differences (t test, Wilcoxon signed rank test). Regression analysis was performed to assess the relationship between attenuation of the input function vessel and BF.
Results: No significant difference was observed (P > .05) when TST was as short as 30 seconds (range, 20–23 mL/100 g). In sequences performed with an ISD longer than 8 seconds, BF was significantly elevated (P < .01). Inclusion of the IPVE eliminated this difference (P > .10). Use of the IVC as the input function resulted in significantly higher BF (P < .02), with a correlation between peak attenuation and BF (R2 = 0.43).
Conclusion: To reduce radiation dose in tumor perfusion with CT, TST can be reduced without causing significant changes in BF calculation in an animal model. Scanning the aortic reference with peak contrast enhancement reduces variability sufficiently to allow for longer ISDs.
© RSNA, 2009
The interest in using computed tomography (CT) as a functional imaging modality has increased in the past few years, mainly because of the development of multidetector perfusion scanning techniques and the implementation of commercial software that can be used to analyze dynamic data sets (1).
Dynamic contrast material–enhanced imaging involves intravenous injection of a contrast material bolus and subsequent sequential imaging to simultaneously monitor changes in the iodinated tracer concentration as a function of time both in the tissue of interest and in a vessel that is used as an input function to determine blood flow (BF) characteristics. Indeed, calculation of perfusion parameters and perfusion maps with perfusion software is strictly dependent on the arterial time-enhancement curves obtained by positioning a region of interest (ROI) on the input function vessel (2). Thus, the accuracy of results is highly related to the time resolution used to capture the vascular peak enhancement. Different software packages used for CT perfusion analysis derive the arterial time-enhancement curves by using various computation models and produce resulting parametric maps, with each pixel representing a parameter value. In the deconvolution model used by the commercial software available for our study, tissue perfusion is directly computed as a function of the height of the BF, while the area under the time-enhancement curve determines the relative blood volume (3).
The elevated time resolution required for accurate perfusion parameters inevitably results in high radiation exposure and long image processing time (4). Prolonged total scanning time (TST) and a short interscan delay (ISD) are the two factors most responsible for the increase in radiation exposure during dynamic scanning. Thus, an ideal low-dose protocol would involve selection of the longest ISD and shortest TST at optimal tube voltage and tube current to achieve perfusion calculation accuracy (5).
However, to our knowledge, the precise importance of the interaction of these factors is unknown. In an attempt to better characterize factors that influence the accuracy of tumor BF calculation to serve as a basis for developing a low-dose tumor perfusion protocol, we evaluated the effects of TST, ISD, inclusion of image at peak vascular enhancement, and selection of the input function vessel on the accuracy of tumor BF calculation with CT in an animal model.
MATERIALS AND METHODS
Toshiba America Medical Systems (Tustin, Calif) provides our department with unrestricted research funds, which were used to support the salary of the primary author (A.T.). At no point in the study was Toshiba America Medical Systems involved, and the authors were in control of all data submitted for publication. None of the authors received a consulting fee.
Overview of Experimental Methods and Design
Six rats with 1.2–1.5-cm-diameter subcutaneous R3230 mammary adenocarcinoma implanted in the soft tissue of the abdomen were scanned after manual injection of an iodinated contrast agent bolus via a tail vein. Unenhanced CT (20-mm section thickness) of the whole abdomen and pelvis was necessary to ensure complete tumor coverage for the average 4–5-cm length of the rats' bodies. A 0.4-mL dose of contrast material was injected in three rats (defined as rats with high-dose tumors), and a 0.2-mL dose was injected in the other three rats (defined as rats with low-dose tumors).
All scans were performed with a 16–detector row CT unit. To achieve a TST of 5 minutes to use as our reference standard, we needed to use the axial mode since this scanner does not allow continuous (cine) scanning of such duration. A 0.5-second rotation time was used with an ISD set at 1 second (time between the end of acquisition of one image and the start of acquisition of the following image at the same location), which resulted in 1200 images for each tumor. The 300 images corresponding to the largest tumor diameter were manually selected by one radiologist (A.T.) who had 5 years of experience in body imaging and 1 year of experience in perfusion CT to ensure reduction of respiratory variability and were analyzed at a workstation. BF was calculated with commercial software and a deconvolution model (6,7). This model is used to calculate tissue perfusion as a concentration gradient between two compartments (vascular and interstitial) by defining the tracer concentration as a function of both time and space (8).
By removing images from these reference data sets, data were manipulated by an author (A.T.) to simulate CT perfusion curves constructed from reduced scanning parameters (fewer acquired images). This process was mainly performed by varying the following parameters: TST, ISD, inclusion of image at peak vascular enhancement, and selection of input function vessels with different time-enhancement curves (aorta vs inferior vena cava [IVC]) for perfusion computation.
TST.—One data set per animal was obtained with a 1-second ISD for 5 minutes to serve as the original reference data set (300 images). Six additional data sets with TSTs of 30 seconds (30 images), 45 seconds (45 images), 1 minute (60 images), 2 minutes (120 images), 3 minutes (180 images), and 4 minutes (240 images) were acquired.
ISD.—From the aforementioned six data sets, the ISD was increased to 2, 4, 8, and 12 seconds by removing the corresponding intermediate images. For instance, by removing every other image in the original 1-second sequence, a 2-second sequence was produced prior to calculating BF. This resulted in 35 data sets: The 2-minute TST data sets with different ISDs (1-second ISD, 120 images; 2-second ISD, 60 images; 4-second ISD, 30 images; 8-second ISD, 15 images; and 12-second ISD, 10 images) were then selected for statistical analysis.
Inclusion of image at peak vascular enhancement.—At the tumor location previously selected, the time-enhancement curve was obtained by placing an ROI on the abdominal aorta (input function), and the image corresponding in time to the aortic enhancement peak was identified as the image at the peak of vascular enhancement. To study the role of the arterial input function peak point, the peak enhancement image was added back to the 2-, 4-, 8-, and 12-second ISD sequences and resulted in 63 data sets.
Selection of input function vessels with different time-enhancement curves for perfusion computation.—The IVC is the first abdominal vessel to become opacified in rats; therefore, it is considered an alternative input function. We took advantage of the tail intravenous injection approach by applying the same process with the IVC as with the input function. This resulted in a total of 126 data sets for each rat (combined total of 756 data sets for all six rats).
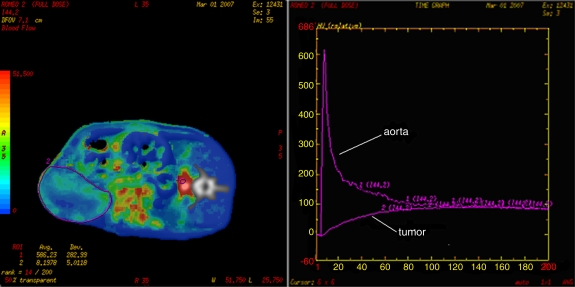
For each of the 756 data sets, a freehand tumor ROI was drawn (A.T.) along the tumor boundary separately for each data set (Fig 1) by using the same image for each ISD group of data sets. When the image with peak arterial enhancement was included, the ROI of the tumor was drawn on the image with peak input function enhancement.
Figure 1:
Tumor BF measurements. Left: After positioning an ROI (ROI 1) on the rat abdominal aorta (designated input function), a perfusion map is generated. After drawing a second freehand ROI (ROI 2) around the tumor boundary, mean tumoral BF values ± standard deviations are obtained. Right: Time-enhancement curves related to ROI 1 (aorta) and ROI 2 (tumor). The x-axis shows time (in seconds), and the y-axis shows attenuation (in Hounsfield units).
Animal Model
All animal protocols and experiments were approved by the institutional animal care and use committee prior to study initiation. For all experiments, anesthesia was induced by means of intraperitoneal injection of a mixture of ketamine (50 mg per kilogram of body weight; Ketaject, Phoenix Pharmaceuticals. Burlingame, Calif) and xylazine (5 mg/kg; Xyla-Ject, IUX Animal Health, St Joseph, Mo). When necessary, booster injections of one-tenth the original dose were administered every 30–60 minutes. The experiments were performed by using a well-established tumor model (R3230 mammary adenocarcinoma) in six female Fischer 344 rats (Taconic Farms, Germantown, NY) (mean age, 6 weeks; mean weight, 150 g).
CT Protocol
The rats were placed in the right lateral decubitus position on the patient couch of the 16–detector row CT scanner (LightSpeed Plus; GE Healthcare, Milwaukee, Wis). After a scout image was obtained, unenhanced scanning of the abdomen and pelvis was performed with the following parameters to enable us to identify the location of the tumor for planning purposes: helical acquisition, 2.5-mm section thickness, 2.5-mm interval, 27 mm/sec table speed, pitch of 1.3, 120 kV, 240 mA, 0.5-second rotation time, 25-cm scan field of view, 10-cm display field of view, and 512 × 512-mm matrix.
The images corresponding to the target lesion were selected on the unenhanced CT image, and the dynamic phase was used to ensure entire tumor coverage with the 20-mm section thickness. CT perfusion scanning was initiated 2 seconds prior to manual injection of a contrast material bolus (Optiray 350; Mallinckrodt, St Louis, Mo) that lasted approximately 5 seconds (0.2 mL in three rats, 0.4 mL in three rats) via the 24-gauge tail vein catheter. Tumors were scanned continuously with the axial mode acquisition technique (0.5-second rotation time, 0.5-second rotation at 1-second ISD, 20-mm scanning volume, 120 kVp, 200 mA) resulting in 1200 images for each tumor.
Image Analysis
Initially, the complete dynamic data set of 1200 images for each tumor (1-second ISD, 5-minute TST) was loaded on a workstation (Advanced; GE Healthcare) and analyzed with a body tumor perfusion algorithm (CT Perfusion 2.6.8; GE Healthcare) (A.T.).
Out of the four 5-mm reconstructed spatial sections available for each tumor, 300 images corresponding to the location of the largest tumor diameter area were selected and used for all analyses: An author (A.T.) placed an ROI (Fig 1) on the input function vessel (either the aorta or the IVC). Time-enhancement curves were then created: one for the aorta and one for the IVC. Subsequently, the image corresponding to the peak input function enhancement was identified and defined as the image at peak vascular enhancement for each data set.
A total of 756 retrospective perfusion data sets were obtained from the combination of seven TSTs, five ISDs, inclusion of the image at the peak vascular enhancement, and repeat analysis selecting different input functions (aorta and IVC).
Statistical Analyses
To study the effects of TST, ISD, and peak enhancement on BF calculation, the resultant mean BF ± standard deviation in the tumor ROI was measured for each perfusion data set. First, the mean tumor BF obtained at different TSTs was compared with that obtained with the reference standard. The same comparison was also performed for BF standard deviations to determine the effect of the number of images on noise in the BF calculations. These shorter perfusion data sets with longer ISDs, both with the peak image excluded and with the peak image included, were then analyzed. For each ISD group, mean BF ± standard deviation was compared with that of the 5-minute reference sequence. The comparative analyses of the effects of TST and ISD were tested for significance by using the paired t test (Windows Office Excel 2003; Microsoft, Redmond, Wash). The effects of inclusion of the image at peak vascular enhancement were assessed with the Wilcoxon signed rank test, which was performed with a calculator. Nonlinear (exponential) regression analysis was performed to determine the relationship between the attenuation of the peak point of the input function and BF.
RESULTS
Effect of TST on BF
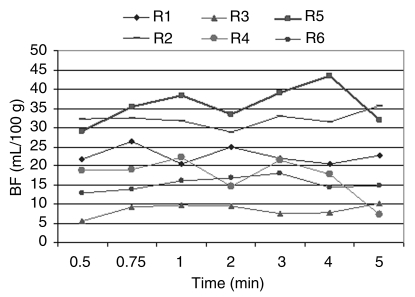
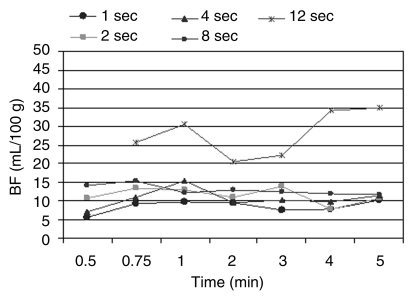
There was no significant difference (P > .23) in measured mean BF when the original 5-minute reference sequence performed with 1-second ISD was truncated to as few as 30 seconds (mean BF, 20 mL/100 g ± 6 vs 21 mL/100 g ± 8, respectively; BF range, 20–23 mL/100 g vs 20–25 mL/100 g, respectively) for a delay of 18–22 seconds from peak arterial enhancement, which occurred 8–12 seconds after intravenous contrast material injection. BF values obtained with sequences that used a 2-, 4-, or 8-second ISD were not significant (P > .05) when compared with BF values obtained with the reference sequence with TST shortened to 30 seconds. However, BF values obtained with a 12-second ISD were significantly higher than those obtained with the original reference sequence (13–319 mL/100 g vs 19–156 mL/100 g, respectively) (P < .01) (Fig 2).
Figure 2a:
(a) Graph shows BF values at different TSTs in all six rats (R1, R2, R3, R4, R5, R6). No significant changes (P > .05) are noted between values obtained with the original sequence and those obtained with the artificially truncated sequence. (b) Graph shows BF values at different TSTs for each ISD group in a representative rat. Mean BF values obtained with a TST of more that 45 seconds and evaluated for each ISD did not show a significant difference (P > .10) for ISDs of more than 8 seconds. Mean BF values obtained for each TST with a 12-second ISD were different when compared with the reference standard (1-second ISD).
Figure 2b:
(a) Graph shows BF values at different TSTs in all six rats (R1, R2, R3, R4, R5, R6). No significant changes (P > .05) are noted between values obtained with the original sequence and those obtained with the artificially truncated sequence. (b) Graph shows BF values at different TSTs for each ISD group in a representative rat. Mean BF values obtained with a TST of more that 45 seconds and evaluated for each ISD did not show a significant difference (P > .10) for ISDs of more than 8 seconds. Mean BF values obtained for each TST with a 12-second ISD were different when compared with the reference standard (1-second ISD).
Effect of ISD on BF
After we found that decreased TST did not affect BF, a fixed scanning time of 2 minutes was deemed adequate. At this interval, BF at 8- and 12-second ISDs (44 mL/100 g ± 49 and 100 mL/100 g ± 114, respectively) showed a significant difference when compared with BF obtained with the reference sequence (21 mL/100 g ± 9) (P < .05). Given that the mean BF for all six tumors was higher than that at baseline for 8- and 12-second ISDs, the corresponding standard deviation for sequences performed with 12-second ISD likewise showed significantly higher values (59 mL/100 g ± 52 vs 22 mL/100 g ± 3 at 12- and 1-second ISDs, respectively) (P < .01).
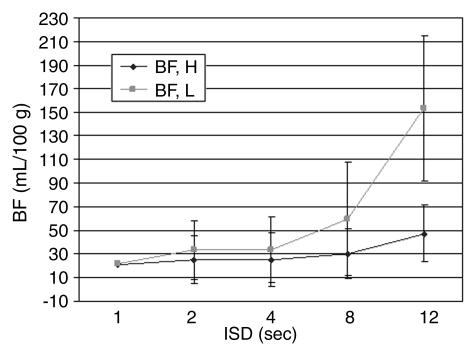
Further subset analyses revealed that beyond 8-second ISD, low-dose tumors had a significantly higher mean BF than did high-dose tumors when compared with the reference sequence (P < .05) (Fig 3).
Figure 3:
Graph shows mean BF changes at varying ISDs in rats that received a high (0.4 mL) (BF, H) or low (0.2 mL) (BF, L) dose of contrast material. With a TST of 2 minutes, mean BF was significantly higher (P < .01) with use of an ISD of more than 8 seconds. BF measurements in tumors studied with a low dose of contrast material are more influenced by ISD than are those studied with a high dose of contrast material. Vertical bars indicate standard deviations.
Effect of Image at Peak Vascular Enhancement on BF
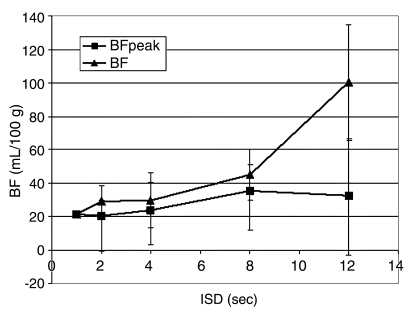
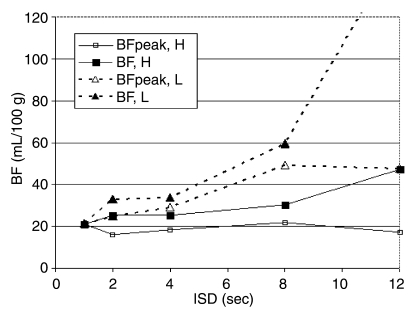
Inclusion of the image at peak vascular enhancement eliminated the variability for elevation of mean BF values. When the peak image was included, there was no significant difference (P > .10) in mean BF between the peak sequences with varying ISD and the original perfusion sequence, including that performed with the 8- and 12-second ISDs (Fig 4a). However, in rats that received the lower dose of contrast material, the difference between data sets with the image at peak vascular enhancement included or excluded showed greater variability (Fig 4b).
Figure 4a:
(a) Graph shows changes in BF measurements at various ISDs with (BFpeak) or without (BF) inclusion of the image at peak vascular enhancement. At a TST of 2 minutes, inclusion of the peak enhancement image eliminates variability of results, even for data sets obtained with an ISD of more than 8 seconds. Mean BF values and corresponding standard deviations (vertical bars) obtained with the peak enhancement image included were shown to be close to those obtained with the reference sequence, even for longer ISDs. (b) Graph shows changes in BF measurements at various ISDs with or without inclusion of the peak vascular enhancement image and use of different doses of intravenous contrast material. Inclusion of the peak vascular enhancement image contributes to reduced variability of results. However, BF values obtained after intravenous administration of a low dose of the iodinated contrast agent with the peak vascular enhancement image included (BFpeak, L) or excluded (BF, L) are globally higher than those obtained after intravenous administration of a high dose of the iodinated contrast agent with the peak vascular enhancement image included (BFpeak, H) or excluded (BF, H).
Figure 4b:
(a) Graph shows changes in BF measurements at various ISDs with (BFpeak) or without (BF) inclusion of the image at peak vascular enhancement. At a TST of 2 minutes, inclusion of the peak enhancement image eliminates variability of results, even for data sets obtained with an ISD of more than 8 seconds. Mean BF values and corresponding standard deviations (vertical bars) obtained with the peak enhancement image included were shown to be close to those obtained with the reference sequence, even for longer ISDs. (b) Graph shows changes in BF measurements at various ISDs with or without inclusion of the peak vascular enhancement image and use of different doses of intravenous contrast material. Inclusion of the peak vascular enhancement image contributes to reduced variability of results. However, BF values obtained after intravenous administration of a low dose of the iodinated contrast agent with the peak vascular enhancement image included (BFpeak, L) or excluded (BF, L) are globally higher than those obtained after intravenous administration of a high dose of the iodinated contrast agent with the peak vascular enhancement image included (BFpeak, H) or excluded (BF, H).
Selection of Different Input Function Vessels
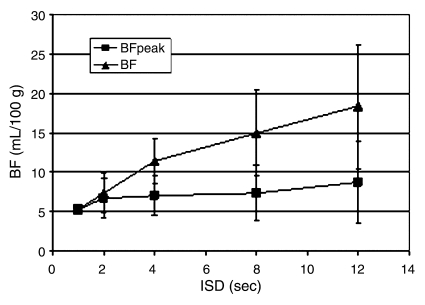
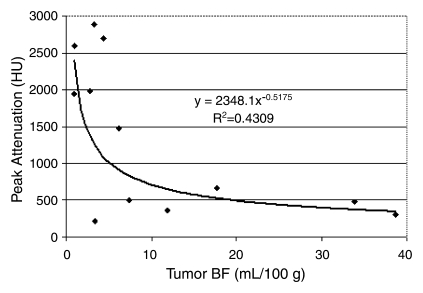
When the IVC was selected as the input function, mean BF was significantly (P < .02) higher for the initial sequence performed with an ISD of more than 2 seconds than for the reference sequence (Fig 5). Furthermore, an inverse exponential correlation between BF values and the maximum attenuation (enhancement peak) of the input curve was found (R2 = 0.43, P = .000007) (Fig 6).
Figure 5:
Graph shows BF changes at various ISDs with (BFpeak) or without (BF) the image at peak vascular enhancement, with use of the IVC as the input function vessel. For a TST of 2 minutes, mean BF and corresponding standard deviations (vertical bars) are higher when the image at peak vascular enhancement is excluded. Inclusion of the image at peak vascular enhancement eliminates variability of results related to longer ISDs.
Figure 6:
Graph shows relationship between BF and peak enhancement values. BF values obtained by using the aorta as the input function were found to be globally lower than those obtained by using IVC with measured values on the same tumors. An inverse relationship was also noted between attenuation values of the vessel selected as the input function and measured BF mean values.
The highest peak attenuation of the IVC resulted in lower measured tumor BF. For example, mean BF and mean peak enhancement obtained with 1-second ISD for 1 minute were 19 mL/100 g ± 14 and 425 HU ± 147, respectively, for the aortic input function, while use of the IVC resulted in a mean BF of 4 mL/100 g ± 2 and a mean peak enhancement of 2264 HU ± 498 (P < .01) (Fig 6).
DISCUSSION
The use of functional imaging techniques—including dynamic contrast-enhanced CT, dynamic contrast-enhanced magnetic resonance imaging, and positron emission tomography (1,9–11)—in oncology has been promoted over the past 20 years in part by the development of new therapeutic options, such as antiangiogenic drugs, and new approaches with which to assess tumor response to induction chemotherapy. In particular, traditional morphologic and dimensional criteria established by the World Health Organization and Response Evaluation Criteria in Solid Tumors are based on the value of time to progression as a measure of the clinical efficacy of treatment (12).
However, to better differentiate viable tumor tissue from necrotic tissue, this approach would be more effective with use of integrated functional imaging criteria. Within cancer imaging, CT continues to maintain its pivotal role. CT perfusion is a promising and practical functional imaging technique that can be incorporated into an existing CT protocol to provide potential additional value in the diagnosis, staging, and grading of cancer, as well as in therapy monitoring (13,14). The major disadvantage of CT perfusion is the amount of radiation needed to ensure correct temporal resolution for accurate perfusion maps. CT perfusion maps are built on different algorithms based on attenuation changes in time, expressed as the time-enhancement curve.
The most commonly used analysis methods are based on dilution theory (moments method), compartmental analysis (slope method), and a linear systems approach (deconvolution method) (6,7,13,15,16). The commercial software that we used in our analyses uses a deconvolution model (6,7) and yields four microvessel parameters: BF, blood volume, mean transit time, and permeability surface. Nevertheless, in this study, we decided to focus on a single parameter, BF, as it has been shown to most closely adhere to abnormal findings for this tumor model (14).
The deconvolution algorithm uses data from a reference ROI located in an afferent vessel, generally an artery, to deconvolve (calculate by using a convolution integral) the time course data and compute an impulse residue function for each pixel location (3). The impulse residue function indicates the fraction of the tracer (iodine) remaining in the tissue region over time since calculation of the time-enhancement curve is based on the relationship between the concentration of iodine in the tissue and feeding vessels (2,8). Thus, every tissue and tracer has a characteristic impulse residue function that can be modeled by considering the tracer kinetics for capillary-tissue exchange (17). In the deconvolution method, BF is directly calculated as dependent on the original impulse residue function obtained from the arterial ROI. The radiation burden for this strategy is determined by the number of images related to the ISD and the TST and the amperage used to obtain each image.
Different tumor perfusion protocols have been used to measure vascular and tumor enhancement curves. Many authors have proposed continuous scanning to include the peak enhancement of the arterial input function to achieve an accurate representation of the first pass of the injected contrast material bolus or vascular phase (18–21). A second phase, or interstitial phase, lasting at least 2 minutes, is also typically required to depict the dynamic characteristics of lesion enhancement (22). In a pilot study, Sahani et al (18) used continuous scanning for a TST of 45 seconds (200–240 mA) to assess tumor response of rectal cancer to combined chemotherapy and radiation therapy. Pancreatic cancer response to chemotherapy was also assessed with CT perfusion by using continuous acquisition for 40 seconds and 60 mAs (19). Gandhi et al (20) used a 50-second TST with 1-second ISD and 60 mA to assess the response to chemotherapy in patients with advanced squamous cell carcinoma of the oropharynx. Makari et al (21) assessed esophageal cancer response with a continuous acquisition of 40 seconds up to three times when the 2 cm allowed by the scanner was not sufficient to cover the tumor length. All in all, the number of images used by these authors ranged from 40 to more than 100, resulting in substantial variation in radiation exposure.
Although our results were obtained in a rat tumor model, most of the articles cited above refer to our target audience (human patients), in whom BF kinetics are known to be different from those in rats in terms of timing and amplitude. Thus, although we have shown that accuracy of the BF calculations can be preserved by using a 45-second scanning time and acquiring 15 images with a 4-second ISD in this model, further research will be needed to appropriately apply and transform the principles of the contrast kinetics for the algorithm used in this study to a human circulation model. Our results also highlight the challenges in obtaining accurate representation of the perfusion curve. For this computational model, it is not simply a matter of the number of acquisitions; it is also a matter of which time points along the time-enhancement curve are selected. For example, we showed that the inclusion of the single image with the maximum vascular peak enhancement point makes the CT perfusion calculation more stable and reliable, even when a 12-second ISD is chosen. This finding further suggests the possibility that if the time of peak enhancement of the input function is known, few images (possibly as few as four to six images) could be used to construct a reliable CT perfusion map. Regardless, efforts at devising strategies for ensuring that the vascular peak enhancement values are captured are clearly warranted.
Various protocols with different schedules in terms of ISD and TST have been proposed. Liver malignancies, whether primary or metastatic, have been studied by acquiring the first two images 0 and 7 seconds after initiation of the sequence, followed by acquisition of images with a 2-second ISD through 30 seconds after sequence initiation, and acquisition of a final group of images with a 7-second ISD thereafter (being the last acquisition of 19 at 86 seconds after contrast material injection) with the use of 150 mA (23). Colorectal cancer has also been studied by using multiple series of images with an ISD of 2 (10 images), 3 (10 images), or 6 (15 images) seconds; the latter acquisition was started 76 seconds after contrast material injection and with use of 180 mA (24).
To our knowledge, no studies have demonstrated systematic characterization of acquisition parameters of body tumor perfusion protocols in determining the accuracy of results. However, a study on cerebral BF calculation accuracy performed by Hirata et al (25) was performed to compare different retrospectively reconstructed data sets with the native data set acquired with a 60-second TST and a 1-second ISD (60 images). By using a first group of 10 contiguous images obtained with a 1-second ISD and a delayed group of images acquired with a 5-second ISD (total of 20 images), a correlation coefficient of more than 0.9 with the original data set was found.
The bolus tracking technique may be a new application for peak enhancement. Ng et al (26) used the bolus tracking technique to trigger aortic enhancement during dynamic scanning (eight breath-hold acquisitions) with a 90-second TST and 20 mAs. The rationale for using this contrast material infusion protocol was to (a) optimize conditions for the mathematic Patlak analysis model, which was used by the software used in this study to compute perfusion parameters to maintain a more constant intravascular concentration of contrast material; (b) minimize the concentration gradient between the intra- and extravascular spaces; and (c) improve the signal-to-noise ratio during image acquisition. These researchers compared tumor perfusion calculations performed with 10-mm z-axis tumor coverage with those performed with 40-mm z-axis tumor coverage and found that there was an improvement in calculation reproducibility in patients with lung cancer and increased z-axis tumor coverage (26). As discussed previously, the commercial software used in our study uses a deconvolution model. Perhaps when assessing the accuracy of (a) perfusion CT software packages based on Patlak analysis and (b) a linear systems approach, such as the deconvolution method, the performance of ultra-low-dose scans at more frequent intervals may be adequate to enable standardization of the enhancement curves. We acknowledge that this strategy may be in conflict with our initial purpose of reducing radiation dose, as multiple image acquisitions may be required to determine peak perfusion. Nevertheless, our data demonstrate the potential importance of this variable to the point that it requires serious consideration in planning a CT tumor perfusion protocol.
Furthermore, the amount of contrast material and the rate of contrast material administration that are responsible for the position in time and the height of the enhancement peak may also play an important role in the accuracy of calculations. Because of the correlation between attenuation and BF, our results suggest that variability is due less to the proximity of the input vessel to the target lesion and more to differences in iodine concentration. Mixing of blood either in the heart or in the capillary bed potentially affects the outcome.
Regardless, to obtain reproducible results in any patient, it is likely more important to use the same location as the input function vessel for each examination than it is to move the input function vessel as close to the tumor as possible. At a minimum, an attempt should be made to use the same vessel every time.
The selection of an input function vessel, such as the IVC, for perfusion computation with a higher peak enhancement reinforces our findings regarding the role of peak enhancement. As expected, the sequences, including the sequence used to obtain the peak enhancement image, were significant as well, indicating the importance of the peak point for correct perfusion analysis. Thus, BF values calculated with current software should be considered relative, not absolute. This observation suggests that mitigation of factors influencing the value of peak enhancement is necessary to improve the reproducibility of calculations and to optimize the contrast material dose.
Our study had several limitations—including the small number of tumors and, because of the manual injection necessary in rats, the absence of a standardized intravenous contrast material injection rate and, consequently, peak enhancement. Also, the timing of circulation in small animals is different from that in humans; however, once the principles of the contrast kinetics for the algorithm used in this study, and hence the parameters and variables that will influence the results, are adjusted to a human kinetic model, the results are likely to be the same. Along these lines, since this kinetic model is sensitive to peak vascular enhancement, a higher sampling rate may have been more appropriate in a rat model to further refine the peak aortic and/or IVC enhancement compared with the relatively long ISD (1 second) that we were obligated to select to perform a 5-minute scan. Furthermore, only one set of CT parameters was selected. Regarding parameters that influence calculation accuracy and dose exposure, evaluation of the amount of tube current was beyond the scope of this study. Nevertheless, these considerations need to be taken into account in future studies.
In summary, our results indicate that the accuracy of BF computation in a rat tumor model is determined in part by the input function and that it is important to include peak enhancement to obtain accurate results. Furthermore, CT perfusion does not require a scanning time of more than 20–30 seconds beyond peak input enhancement, and an ISD of up to 4 seconds can be used without appreciable loss of data quality. Our results may not apply to other models; however, we identified certain principles that are clinically related to widely available software. For example, inclusion of the peak enhancement image is an important factor in reducing the variability of results when an 8- or 12-second ISD is selected, suggesting that the accuracy of results depends not only on the number of images obtained but also on their location along the time-enhancement curve. The amount of intravenous contrast material administered and the peak enhancement of the vessel selected as the input function also play a role in the accuracy of calculations, since at a given fixed injection rate they are responsible for the time and height of the enhancement peak. Accordingly, further research is necessary to validate the role of inclusion of the peak enhancement image in computing tumor perfusion. A better understanding of the role of the peak image location along the time-enhancement curve may contribute to reduction of radiation exposure and optimization of intravenous contrast material administration. Studies in humans are needed to test the validity of these findings.
ADVANCES IN KNOWLEDGE
For CT perfusion in a rat tumor model, accuracy of results in blood flow (BF) calculation obtained by continuous scanning for several minutes to the peak enhancement of arterial input function can be equally achieved with a total scanning time (TST) of 20–30 seconds beyond peak enhancement and an interscan delay (ISD) of up to 4 seconds.
Shorter TST and longer ISD can substantially reduce radiation exposure and make perfusion analysis faster when peak enhancement is included in the CT perfusion protocol, without any loss in BF calculation accuracy (P > .10).
With use of a deconvolution model, BF calculations were found to be inversely proportional to the peak attenuation values of the input function vessel (P < .02).
In a rat tumor model, the accuracy of BF computation is determined in part by the input function; thus, to obtain accurate results it is important to devise strategies to ensure peak enhancement is captured by the scanning protocol.
IMPLICATION FOR PATIENT CARE
These results provide further guidelines for optimizing a reliable calculation of tumor CT perfusion while keeping radiation dose as low as possible.
Abbreviations
BF = blood flow
ISD = interscan delay
IVC = inferior vena cava
ROI = region of interest
TST = total scanning time
See Materials and Methods for pertinent disclosures.
Author contributions: Guarantors of integrity of entire study, A.T., V.R., S.N.G.; study concepts/study design or data acquisition or data analysis/interpretation, all authors; manuscript drafting or manuscript revision for important intellectual content, all authors; manuscript final version approval, all authors; literature research, A.T., V.R., S.N.G.; experimental studies, all authors; statistical analysis, A.T., O.S.P., C.J.W., V.R., S.N.G.; and manuscript editing, A.T., O.S.P., V.R., S.N.G.
Funding: This work supported by the National Institutes of Health (grants 1R01CA112533-01 and 1P50 CA101942-01 to S.N.G.).
References
- 1.Goh V, Padhani AR. Imaging tumor angiogenesis: functional assessment using MDCT or MRI? Abdom Imaging 2006;31:194–199. [DOI] [PubMed] [Google Scholar]
- 2.Lee TY. Functional CT: physiological models. Trends Biotechnol 2002;20(suppl 8):S3–S10.12570152 [Google Scholar]
- 3.GE Medical Systems. User guide. Milwaukee, Wis: GE Medical Systems, 2002; 240–255.
- 4.Fiorella D, Heiserman J, Prenger E, Partovi S. Assessment of the reproducibility of postprocessing dynamic CT perfusion data. AJNR Am J Neuroradiol 2004;25:97–107. [PMC free article] [PubMed] [Google Scholar]
- 5.Wintermark M, Smith WS, Ko NU, Quist M, Schnyder P, Dillon WP. Dynamic perfusion CT: optimizing the temporal resolution and contrast volume for calculation of perfusion CT parameters in stroke patients. AJNR Am J Neuroradiol 2004;25:720–729. [PMC free article] [PubMed] [Google Scholar]
- 6.Yeung WT, Lee TY, Del Maestro RF, Kozak R, Bennett JD, Brown T. An absorptiometry method for the determination of arterial blood concentration of injected iodinated contrast agent. Phys Med Biol 1992;37:1741–1758. [DOI] [PubMed] [Google Scholar]
- 7.Meier P, Zierler KL. On the theory of the indicator-dilution method for measurement of blood flow and volume. J Appl Physiol 1954;6:731–744. [DOI] [PubMed] [Google Scholar]
- 8.Koh TS, Wu XY, Cheong LH, Lim CC. Assessment of perfusion by dynamic contrast-enhanced imaging using a deconvolution approach based on regression and singular value decomposition. IEEE Trans Med Imaging 2004;23:1532–1542. [DOI] [PubMed] [Google Scholar]
- 9.Miles KA. Staging of non-small-cell lung cancer with integrated PET and CT. N Engl J Med 2003;349:1188–1190. [PubMed] [Google Scholar]
- 10.Tateishi U, Nishihara H, Tsukamoto E, Morikawa T, Tamaki N, Miyasaka K. Lung tumors evaluated with FDG-PET and dynamic CT: the relationship between vascular density and glucose metabolism. J Comput Assist Tomogr 2002;26:185–190. [DOI] [PubMed] [Google Scholar]
- 11.Rosen BR, Belliveau JW, Chien D. Perfusion imaging by nuclear magnetic resonance. Magn Reson Q 1989;5:263–281. [PubMed] [Google Scholar]
- 12.Therasse P, Eisenhauer EA, Verweij J. RECIST revisited: a review of validation studies on tumour assessment. Eur J Cancer 2006;42:1031–1039. [DOI] [PubMed] [Google Scholar]
- 13.Miles KA, Griffiths MR. Perfusion CT: a worthwhile enhancement? Br J Radiol 2003;76:220–231. [DOI] [PubMed] [Google Scholar]
- 14.Hakime A, Peddi H, Hines-Peralta AU, et al. CT perfusion for determination of pharmacologically mediated blood flow changes in an animal tumor model. Radiology 2007;243:712–719. [DOI] [PubMed] [Google Scholar]
- 15.Mullani NA, Gould KL. First-pass measurements of regional blood flow with external detectors. J Nucl Med 1983;24:577–581. [PubMed] [Google Scholar]
- 16.Harpen MD, Lecklitner ML. Derivation of gamma variate indicator dilution function from simple convective dispersion model of blood flow. Med Phys 1984;11:690–692. [DOI] [PubMed] [Google Scholar]
- 17.Koh TS, Cheong LH, Hou Z, Soh YC. A physiologic model of capillary-tissue exchange for dynamic contrast-enhanced imaging of tumor microcirculation. IEEE Trans Biomed Eng 2003;50:159–167. [DOI] [PubMed] [Google Scholar]
- 18.Sahani DV, Kalva SP, Hamberg LM, et al. Assessing tumor perfusion and treatment response in rectal cancer with multisection CT: initial observations. Radiology 2005;234:785–792. [DOI] [PubMed] [Google Scholar]
- 19.Abe H, Murakami T, Kubota M, et al. Quantitative tissue blood flow evaluation of pancreatic tumor: comparison between xenon CT technique and perfusion CT technique based on deconvolution analysis. Radiat Med 2005;23:364–370. [PubMed] [Google Scholar]
- 20.Gandhi D, Chepeha DB, Miller T, et al. Correlation between initial and early follow-up CT perfusion parameters with endoscopic tumor response in patients with advanced squamous cell carcinomas of the oropharynx treated with organ-preservation therapy. AJNR Am J Neuroradiol 2006;27:101–106. [PMC free article] [PubMed] [Google Scholar]
- 21.Makari Y, Yasuda T, Doki Y, et al. Correlation between tumor blood flow assessed by perfusion CT and effect of neoadjuvant therapy in advanced esophageal cancers. J Surg Oncol 2007;96:220–229. [DOI] [PubMed] [Google Scholar]
- 22.Lee TY, Purdie TG, Stewart E. CT imaging of angiogenesis. Q J Nucl Med 2003;47:171–187. [PubMed] [Google Scholar]
- 23.Tsushima Y, Funabasama S, Aoki J, Sanada S, Endo K. Quantitative perfusion map of malignant liver tumors, created from dynamic computed tomography data. Acad Radiol 2004;11:215–223. [DOI] [PubMed] [Google Scholar]
- 24.Li ZP, Meng QF, Sun CH, et al. Tumor angiogenesis and dynamic CT in colorectal carcinoma: radiologic-pathologic correlation. World J Gastroenterol 2005;11:1287–1291. [DOI] [PMC free article] [PubMed] [Google Scholar]
- 25.Hirata M, Sugawara Y, Murase K, Miki H, Mochizuki T. Evaluation of optimal scan duration and end time in cerebral CT perfusion study. Radiat Med 2005;23:351–363. [PubMed] [Google Scholar]
- 26.Ng QS, Goh V, Klotz E, et al. Quantitative assessment of lung cancer perfusion using MDCT: does measurement reproducibility improve with greater tumor volume coverage? AJR Am J Roentgenol 2006;187:1079–1084. [DOI] [PubMed] [Google Scholar]


