Abstract
Purpose: To evaluate an author-developed normalization algorithm for quantitative imaging of optical molecular probes through blood and to assess, in the rat aorta after focal aortic injury, the feasibility of measuring protease activity by using this method.
Materials and Methods: This study was performed according to a protocol approved by the institutional animal care committee. A Monte Carlo simulation was used to determine the pair of near-infrared (NIR) dyes that was best suited for the normalization algorithm. The authors tested the correction method in vitro and in vivo by injecting free dye mixtures intramurally in the aortas of four rats. The potential clinical utility was then evaluated by applying the method to the endovascular measurement of protease activity in a rat model of focal aortic injury.
Results: When the Monte Carlo simulation was used in the normalization algorithm, it was predicted that the intensities of signals from two NIR dyes would vary ±3% across 1 mm of blood compared with the intensity of the raw fluorochrome signal, which would vary ±60%. This result was validated in vitro. Endovascular imaging of free dye collections revealed that clinically relevant, uncontrollable differences in the amount of blood intervening between the imaging catheter and the dye collection precipitated dramatic variations in raw NIR fluorescence. However, use of the correction method resolved these variations such that the measured signal intensity correlated well with the different dye concentrations in the different animals. Moreover, endovascular imaging of the focal aortic injury model enabled successful measurement of enzyme activity in the walls of the rat aortas.
Conclusion: The authors implemented a correction method for quantitative real-time endovascular imaging of fluorescence that enables one to resolve the attenuating effects of blood on NIR signal.
© RSNA, 2009
Inflammation is a key driving force in the pathogenesis of a wide range of vascular diseases and is causally linked with the progression of these diseases to clinically adverse events. For example, atherosclerosis is an inflammatory process in which the vulnerability of a plaque to rupture has been correlated with the level of inflammatory activity within the necrotic core of the plaque (1). Similarly, the risk of aortic aneurysm rupture has been associated with intramural protease activity in the aneurysm wall (2–4). The ability to quantify inflammation on a molecular level in these disease states would lead to new insight into the pathophysiology of these conditions and substantially affect our ability to predict disease course and monitor treatment effectiveness.
A number of minimally invasive imaging techniques have been applied to evaluate vascular lesions; these methods include angiography, intravascular ultrasonography (US) (5), and optical coherence tomography (6). While many of these modalities yield excellent structural information about the target under interrogation, they cannot be used to glean data about the underlying inflammatory mechanisms that are responsible for the evolution of the targeted structure. Knowledge about the latter is important for the accurate differentiation of low-risk lesions from high-risk lesions that are likely to precipitate events such as carotid and coronary arterial occlusion and aneurysm rupture.
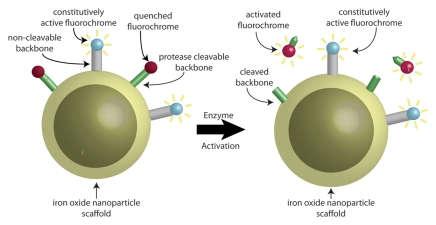
The advent of enzyme-activatable near-infrared (NIR) fluorescence molecular probes has enabled robust sensitive measurement of protease activity. Proteases such as cathepsins and matrix metalloproteinases are commonly upregulated in—and therefore serve as useful biomarkers for—many inflammatory conditions. As such, protease-activatable probes function as molecular beacons for a number of disease states (7–9), including inflammatory activity in vascular disease (10). Performing direct endovascular imaging of these probes without first flushing away blood is of limited usefulness, however, as blood attenuates NIR fluorescence, rendering the probe's measured fluorescence difficult to determine without knowledge of the amount of blood through which the photons have traveled. We hypothesized that this limitation could be resolved by using a second NIR signal whose attenuation properties in blood are well matched with those of the reporter NIR channel. With use of the ratio of one NIR signal to another NIR signal, the effects of the photons' absorption by and scattering in blood will cancel out to yield a quantitative ratio that is independent of the amount of blood through which the fluorescent photons have traveled (Fig 1a). Moreover, such a method could be used for endovascular measurement of enzyme activity when it is combined with a molecular probe that consists of two fluorochromes and is designed so that one fluorochrome is constitutively active while the other is enzyme activatable (Fig 1b). Calculating the ratio of enzyme-activatable fluorochrome activity to constitutively active fluorochrome activity would enable the imaging system to generate, in real-time, a quantitative ratio that reflects the level of inflammatory activity in a vascular lesion. The purposes of this study were to evaluate a normalization algorithm for quantitative imaging of optical molecular probes through blood that we developed and to assess the feasibility of measuring protease activity by using this method in the rat aorta after focal aortic injury.
Figure 1a:
Schematic representations of dual fluorescence correction method. (a) Dual fluorescence correction method is applied to endovascular imaging of vascular disease. Endovascular imaging catheter introduced into blood vessel collects fluorescent photons from two-fluorochrome (F1 and F2) molecular probe (shown in b). Using ratio of fluorescence signals from the two fluorochromes with real-time computer-based algorithm (additional hardware not shown) enables in vivo imaging of NIR fluorescence in vascular lesions, despite attenuating effects of intervening blood. (b) Design of two-fluorochrome molecular probe used to image protease activity consists of iron oxide nanoparticle scaffold, onto which two fluorochromes that fluoresce at distinct wavelengths are attached. One fluorochrome (blue) is constitutively active and bound to a noncleavable peptide backbone. The second fluorochrome (red) is quenched initially; however, it regains its fluorescence properties and becomes activated after protease cleavage of the peptide backbone to which it is attached. By using the ratio of activatable fluorochrome signal to constitutively active fluorochrome signal, one can measure the enzyme activity in vascular lesions through blood.
Figure 1b:
Schematic representations of dual fluorescence correction method. (a) Dual fluorescence correction method is applied to endovascular imaging of vascular disease. Endovascular imaging catheter introduced into blood vessel collects fluorescent photons from two-fluorochrome (F1 and F2) molecular probe (shown in b). Using ratio of fluorescence signals from the two fluorochromes with real-time computer-based algorithm (additional hardware not shown) enables in vivo imaging of NIR fluorescence in vascular lesions, despite attenuating effects of intervening blood. (b) Design of two-fluorochrome molecular probe used to image protease activity consists of iron oxide nanoparticle scaffold, onto which two fluorochromes that fluoresce at distinct wavelengths are attached. One fluorochrome (blue) is constitutively active and bound to a noncleavable peptide backbone. The second fluorochrome (red) is quenched initially; however, it regains its fluorescence properties and becomes activated after protease cleavage of the peptide backbone to which it is attached. By using the ratio of activatable fluorochrome signal to constitutively active fluorochrome signal, one can measure the enzyme activity in vascular lesions through blood.
MATERIALS AND METHODS
Monte Carlo Simulation
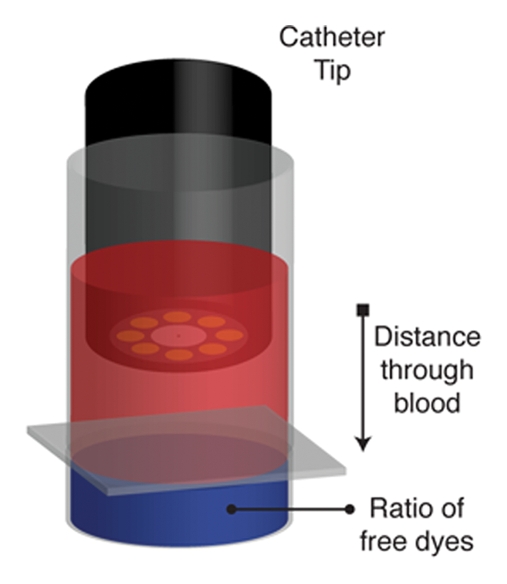
A Monte Carlo simulation (11) was designed to model an in vitro experiment in which a 1.6-mm-diameter fiberoptic catheter was inserted into a cuvette filled with oxygenated mouse blood that was suspended above a volume of unconjugated fluorescent dye. The catheter was withdrawn from the blood-dye interface, and the attenuation of the fluorescent signal from the dye traveling through the blood was calculated.
The simulation was designed such that the photons in the model underwent three discrete attenuation steps: First, photons of a specified wavelength were emitted by the catheter tip and entered a volume of blood, where they underwent absorption and scattering events that reduced the probability of their survival and altered their trajectory. The probability of being absorbed by blood was modeled as an exponential function that depended on the wavelength of the photon and the distance the photon traveled; the Gegenbauer-Kernel phase function was used to calculate the scattering angle. Absorption coefficients were highly wavelength dependent; scattering coefficients, however, were similar across the NIR spectrum (12). Second, once the photons entered the dye collection, they underwent an absorption process, with the probability of the photon surviving determined according to the extinction coefficient of the dye. After this absorption process, a new fluorescent photon was released in a random direction. Finally, the photons whose velocity vector directed them back through the volume of blood and into the catheter tip underwent scattering and absorption events again—this time with the coefficients adjusted for the photons' new fluorescence wavelength. The overall probability of a photon emitted from the catheter tip surviving the absorption and scattering in the blood, a new fluorescent photon being released, and the originally emitted fluorescent photon traveling back through the volume of blood and being collected by the imaging catheter was calculated for each photon. We then determined the total fluorescence signal at a given distance point by summing the probabilities of each photon's survival in a given run and dividing this sum by the total number of photons in the run. A typical run consisted of 100 000 photons at each distance point and required approximately 1 hour of computational time on a computer (Quad G5 PowerMac; Apple, Cupertino, Calif).
The simulation was designed to enable the rapid modulation of variables such as absorption, scattering, and extinction coefficients so that a number of NIR dyes could be evaluated. We first validated the simulation by comparing experimentally obtained values of the fluorescence intensity of two fluorochromes—Alexa Fluor 750 (AF750; Invitrogen, Carlsbad, Calif) and cyanine 5.5 (Cy5.5; Amersham Biosciences, Pittsburgh, Pa)—through 0.5, 1.0, 1.5, and 2.0 mm of blood with computationally predicted values. After this validation step, we used previously published absorption and scattering coefficients of excitation and emission photons to interrogate the following fluorochromes in the simulation: six Alexa Fluor NIR dyes (Invitrogen)—AF633, AF647, AF660, AF680, AF700, and AF750—and three cyanine NIR dyes (Amersham)—Cy5, Cy5.5, and Cy7. We divided the curve representing the fluorescence attenuation through blood for each dye by the curve representing the fluorescence attenuation through blood for every other dye to calculate the degree to which these ratios changed across 1 mm of blood and to determine the pair of fluorochromes that exhibited the least signal variation. All simulation results were evaluated independently by two authors (R.A.S., U.M.).
Catheter-based Dual-Channel Fluorescence System
All imaging examinations were conducted by using a previously described fiberoptic catheter-based dual-channel fluorescence imaging system that permits simultaneous real-time imaging of two NIR fluorescence channels (13,14). In brief, the in-house–designed system is composed of an imaging catheter coupled to an optical collection setup that consists of two high-spatial-resolution cameras (Pixelfly QE; PCO Computer Optics, Kelheim, Germany). The photons collected by the catheter are separated into two discrete NIR channels by a 45° dichroic mirror. The images are collected at a variable frame rate—ranging from 1.8 to 33.3 frames per second—that is based on the photon flux. The cameras' outputs are received by a computer that operates a custom-designed software program that displays and stores the two image streams and performs the fluorescence ratio correction algorithm—all in real time (<30 msec).
In Vitro Fluorescence Normalization Experiments
An experimental apparatus identical to the experimental setup modeled in the Monte Carlo simulation was constructed in the following manner: The bottom 1 cm of a 12 × 12-mm plastic cuvette was cut off; a glass microscope slide cover was then glued to the upper part of the cuvette to create a thin transparent base. This upper section was then filled with oxygenated murine blood and placed above the lower section, which was filled with various concentrations of fluorescent dye. Care was taken to ensure that the lower well was fully filled with dye so that there would be no air bubble between the blood chamber and the dye. A 1.6-mm fiberoptic catheter coupled to the described imaging system was then affixed to a translation stage with 0.1-mm precision and suspended in the blood chamber.
All in vitro experimental distance and concentration measurements were performed in triplicate. The dye chamber was first filled with 50 μmol/L Cy5.5, and the fluorescence intensity at 0.5, 1.0, 1.5, and 2.0 mm above the blood-dye interface was measured. This experiment was subsequently repeated by using 50 μmol/L AF750. These data were used to validate the calculations derived from the Monte Carlo simulation described earlier. We measured the fluorescence intensity by averaging the pixel intensities in a region of interest (ROI) that encompassed the catheter image within the fields of view of the cameras; this ROI was determined automatically by using a segmentation algorithm that is part of the imaging system software. The same ROI was used for all measurements.
Because the simulation results suggested that use of the ratio of AF633 signal to AF750 signal yielded the best correction of fluorescence attenuation through blood, we next directly evaluated the variation in this ratio through a volume of blood by using the experimental apparatus. The dye well was filled with different ratios of AF633 and AF750, and the catheter was retracted from 0.1 to 0.8 mm above the blood-dye interface while it simultaneously collected fluorescence from the AF633 and AF750 dyes. This experiment was repeated by using the following four concentration ratios: 10 μmol/L AF633 to 50 μmol/L AF750, 20 μmol/L AF633 to 50 μmol/L AF750, 30 μmol/L AF633 to 50 μmol/L AF750, and 40 μmol/L AF633 to 50 μmol/L AF750. Both the raw AF633 fluorescence and the AF633 fluorescence–AF750 fluorescence ratio were calculated at each distance point, for all four concentrations. In addition, the percentage change from the mean fluorescence across the range of distances through blood was calculated for both fluorochromes and for the fluorochrome ratio to determine whether using the ratio method would lessen the variation in fluorescence signal through a distance of blood. The results of these in vitro experiments were evaluated independently by two authors (R.A.S., U.M.).
In Vivo Intramural Fluorescence Normalization Experiments
All animal experiments were performed according to a protocol approved by our institutional animal care committee. Four female Sprague-Dawley rats (Charles River Laboratories, Wilmington, Mass) were placed in a supine position, and general anesthesia was induced with 2% isoflurane administered at a rate of 1 L of O2 per minute. After the fur was trimmed by using clippers, a single midline incision was made. Abdominal viscera were retracted, and the abdominal aorta was isolated by using blunt dissection. Ten microliters of a mixture of unconjugated AF633 and unconjugated AF750 was then injected into the wall of the aorta, just distal to the renal arteries and formed a small intramural dye cyst. In each of the four animals, three ratios of the AF633-AF750 mixture—1:1, 1:2, and 1:3—as well as a control solution (normal saline with no fluorescent dye), were injected. Proximal and distal vascular control at the catheter insertion site was achieved with vascular clamps, both of which were distal to the dye cyst and proximal to the iliac bifurcation.
We made a nick in the aorta between the clamps by using microsurgical scissors, and a 24-gauge plastic angiocatheter sleeve was introduced through this nick into the aorta and guided in the rostral direction. A 0.4-mm-diameter fiberoptic catheter connected to the described dual-channel fluorescence imaging system was then inserted through the angiocatheter sleeve and into the aorta. The vascular clamps were then removed, and the catheter was advanced until the tip was just adjacent to the collection of dye. Blood loss through the angiocatheter sleeve was minimal because the inner diameter of the sleeve was similar to the outer diameter of the imaging catheter. Fluorescence from the collection of dyes was recorded in the AF633 and AF750 channels, and the intensities of both the raw AF633 signal and the AF633 signal–AF750 signal ratio were calculated for all four concentrations of dye mixtures. Fluorescence intensities were measured by averaging the pixel values in ROIs drawn by one author (R.A.S.) around the areas of fluorescence on the catheter image. After the images were collected, the animals were euthanized. All animals tolerated the procedure well, and there were no deaths due to the surgery or the aorta cannulation procedure. The surgeries were performed by two authors (M.A.M., R.A.S.), and the endovascular imaging data from this experiment were evaluated by one author (R.A.S.).
Dual-Channel Fluorescence Molecular Probe Synthesis
The dual-channel fluorescence molecular probe was synthesized in a manner identical to a previously published method (15). In brief, the constitutively active fluorochrome AF750 was covalently attached to a dextran-coated cross-linked iron oxide nanoparticle (amine-CLIO). Protease-cleavable peptide sequences with the sequence C-G-R-R-R-R-NH2 (Tufts University Peptide Core Facility, Boston, Mass) were then attached to the cross-linked iron oxide scaffold; this peptide sequence was designed to be cleavable with a number of proteases, including the cathepsin family of proteases. Finally, the activatable fluorochrome AF633 was conjugated to this peptide sequence.
In Vivo Imaging of Endovascular Focal Aortic Injury
First, a surgical procedure that caused focal aortic injury was performed in four additional female Sprague-Dawley rats by using a previously validated method (16). The animals were then placed supine and anesthetized with 2% isoflurane administered at a rate of 1 L of O2 per minute. A midline incision was made, abdominal viscera were retracted, and the aorta was isolated by using blunt dissection. A 1.5 × 1.0-cm piece of gauze soaked in 1.0 mol/L CaCl2 was then placed on the aortic surface between the renal arteries and the iliac bifurcation for 15 minutes. After this, the gauze was removed, the abdominal cavity was thoroughly lavaged with warm saline, and the abdomen was closed. Four weeks later, 3.5 mL (1.6 mg of iron per milliliter) of the dual-channel molecular probe was injected through the tail vein. Before the injection, we calculated the baseline inactivated fluorescence ratio for the dual-channel molecular probe by inserting a 0.4-mm imaging catheter into a solution that contained the molecular probe and measuring the intensities of the AF633 and AF750 signals.
Twenty-four hours after the probe was injected, the fluorescence from the site of aortic injury was imaged. First, we accessed the aorta by using a method identical to the earlier described procedure used to image the intramural dye cyst. After we introduced the 0.4-mm imaging catheter into the aorta through the 24-gauge angiocatheter sleeve, we advanced it into the thoracic aorta and slowly retracted it back into the abdominal aorta by using a constant pullback device at 0.5 mm/sec. The thoracic aorta was used as the negative control for vessel wall inflammation because the diaphragm would have restricted the CaCl2 such that it remained in the abdominal cavity and thus protected the thoracic aorta from injury. The fluorescence of AF633 and AF750 from the aortic wall was measured during the pullback, and the AF633 signal–AF750 signal ratio was calculated in real time. We measured fluorescence intensities by averaging the pixel values in ROIs drawn by one author (R.A.S.) around the areas of fluorescence on the catheter image; the same ROI was used for all images acquired in each animal.
After five passes of the imaging catheter through the aorta, each animal was euthanized while in anesthesia by means of cervical dislocation, the abdominal aorta was harvested, and the AF633 and AF750 signals from the specimen were imaged ex vivo by using a commercially available epifluorescence imaging platform (Olympus Small Animal Imaging System OV100; Olympus, Tokyo, Japan). The intravital imaging and ex vivo surface reflectance imaging data were evaluated independently by two authors (R.A.S., U.M.).
Statistical Analyses
Data from the in vitro blood attenuation experiments are presented as means (or percentage changes), plus or minus standard errors (or percentage standard errors), calculated over a constant ROI. The ROI was computationally determined by using the segmentation algorithm that is part of the imaging system in-house written software package (13,14); this algorithm is used to demarcate the catheter image within the field of view of the camera. The same ROI was used for all images acquired in these experiments.
Data from the in vivo intramural fluorescence imaging experiment are presented as means, plus or minus standard deviations, calculated over a constant ROI drawn by one author (R.A.S.) around the area of fluorescence on the catheter image; the same ROI was used for all images acquired in each animal.
Data acquired at in vivo imaging of enzyme activity in the focal aortic injury animal model are means, plus or minus standard deviations, of values for images acquired in one representative animal. The peak fluorescence ratio was averaged across all four animals and compared with the measured fluorescence from the preinjected probe; the widths of the error bars represent standard deviations.
RESULTS
Monte Carlo Simulation
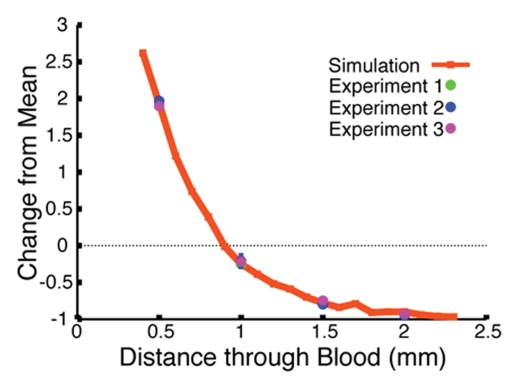
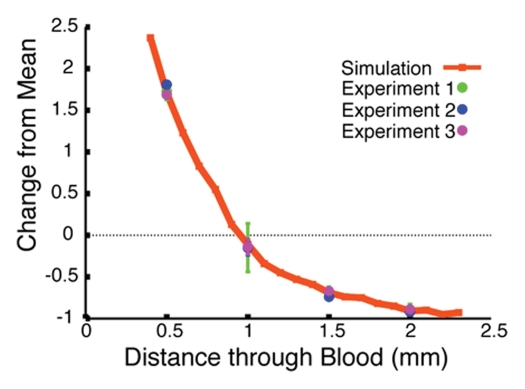
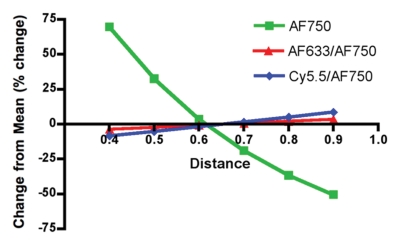
The Monte Carlo simulation was used to predict the effects of retracting the catheter tip from the blood-dye interface on the measured fluorescence signal intensity. We first validated the computer algorithm results by corroborating the calculated attenuation curves with the experimental values for the Cy5.5 and AF750 signals measured through 0.5, 1.0, 1.5, and 2.0 mm of blood. The strong correlation between the experimental and calculated data sets for Cy5.5 and AF750 is illustrated in Figures 2b and 2c, respectively. Having established that the Monte Carlo simulation approximated the experimental design that it was intended to model well, we next applied the simulation to determine which fluorochrome pair yielded the ratio that exhibited the least signal variation through a volume of blood. Two such ratios are illustrated in Figure 2d, with the intensity of the Cy5.5-AF750 fluorochrome pair signal varying ±10% (from 1.16 to 1.27 arbitrary units) and the intensity of the AF633-AF750 signal varying ±3% (from 1.02 to 1.06 arbitrary units) across 1 mm of blood; both ratios yielded a substantial improvement from the ±60% (from 1.37 to 0.81 arbitrary units) variation in signal intensity of the raw AF750 fluorochrome. The results of these in silico experiments revealed that among the evaluated dyes, AF633 and AF750 had the most similar attenuation properties, and, thus, the ratio of these two fluorochromes would be the least variant through blood.
Figure 2a:
Monte Carlo simulation results. (a) Schematic illustration of the simulation design shows 1.6-mm fiberoptic catheter modeled to be suspended in volume of blood, below which is a pool of free fluorescent dye. (b) Graph shows results of validation of Monte Carlo simulation at in vitro experimentation with Cy5.5 dye. The simulation-derived prediction (red line) correlates well with results obtained in three independent in vitro experiments (green, blue, and purple circles), in which fluorescence from a well of Cy5.5 dye was measured through 0.5, 1.0, 1.5, and 2.0 mm of blood. (c) Graph shows results of validation of Monte Carlo simulation at in vitro experimentation with AF750 dye. Similar to results in b, the simulation-derived prediction of the attenuation of AF750 dye fluorescence (red line) correlates well with values derived in three independent experiments (green, blue, and purple circles), in which fluorescence from a well of AF750 dye was measured through 0.5, 1.0, 1.5, and 2.0 mm of blood. (d) Graph shows results of evaluation of ratiometric correction method involving use of different fluorochrome pairs. The simulation was used to evaluate different ratios of dyes and determine the fluorochrome pair with the ratio that exhibited the least signal variation through a volume of blood. Simulation results for two such ratios, Cy5.5-AF750 fluorescence ratio and AF633-AF750 fluorescence ratio, are shown. Compared with Cy5.5-AF750 ratio, AF633-AF750 ratio yielded less signal variation across 1 mm of blood. Simulated variance in raw AF750 signal (green line) is ±60%, whereas variance in corrected AF633-AF750 ratio signal is ±3% over this distance.
Figure 2b:
Monte Carlo simulation results. (a) Schematic illustration of the simulation design shows 1.6-mm fiberoptic catheter modeled to be suspended in volume of blood, below which is a pool of free fluorescent dye. (b) Graph shows results of validation of Monte Carlo simulation at in vitro experimentation with Cy5.5 dye. The simulation-derived prediction (red line) correlates well with results obtained in three independent in vitro experiments (green, blue, and purple circles), in which fluorescence from a well of Cy5.5 dye was measured through 0.5, 1.0, 1.5, and 2.0 mm of blood. (c) Graph shows results of validation of Monte Carlo simulation at in vitro experimentation with AF750 dye. Similar to results in b, the simulation-derived prediction of the attenuation of AF750 dye fluorescence (red line) correlates well with values derived in three independent experiments (green, blue, and purple circles), in which fluorescence from a well of AF750 dye was measured through 0.5, 1.0, 1.5, and 2.0 mm of blood. (d) Graph shows results of evaluation of ratiometric correction method involving use of different fluorochrome pairs. The simulation was used to evaluate different ratios of dyes and determine the fluorochrome pair with the ratio that exhibited the least signal variation through a volume of blood. Simulation results for two such ratios, Cy5.5-AF750 fluorescence ratio and AF633-AF750 fluorescence ratio, are shown. Compared with Cy5.5-AF750 ratio, AF633-AF750 ratio yielded less signal variation across 1 mm of blood. Simulated variance in raw AF750 signal (green line) is ±60%, whereas variance in corrected AF633-AF750 ratio signal is ±3% over this distance.
Figure 2c:
Monte Carlo simulation results. (a) Schematic illustration of the simulation design shows 1.6-mm fiberoptic catheter modeled to be suspended in volume of blood, below which is a pool of free fluorescent dye. (b) Graph shows results of validation of Monte Carlo simulation at in vitro experimentation with Cy5.5 dye. The simulation-derived prediction (red line) correlates well with results obtained in three independent in vitro experiments (green, blue, and purple circles), in which fluorescence from a well of Cy5.5 dye was measured through 0.5, 1.0, 1.5, and 2.0 mm of blood. (c) Graph shows results of validation of Monte Carlo simulation at in vitro experimentation with AF750 dye. Similar to results in b, the simulation-derived prediction of the attenuation of AF750 dye fluorescence (red line) correlates well with values derived in three independent experiments (green, blue, and purple circles), in which fluorescence from a well of AF750 dye was measured through 0.5, 1.0, 1.5, and 2.0 mm of blood. (d) Graph shows results of evaluation of ratiometric correction method involving use of different fluorochrome pairs. The simulation was used to evaluate different ratios of dyes and determine the fluorochrome pair with the ratio that exhibited the least signal variation through a volume of blood. Simulation results for two such ratios, Cy5.5-AF750 fluorescence ratio and AF633-AF750 fluorescence ratio, are shown. Compared with Cy5.5-AF750 ratio, AF633-AF750 ratio yielded less signal variation across 1 mm of blood. Simulated variance in raw AF750 signal (green line) is ±60%, whereas variance in corrected AF633-AF750 ratio signal is ±3% over this distance.
Figure 2d:
Monte Carlo simulation results. (a) Schematic illustration of the simulation design shows 1.6-mm fiberoptic catheter modeled to be suspended in volume of blood, below which is a pool of free fluorescent dye. (b) Graph shows results of validation of Monte Carlo simulation at in vitro experimentation with Cy5.5 dye. The simulation-derived prediction (red line) correlates well with results obtained in three independent in vitro experiments (green, blue, and purple circles), in which fluorescence from a well of Cy5.5 dye was measured through 0.5, 1.0, 1.5, and 2.0 mm of blood. (c) Graph shows results of validation of Monte Carlo simulation at in vitro experimentation with AF750 dye. Similar to results in b, the simulation-derived prediction of the attenuation of AF750 dye fluorescence (red line) correlates well with values derived in three independent experiments (green, blue, and purple circles), in which fluorescence from a well of AF750 dye was measured through 0.5, 1.0, 1.5, and 2.0 mm of blood. (d) Graph shows results of evaluation of ratiometric correction method involving use of different fluorochrome pairs. The simulation was used to evaluate different ratios of dyes and determine the fluorochrome pair with the ratio that exhibited the least signal variation through a volume of blood. Simulation results for two such ratios, Cy5.5-AF750 fluorescence ratio and AF633-AF750 fluorescence ratio, are shown. Compared with Cy5.5-AF750 ratio, AF633-AF750 ratio yielded less signal variation across 1 mm of blood. Simulated variance in raw AF750 signal (green line) is ±60%, whereas variance in corrected AF633-AF750 ratio signal is ±3% over this distance.
In Vitro Fluorescence Normalization
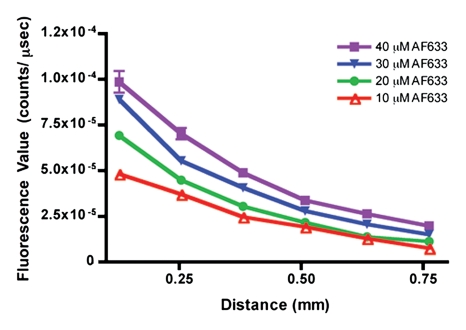
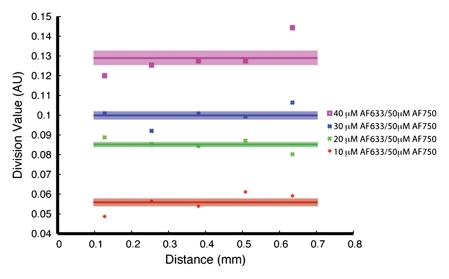
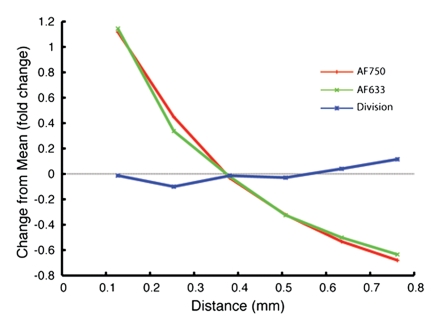
Having predicted with the Monte Carlo simulation that the ratio of AF633 fluorescence to AF750 fluorescence would yield minimal variation across a distance of blood, we sought to verify this result by means of in vitro experimentation. As the graph data in Figure 3a demonstrate, the signal intensities of the four concentrations of AF633 quickly converged on one another as the imaging catheter was retracted through a distance of blood, making it impossible to assign a single fluorochrome concentration to a particular signal intensity. These data affirm the difficulty in quantifying fluorescence through an attenuating medium such as blood. However, normalizing the AF633 curves with the simultaneously generated AF750 fluorescence (Fig 3b) resulted in a marked improvement in variation across the distance of blood and in the uncoupling of the signal intensities of the four concentrations into unique signal intensity ranges. That is, the fluorescence ratio normalization technique enabled us to take into account the attenuating effects of blood on AF633 signal and quantify AF633 fluorescence by separating the signal intensities of the different fluorochrome concentrations into discrete nonoverlapping ranges of signal intensity.
Figure 3a:
In vitro demonstrations of attenuation correction with dual fluorescence normalization technique. (a) Graph data indicate that AF633 fluorescence was substantially attenuated by blood such that the curves representing various dye concentrations quickly converged on one another. (b) Curves for various concentrations of AF633 dye became discrete after AF633 signal was normalized with simultaneously occurring fluorescence measured from constant concentration of AF750 dye. Lines represent mean ratios for the three AF633 concentrations across a given distance in blood. Solid bars represent standard errors. Thus corrected fluorescence intensity enables one to determine the dye concentration, regardless of the distance the photons travel in blood. (c) Graph data indicate that percentage change in mean signal intensity of AF633 fluorescence across a volume of blood is dramatically reduced by means of correction with AF750 fluorescence intensity at the same distance.
Figure 3b:
In vitro demonstrations of attenuation correction with dual fluorescence normalization technique. (a) Graph data indicate that AF633 fluorescence was substantially attenuated by blood such that the curves representing various dye concentrations quickly converged on one another. (b) Curves for various concentrations of AF633 dye became discrete after AF633 signal was normalized with simultaneously occurring fluorescence measured from constant concentration of AF750 dye. Lines represent mean ratios for the three AF633 concentrations across a given distance in blood. Solid bars represent standard errors. Thus corrected fluorescence intensity enables one to determine the dye concentration, regardless of the distance the photons travel in blood. (c) Graph data indicate that percentage change in mean signal intensity of AF633 fluorescence across a volume of blood is dramatically reduced by means of correction with AF750 fluorescence intensity at the same distance.
Figure 3c:
In vitro demonstrations of attenuation correction with dual fluorescence normalization technique. (a) Graph data indicate that AF633 fluorescence was substantially attenuated by blood such that the curves representing various dye concentrations quickly converged on one another. (b) Curves for various concentrations of AF633 dye became discrete after AF633 signal was normalized with simultaneously occurring fluorescence measured from constant concentration of AF750 dye. Lines represent mean ratios for the three AF633 concentrations across a given distance in blood. Solid bars represent standard errors. Thus corrected fluorescence intensity enables one to determine the dye concentration, regardless of the distance the photons travel in blood. (c) Graph data indicate that percentage change in mean signal intensity of AF633 fluorescence across a volume of blood is dramatically reduced by means of correction with AF750 fluorescence intensity at the same distance.
In Vivo Intramural Fluorescence Normalization
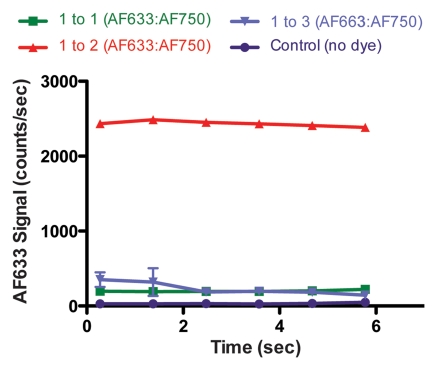
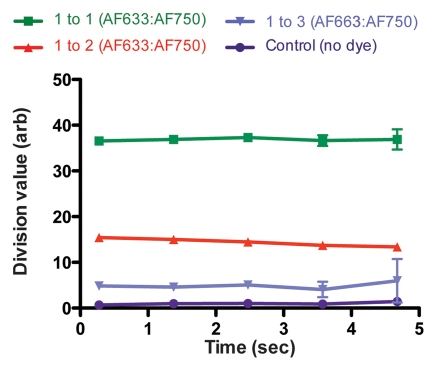
Figure 4a shows the raw fluorescence measured for four concentrations of AF633 in the wall of a rat aorta. The values not only overlapped greatly but also correlated poorly with dye concentration. This effect was probably secondary to variations in the amount of blood and vessel wall tissue intervening between the catheter tip and the dye collection. When the signal intensities for the different ratios were corrected with the AF750 channel (Fig 4b), however, they corresponded to the relative changes in AF633 concentration in a monotonically correct fashion.
Figure 4a:
Graphs show results of in vivo imaging of intramural free dye collections in rat aorta. (a) Raw AF633 signal intensity measured endovascularly from a free dye collection in rat aorta. Owing to variations in blood volume and in thickness of the vessel wall intervening between imaging catheter and dye collection, signal intensities for raw AF633 correlate poorly with concentration of dye. (b) Corrected AF633 signal intensity after division by AF750 fluorescence. After correction with simultaneously acquired AF750 signal, AF633 signal intensity curves exhibit much improved correlation with dye concentration relative to one another. arb = arbitrary units.
Figure 4b:
Graphs show results of in vivo imaging of intramural free dye collections in rat aorta. (a) Raw AF633 signal intensity measured endovascularly from a free dye collection in rat aorta. Owing to variations in blood volume and in thickness of the vessel wall intervening between imaging catheter and dye collection, signal intensities for raw AF633 correlate poorly with concentration of dye. (b) Corrected AF633 signal intensity after division by AF750 fluorescence. After correction with simultaneously acquired AF750 signal, AF633 signal intensity curves exhibit much improved correlation with dye concentration relative to one another. arb = arbitrary units.
In Vivo Endovascular Imaging of Focal Aortic Injury
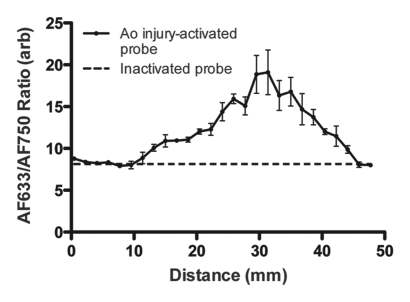
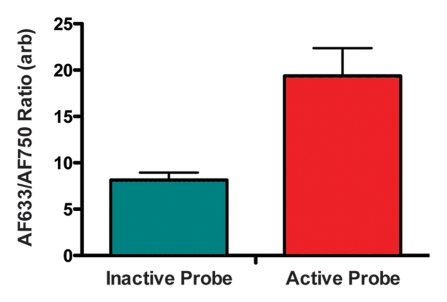
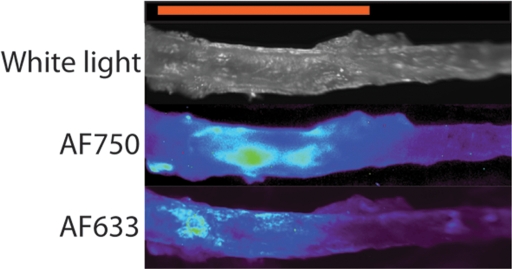
Figure 5a shows a representative fluorescence ratio profile as the catheter tip passes across the area of focal injury. The profile was calculated by averaging data from three passes through one representative rat aorta. The baseline ratio increased to a peak value that was approximately twice that of the baseline. In the recorded ratio profiles from all four animals, the mean peak ratio at the site of injury was approximately twice that of the baseline fluorescence ratio of the inactivated probe (Fig 5b). Findings of surface reflectance imaging of the harvested aortas confirmed the co-localization of AF633 and AF750 signals at the site of the aortic injury, as illustrated in Figure 5c. These data demonstrate that the correction technique enables accurate localization and quantification of vessel wall inflammation, regardless of the attenuating effects of intervening blood.
Figure 5a:
Intramural enzyme activity in focally injured rat aorta, measured in vivo by using dual-channel probe. (a) Graph illustrates fluorescence ratio profile calculated from three catheter imaging passes through representative rat focal aortic (Ao) injury. Peak ratio is approximately twice the peak ratio of inactivated probe. (b) Graph data indicate that intramural enzyme activity was readily detected and quantified by using the ratio technique in all four animals. Peak ratios at site of injury were approximately twice the peak ratio of inactivated probe. (c) Ex vivo catheter images of representative rat aorta show AF633 and AF750 signals from injury site. Red bar at top illustrates extent of area of focal injury. Increased AF750 and AF633 fluorescence is seen at area of focal injury (toward left of image) compared with fluorescence in uninjured area. Fluorescence in AF750 channel, representing signal from constitutively active fluorochrome, reflects local delivery of probe by means of extravasation into inflamed interstitium. Fluorescence in AF633 channel, representing signal from activatable fluorochrome, reflects protease activation of fluorescence. Ratio of the two signals serves as quantitative measure of protease activity that does not vary with blood attenuation effects. arb = arbitrary units.
Figure 5b:
Intramural enzyme activity in focally injured rat aorta, measured in vivo by using dual-channel probe. (a) Graph illustrates fluorescence ratio profile calculated from three catheter imaging passes through representative rat focal aortic (Ao) injury. Peak ratio is approximately twice the peak ratio of inactivated probe. (b) Graph data indicate that intramural enzyme activity was readily detected and quantified by using the ratio technique in all four animals. Peak ratios at site of injury were approximately twice the peak ratio of inactivated probe. (c) Ex vivo catheter images of representative rat aorta show AF633 and AF750 signals from injury site. Red bar at top illustrates extent of area of focal injury. Increased AF750 and AF633 fluorescence is seen at area of focal injury (toward left of image) compared with fluorescence in uninjured area. Fluorescence in AF750 channel, representing signal from constitutively active fluorochrome, reflects local delivery of probe by means of extravasation into inflamed interstitium. Fluorescence in AF633 channel, representing signal from activatable fluorochrome, reflects protease activation of fluorescence. Ratio of the two signals serves as quantitative measure of protease activity that does not vary with blood attenuation effects. arb = arbitrary units.
Figure 5c:
Intramural enzyme activity in focally injured rat aorta, measured in vivo by using dual-channel probe. (a) Graph illustrates fluorescence ratio profile calculated from three catheter imaging passes through representative rat focal aortic (Ao) injury. Peak ratio is approximately twice the peak ratio of inactivated probe. (b) Graph data indicate that intramural enzyme activity was readily detected and quantified by using the ratio technique in all four animals. Peak ratios at site of injury were approximately twice the peak ratio of inactivated probe. (c) Ex vivo catheter images of representative rat aorta show AF633 and AF750 signals from injury site. Red bar at top illustrates extent of area of focal injury. Increased AF750 and AF633 fluorescence is seen at area of focal injury (toward left of image) compared with fluorescence in uninjured area. Fluorescence in AF750 channel, representing signal from constitutively active fluorochrome, reflects local delivery of probe by means of extravasation into inflamed interstitium. Fluorescence in AF633 channel, representing signal from activatable fluorochrome, reflects protease activation of fluorescence. Ratio of the two signals serves as quantitative measure of protease activity that does not vary with blood attenuation effects. arb = arbitrary units.
DISCUSSION
We have described a correction technique that enables one to take into account the NIR fluorescence attenuation caused by blood, and we applied this algorithm to endovascular imaging of inflammatory activity. Our results demonstrate that this method can be used to determine the effect of the attenuation of fluorescence signal through blood. Moreover, it does so in a quantitative, monotonically correct manner, readily facilitating the differentiation of different concentrations of activatable fluorochrome.
We believe that this method, when used in conjunction with a two-fluorochrome, enzyme-activatable molecular probe, has important clinical applications in the measurement of inflammatory activity in vascular disease owing to its utility for quantification of protease activity in the walls of blood vessels. A wide variety of applications are possible; these include evaluation of carotid and coronary arterial atheroscleroses, two vascular diseases in which the inflammation can result in acute plaque rupture. Current clinical imaging modalities such as angiography and intravascular US depict primarily the structural properties of intravascular lesions, but they offer little insight into the underlying inflammatory processes that prompt the formation of these lesions. On the other hand, enzyme-activatable NIR molecular probes are excellent molecular beacons for inflammatory activity; however, without correction for the attenuation of the signal in blood, measurement of the signal of these probes requires a saline flush in the artery to remove the intervening blood between the catheter and the target lesion. Our method renders the saline flush—with its associated complications, including ischemic damage when imaging coronary or carotid arteries—unnecessary for intravascular quantitation of fluorescence.
An important limitation in our study was the fact that the animal model of aortic injury that we used does not cause a compromise in vessel wall integrity. As such, we were unable to directly correlate the measured enzyme activity with the risk of an adverse event such as free wall rupture or vessel occlusion. In future studies, we will focus on applying our correction algorithm to more rigorous animal models that can recapitulate these diseases with greater fidelity.
We believe that the imaging modality described herein is particularly relevant for applications in cardiovascular interventional radiology and can enable the quantification of protease activity in small vessels. As an example, the ability to measure the protease activity within the necrotic core of atherosclerotic plaques in coronary and carotid arteries for assessment of the risk of plaque rupture is an intriguing possibility. A potential limitation of our correction method, however, is its unknown applicability to larger vessels. In our study, we did not explicitly evaluate the capability of the imaging system for quantification of the fluorescence in large vessels, in which the distance between the imaging catheter tip and the vessel wall—and thus the distance through blood that fluorescent photons have to travel—may be on the order of centimeters rather than millimeters. However, because a larger vessel would permit imaging with a larger fiberoptic catheter that has a greater number of fiber bundles and in turn facilitate increased illumination and photon collection, it is plausible to expect the correction algorithm implemented by using our dual-channel imaging system to be extendible to the imaging of disease processes in larger vessels.
We believe that the described method of measuring protease activity represents a useful advance in the detection and quantification of intravascular inflammatory activity. Moreover, because one advantage of working in the optical regime is the ability to readily image multiple fluorochromes, this technology can be expanded to allow simultaneous measurement of multiple molecular signals. For example, with use of the appropriate molecular probe design, it will become feasible to extend the applications of the imaging system to measurement of both enzyme activity and a specific cell surface receptor expression in a diseased vessel wall. This capability raises the possibility of characterizing lesions in a multiparametric fashion and thereby increasing our understanding of the underlying biologic features of lesions and our ability to predict and intervene in the setting of at-risk lesions.
ADVANCES IN KNOWLEDGE
It is possible to quantitate fluorescence through attenuating media such as blood in vivo, in real time, and with high spatial and temporal resolution and thus facilitate endovascular imaging of near-infrared optical molecular probes.
Endovascular measurement of protease activity in the wall of the rat aorta after induced focal aortic injury was performed by using the described normalization algorithm.
Abbreviations
NIR = near infrared
ROI = region of interest
Author contributions: Guarantors of integrity of entire study, R.A.S., M.A.M., U.M.; study concepts/study design or data acquisition or data analysis/interpretation, all authors; manuscript drafting or manuscript revision for important intellectual content, all authors; manuscript final version approval, all authors; literature research, R.A.S., M.A.M., L.J., U.M.; experimental studies, all authors; statistical analysis, R.A.S., M.A.M., U.M.; and manuscript editing, all authors
Authors stated no financial relationship to disclose.
Funding: This research was supported by the National Institutes of Health (grants RO1-EB001872, R24-CA92782).
References
- 1.Lee RT, Libby P. The unstable atheroma. Arterioscler Thromb Vasc Biol 1997;17:1859–1867. [DOI] [PubMed] [Google Scholar]
- 2.Freestone T, Turner RJ, Coady A, Higman DJ, Greenhalgh RM, Powell JT. Inflammation and matrix metalloproteinases in the enlarging abdominal aortic aneurysm. Arterioscler Thromb Vasc Biol 1995;15:1145–1151. [DOI] [PubMed] [Google Scholar]
- 3.Sakalihasan N, Limet R, Defawe OD. Abdominal aortic aneurysm. Lancet 2005;365:1577–1589. [DOI] [PubMed] [Google Scholar]
- 4.Wilson WR, Anderton M, Schwalbe EC, et al. Matrix metalloproteinase-8 and -9 are increased at the site of abdominal aortic aneurysm rupture. Circulation 2006;113:438–445. [DOI] [PubMed] [Google Scholar]
- 5.Nissen SE, Yock P. Intravascular ultrasound: novel pathophysiological insights and current clinical applications. Circulation 2001;103:604–616. [DOI] [PubMed] [Google Scholar]
- 6.Jang IK, Bouma BE, Kang DH, et al. Visualization of coronary atherosclerotic plaques in patients using optical coherence tomography: comparison with intravascular ultrasound. J Am Coll Cardiol 2002;39:604–609. [DOI] [PubMed] [Google Scholar]
- 7.Figueiredo JL, Alencar H, Weissleder R, Mahmood U. Near infrared thoracoscopy of tumoral protease activity for improved detection of peripheral lung cancer. Int J Cancer 2006;118:2672–2677. [DOI] [PubMed] [Google Scholar]
- 8.Funovics MA, Alencar H, Su HS, Khazaie K, Weissleder R, Mahmood U. Miniaturized multichannel near infrared endoscope for mouse imaging. Mol Imaging 2003;2:350–357. [DOI] [PubMed] [Google Scholar]
- 9.Funovics MA, Weissleder R, Mahmood U. Catheter-based in vivo imaging of enzyme activity and gene expression: feasibility study in mice. Radiology 2004;231:659–666. [DOI] [PubMed] [Google Scholar]
- 10.Chen J, Tung CH, Mahmood U, et al. In vivo imaging of proteolytic activity in atherosclerosis. Circulation 2002;105:2766–2771. [DOI] [PubMed] [Google Scholar]
- 11.Prahl SA, Keijzer M, Jacques SL, Welch AJ. A Monte Carlo model of light propagation in tissue. In: Müller GJ, Sliney DH, eds. Proceedings of SPIE: medical imaging 1989. —dosimetry of laser radiation in medicine and biology. Vol IS 5. Bellingham, Wash: International Society for Optical Engineering, 1989; 102–111.
- 12.Friebel M, Roggan A, Muller G, Meinke M. Determination of optical properties of human blood in the spectral range 250 to 1100 nm using Monte Carlo simulations with hematocrit-dependent effective scattering phase functions. J Biomed Opt 2006;11:34021. [DOI] [PubMed] [Google Scholar]
- 13.Sheth RA, Upadhyay R, Weissleder R, Mahmood U. Real-time multichannel imaging framework for endoscopy, catheters, and fixed geometry intraoperative systems. Mol Imaging 2007;6:147–155. [PubMed] [Google Scholar]
- 14.Upadhyay R, Sheth RA, Weissleder R, Mahmood U. Quantitative real-time catheter-based fluorescence molecular imaging in mice. Radiology 2007;245:523–531. [DOI] [PubMed] [Google Scholar]
- 15.Kircher MF, Weissleder R, Josephson L. A dual fluorochrome probe for imaging proteases. Bioconjug Chem 2004;15:242–248. [DOI] [PubMed] [Google Scholar]
- 16.Chiou AC, Chiu B, Pearce WH. Murine aortic aneurysm produced by periarterial application of calcium chloride. J Surg Res 2001;99:371–376. [DOI] [PubMed] [Google Scholar]


