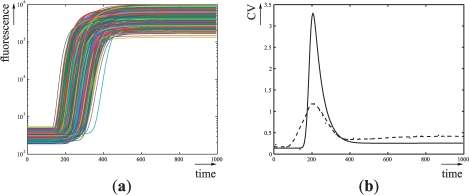
Fig. 6.
Numerical simulations of the ODE model with 5000 log-normally distributed parameters with mean  . (a) Temporal evolution of the fluorescence following addition of aTc. (b) Temporal evolution of the coefficient of variation of the fluorescence. Crosses and solid line represent coefficient of variations obtained from experimental data in Hooshangi et al. (2005) and from numerical simulations, respectively.

