Abstract
Motivation: Classification of gene and protein sequences into homologous families, i.e. sets of sequences that share common ancestry, is an essential step in comparative genomic analyses. This is typically achieved by construction of a sequence homology network, followed by clustering to identify dense subgraphs corresponding to families. Accurate classification of single domain families is now within reach due to major algorithmic advances in remote homology detection and graph clustering. However, classification of multidomain families remains a significant challenge. The presence of the same domain in sequences that do not share common ancestry introduces false edges in the homology network that link unrelated families and stymy clustering algorithms.
Results: Here, we investigate a network-rewiring strategy designed to eliminate edges due to promiscuous domains. We show that this strategy can reduce noise in and restore structure to artificial networks with simulated noise, as well as to the yeast genome homology network. We further evaluate this approach on a hand-curated set of multidomain sequences in mouse and human, and demonstrate that classification using the rewired network delivers dramatic improvement in Precision and Recall, compared with current methods. Families in our test set exhibit a broad range of domain architectures and sequence conservation, demonstrating that our method is flexible, robust and suitable for high-throughput, automated processing of heterogeneous, genome-scale data.
contact: jacobmj@cmu.edu
1 INTRODUCTION
1.1 Family classification
Gene families are the basis of phylogenomic inference (Brown and Sjolander, 2006), and evolution-based methods for function prediction and annotation transfer (Wu et al., 2003). Knowledge of family structure facilitates the study of the processes that drive family evolution (Demuth et al., 2006). Whole genome sequencing efforts have inspired the construction of large-scale gene family databases with the goal of characterizing the full complement of homologous families over a broad range of genomes (Crabtree et al., 2007; Heinicke et al., 2007; Tatusov et al., 2003; Wheeler et al., 2008). These and other genome-scale applications require methods that support accurate, automated and high-throughput family classification.
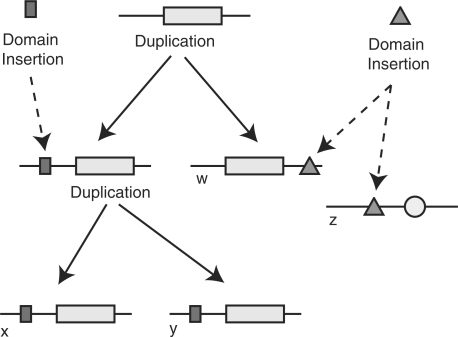
The goal of gene family classification is to partition a set of unlabeled sequences into homologous families (Fitch, 2000), i.e. sets of sequences derived from a common ancestral gene by speciation and gene duplication1. We consider gene family classification, with particular attention to the domain chaining problem: inappropriate merging of unrelated families due to the presence of the same promiscuous domain in sequences belonging to different families (Heger and Holm, 2000). For example, in Figure 1, sequence-based approaches will tend to assign z to the homologous family, { w, x, y }, because genes w and z share a homologous domain. This assignment is incorrect; there is no ancestral genome that contains an entire gene that is ancestral to both w and z.
Fig. 1.
The evolutionary history of a hypothetical multidomain family showing both gene duplications and domain insertions. Genes x, y and w share a common ancestor but do not have identical domain composition. Gene z shares a homologous domain with these genes, but there is no gene that is ancestral to both w and z.
1.1.1 Background
Most approaches to gene family classification represent the sequence universe as a homology network GH=(V,EH) where V is the set of all sequences and (x, y)∈EH, iff x and y are homologous. Homology is a transitive property: if x and y share common ancestry, and y and w share common ancestry, then x and w must also share common ancestry. Consequently, GH is a transitive graph: (x,y)∈EH and (y,w)∈EH→(x,w)∈EH (Rahmann et al., 2007). Otherwise stated, GH is a disjoint union of cliques, in which each clique corresponds exactly to a single gene family.
In practice, however, GH is unknown, and homology is typically estimated using sequence comparison. This yields a graph GS=(V,ES), where ES={(u,v)} such that (u,v)∈V × V has a sequence similarity score better than a given threshold. Since sequence similarity is not a perfect predictor of homology, GS will not, in general, be a transitive graph. Remote homology will result in missing edges, while spurious similarity, convergent evolution and shared promiscuous domains will introduce false edges. As a result, families no longer correspond to cliques or even to disjoint connected components. The typical solution is to apply a graph clustering algorithm to GS to predict families.
Efforts to improve family classification fall into two categories. One strategy is to improve homology prediction to reduce noise (i.e. false and missing edges) in GS (Altschul et al., 1997; Brejova et al., 2003; Buhler et al., 2003; Weston et al., 2004; Zhang et al., 1998). A second approach is development of more sensitive clustering algorithms (Bolten et al., 2001; Enright et al., 2002; Kim and Lee, 2006; Krause et al., 2005; Rahmann et al., 2007; Sasson et al., 2003; Weston et al., 2004; Wittkop et al., 2007). These approaches are interdependent and can be combined. Many clustering algorithms seek specific structural features in graphs, based on the assumption that GS still retains clique-like structures corresponding to families, despite noise. Conversely, better pairwise homology prediction methods will yield a network that better approximates transitivity, and is more amenable to clustering algorithms.
Although major gains have been made in the area of family classification overall, the problem of domain chaining remains largely unaddressed. The lack of a gold standard dataset that includes complex multidomain homologs has been a major obstacle. Most work on homology prediction has focused on the problem of detecting remote homology without inclusion of chance sequence similarity. A few heuristics to eliminate domain chaining have been proposed (Bjorklund et al., 2005; Huynen and Bork, 1998; Song et al., 2007), but due to the lack of a gold standard, the effectiveness of these approaches could not be evaluated. Recent empirical evaluations of clustering methods show that more sophisticated clustering strategies can substantially improve the classification of single domain families (Paccanaro et al., 2006; Wittkop et al., 2007). While these studies did not evaluate clustering performance on multidomain sequences, TribeMCL (Enright et al., 2002), one of the few methods designed with domain chaining in mind, was not a top performer.
In recent, prior work, we hand curated a multidomain benchmark dataset and used it to evaluate the performance of currently used methods for pairwise homology prediction (Song et al., 2008). Our results indicate that for multidomain sequences, sequence comparison results in high error rates, as do heuristics designed specifically to eliminate domain chaining. We further introduced a method, Neighborhood Correlation, that exploits the structure of the sequence similarity network to predict homologs. We demonstrated empirically that Neighborhood Correlation dramatically outperforms other methods for pairwise multidomain homology prediction. However, improved performance on pairwise predictions is not a priori evidence for effective family classification.
1.1.2 Contributions
For family classification, the biological property of interest (sequences that share common ancestry) corresponds to a precise mathematical construct (cliques). This ability to cast the problem in terms of a mathematical objective guides algorithm design (Rahmann et al., 2007; Wittkop et al., 2007); methods that add edges to dense subgraphs and remove edges in sparse regions are promising candidates for family classification. It also suggests graph transitivity and cluster density as measures of performance evaluation in the absence of a gold standard.
In the current work, we show analytically that a network rescoring method based on local graph structure will increase graph transitivity in an unweighted network, provided that it is not too far from a network of cliques. In addition, we simulate a network of cliques with noise and demonstrate that rescoring restores transitivity.
We further evaluate network rescoring on weighted graphs based on biological data. We show that the network structure in the rescored network of mouse and human sequences closely corresponds to families of known common ancestry, yielding a classification with substantial improvements in Precision and Recall compared with sequence similarity. In the yeast network, we show that rescoring improves graph properties associated with high subgraph density, yielding a more compact network well suited to family inference.
Finally, selection of a single threshold that removes spurious edges and adds missing homologous edges, while retaining correct relationships, is a key challenge addressed by our methods. For unweighted networks, we suggest an analytical approach to selecting such a threshold. We further discuss empirical approaches to selecting a threshold in weighted networks. We also demonstrate empirically that the optimal classification threshold for the rescored network is much less sensitive to family history than that of the sequence similarity network.
2 MODEL
The goal of network rescoring is to decrease scores of unrelated pairs and increase scores of related pairs, such that it is possible to select a threshold that separates these two sets. We show here that Neighborhood Correlation (Song et al., 2008), which rescores a network based on its local organization, has this property. Neighborhood Correlation takes a weighted network as input and calculates pairwise scores in the range [−1, 1] between all pairs of nodes. Given a fully connected, weighted network, let wx be the vector of similarity scores between x and all other nodes in the network; i.e. wx[i]=S(x,i), where S(x,i) is the similarity between sequences x and i. We define the Neighborhood Correlation score, NC(x,y), to be the Pearson correlation coefficient between wx and wy. Formally,
| (1) |
where N is the number of sequences in the network, and  is the mean of wx.
Empirical evaluation shows that Neighborhood Correlation exhibits superior performance on the pairwise multidomain homology prediction problem (Song et al., 2008). The effectiveness of Neighborhood Correlation can be understood biologically. Local network structure encodes traces of the evolutionary history of sequences because gene duplication and domain shuffling events impose distinct local organization. Neighborhood Correlation exploits this property to accurately identify family structure.
The performance of Neighborhood Correlation can also be understood mathematically: since gene families correspond to cliques in GH, sequences within a family will have numerous edges to other members of the family, and these relationships can be used to support edges missed by sequence comparison. This intuition suggests that a clique may be resolved from noise so long as a sufficient fraction of homologous edges are retained. Conversely, spurious edges will not be supported by the surrounding local network structure.
Let GS be a network in which the weight of every edge is either zero or one, imposed by selecting edges with a similarity threshold, t. A weighted network GNC is then constructed by rescoring GS with Neighborhood Correlation, using Equation (1), where
| (2) |
Transitivity may be increased by splitting inappropriately linked families. It may also be increased by adding edges that complete cliques. The following examples motivate selection of a threshold that suits both of these interests.
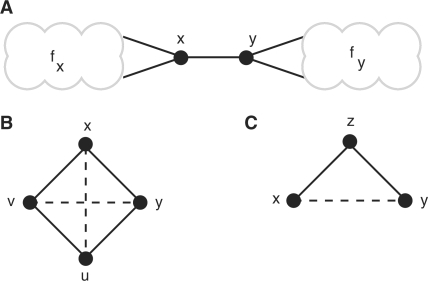
First, an example of two unrelated families linked by a single edge suggests an appropriate threshold. Figure 2A shows a connected component consisting of two subgraphs of size ≥3, corresponding to families fx and fy. Node x is adjacent to at least two nodes in fx (resp. y). As N becomes large, NC(x, y) approaches 0.5. If x has more than two neighbors in its family, then NC(x,y) will decrease further. A threshold of NC>0.5 will eliminate the spurious edge (x,y), correctly splitting the component into two separate families. This suggests that a threshold of 0.5 will separate unrelated families in GNC.
Fig. 2.
Example graph components for intuition. In (A), x and y are members of families fx and fy, respectively, but joined by a single edge. (B) depicts a single family missing two edges, while (C) illustrates a case where edge weights must be used to distinguish between edge addition or deletion.
We next consider whether this threshold is low enough to restore missing edges to a clique. A family of size 4 is shown in Figure 2B. Two additional edges, (x,u) and (v,y), are needed to form a clique. As N becomes large, NC(x,u)=NC(v,y)→0.6, and NC(·,·)→0.8 for all edges already present in the component. With a threshold of NC>0.5, the existing edges will be retained and transitivity is increased by the added edges, completing the clique. In general, for any connected component of size k>3 with at least than k(k−1)/4 edges, more edges will be added with score NC>0.5, yielding a denser component and increasing network transitivity overall. Formalizing these ideas is an interesting direction for future theoretical work. Our interest here is to investigate the practical consequences of these observations for gene family classification.
While the unweighted model is a useful abstraction for theoretical analysis and simulation, a weighted graph based on sequence similarity scores should be used for real data. Consider the example in Figure 2C. If x, y and z represent a family, then a third edge, (x,y) should be added. On the other hand, if, say, x and z form a family of size 2 and y is unrelated, then (z,y) should be removed. In this case, connectivity alone provides no information to make this decision and Neighborhood Correlation can yield no additional confidence. In a weighted graph, S(x,z) and S(z,y) would determine whether the edge should be added or subtracted. Therefore, the information provided by edge weights should be utilized when working with a real sequence similarity network.
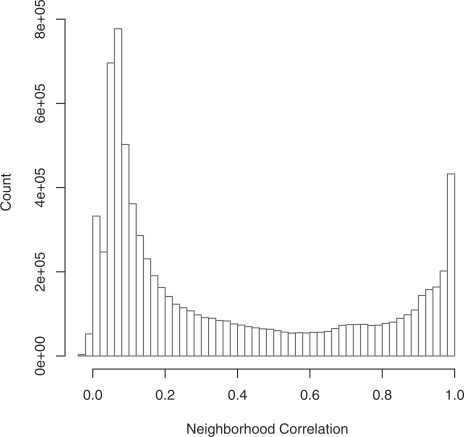
With a weighted graph, it is no longer possible to select a threshold based on simple geometric arguments. In the following section, we demonstrate that the ideal threshold for a network rescored by Neighborhood Correlation is robust, and may be selected more readily than with other leading methods. Several approaches may be used to infer an appropriate classification threshold. As a rule of thumb, a threshold may be selected by plotting a histogram of Neighborhood Correlation scores. With our human and mouse dataset (Fig. 3), and all other datasets we have considered, this histogram is strongly bimodal. The two peaks, one with scores close to 1.0 and the other close to 0.0, are separated by a broad, low trough at intermediate values. Threshold values selected within this trough are robust and accurately partition the network when compared to gold standards. When a more fine-grained approach is desired, a threshold may be selected by optimizing general measures of network transitivity, as below.
Fig. 3.
Histogram of Neighborhood Correlation scores for the mouse and human dataset.
3 RESULTS
We evaluate family classification methods using three different approaches: simulation, comparison with a gold standard and via intrinsic measures based on graph transitivity.The most relevant test is comparison of predicted families with known families, when a gold standard is available. We use curated families in mouse and human for this analysis. When a gold standard is not available, family classification can be evaluated using intrinsic measures. Since homology is an intrinsically transitive property, the extent to which G approximates a network of cliques is a measure of classification performance. Clustering coefficient and average component density are two measures that assay this property. We use this approach in yeast, for which no gold standard is available. Finally, we use simulation to evaluate the ability of our methods to restore transitivity a network of cliques degraded by noise. With simulation, the true homology network is known and it is possible to control parameters of interest (e.g. clique size, clique number, the number of false and missing edges).
All three analyses begin with a graph, GS that corresponds to a transitive homology graph, GH, perturbed by noise. Every pair of nodes (u,v)∈V × V is rescored using Neighborhood Correlation to obtain a rewired graph, GNC=(V,ENC).
3.1 Validation Metrics
For our application, where homologous gene families correspond to cliques, figures of merit that assess the transitivity of a graph are appropriate internal validation methods. We use two metrics to evaluate how well a graph approximates a set of isolated cliques: the mean clustering coefficient, C, which reflects local transitivity, and the graph component density, D, a measure of global transitivity.
The clustering coefficient for a single node i, of degree ki≥2, is
| (3) |
where Vi is set of nodes adjacent to i. Ci is the edge density of the subgraph, Vi. It reflects the degree to which the neighbors j and k, of a node i, are connected to each other. The graph clustering coefficient, C, is the mean Ci over all nodes, and is an average measure of local density. C(G)=1 iff G is transitive.
The component density of a graph is the weighted average of the density of individual components or
| (4) |
where dc=2Ec/(Lc(Lc−1)) is the density of component c, with Lc nodes. D(G)=1 iff G is transitive. Note that D is equivalent to the ratio of the total number of edges in G to the number of possible edges within components. Given graphs GS=(V,ES) and GNC=(V,ENC) of equivalent total density (|ES|=|ENC|), the graph with the highest component density most closely approximates a transitive graph.
Both C and D increase with transitivity, reaching unity in a fully transitive graph. Although, in general, high values of C(GS) and D(GS) are evidence that GS closely approximates GH, these measures can be misleading in extremely dense or sparse graphs. In a graph consisting of one, or a very small number, of dense connected components, both C and D will be close to one. However, this is not a realistic gene family model. At the other end of the spectrum, D will be unity in a graph consisting entirely of components of size 2, but these, again, are not typical of gene families in real data. Moreover, the clustering coefficient is not informative for very sparse graphs, since C is not defined on connected components of size 2. To ensure that the graphs obtained are not near these extremes, we consider the number of connected components. In the simulated data, where the exact number of cliques in GH is known, we also verify that we recover the correct number of connected components.
In the analyses of simulation and yeast data, relative transitivity is assessed by comparing the values of C and D for GS and GNC. These values depend on the choice of edge weight threshold used to sever edges in the graph. To obtain a fair comparison, we select thresholds in GS and GNC to obtain graphs with the same graph density. Graph density is a suitable basis for normalization, because D is directly, and C is indirectly, dependent on overall graph density. In the simulation analysis, the density of GS is implicitly controlled by the noise model, which, by design, constructs GS with the same density as GH, in expectation. A Neighborhood Correlation score threshold is then explicitly selected to ensure that GNC also has the same density. In the yeast studies, the Neighborhood Correlation threshold is treated as an independent variable. For each Neighborhood Correlation threshold considered, the sequence similarity threshold is selected to obtain a graph, GS with the same density as GNC.
Neighborhood Correlation performance was also assessed on a curated set of mouse and human families (Song et al., 2008). This test set was derived from the set of all 26 197 full length, mouse and human amino acid sequences derived from the SwissProt (version 50.9) database. Twenty families with evidence of common ancestry were considered, including 1577 sequences in all. This set is based on a synthesis of over 70 publications by experts on specific families. The selected families represent seven single domain families, five families of conserved multidomain architecture and eight families of variable architecture. These families also represent a range of sequence conservation. Highly divergent single-domain families, such as the tumor necrosis factors (TNFs) and ubiquitin-specific proteases (USPs), were included to test the performance on remote homology prediction. Details of the family curation procedure are given in (Song et al., 2008).
3.2 Simulation
In simulation studies, we construct an artificial graph GH consisting of a disjoint set of cliques to represent families. GS is derived from GH by simulating missing and spurious edges that arise from faulty homology prediction. Edges within cliques of GH are selected for deletion with probability pd. Edges not in GH are selected for addition with probability pa, where pa is selected such that the expected total density of GS is equal to the density of GH.
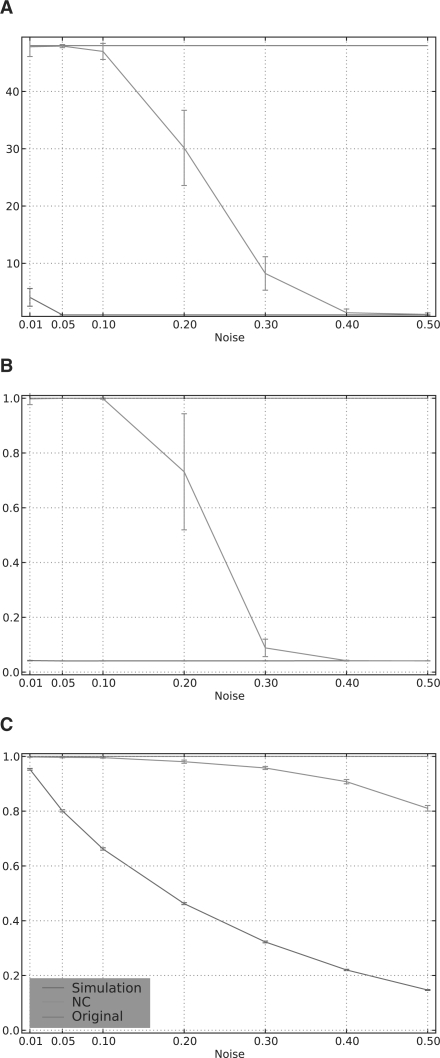
We considered networks with cliques of varying sizes, because small cliques are more sensitive to noise than large cliques due to the difference in ‘redundant’ connections within the clique. Figure 4 shows an analysis of a network of 48 cliques: 16 cliques of size 4, and 8 each of sizes 8, 16, 32 and 64. The choice of these parameters was guided by the observed family sizes in our curated mouse and human families. The results obtained for other conformations were similar (data not shown).
Fig. 4.
Component and transitivity measures of simulated networks of cliques degraded by noise; (A) connected component count, (B) component density and (C) mean clustering coefficient. Error bars indicate 1 SD over 100 randomization trials.
Figure 4 illustrates that a very small number of mis-assigned edges is sufficient to completely disrupt this family structure, as shown by the low values of both C(GS) and D(GS). In contrast, Neighborhood Correlation is able to completely recover this structure, when pd≤0.1. In addition, GNC almost always has 48 components, the same number as GH. This is a strong evidence to show that Neighborhood Correlation is able to perfectly reconstruct GH at low error rates. Performance begins to degrade as noise increases. However, even with pd as high as 0.2, Neighborhood Correlation is still able to reconstruct more than half of the components and C(GNC) remains >0.8 for the entire range, 0 ≤pd≤0.5.
3.3 Mouse and Human
After considering the utility of Neighborhood Correlation on simulated data where the true graph GH is known, we now turn to real data. A weighted sequence similarity network, GS, was constructed using all-against-all BLAST (version 2.2.15, default parameters) comparison of the full set of 26 197 mouse and human amino acid sequences in our dataset. A significance E-value corresponding to 10 matches per sequence was used. A weighted network, GNC, was constructed from GS by calculating Neighborhood Correlation scores using Equation (1), where
| (5) |
S(x,i) is the normalized bit score (Altschul et al., 1997), and Smin is fixed to 95% of the smallest bit score satisfying E=10.
Families were predicted from both GS and GNC by applying each of three simple agglomerative clustering variants: single, complete and average linkage. Non-overlapping clusters are obtained by cutting the agglomerative tree at a particular threshold.
The quality of clustering is evaluated by the correspondence between families and clusters. Given a family i and a cluster j, the Precision, Pij, is the fraction of elements in j that are members of family i. Similarly, the recall, Rij, is the fraction of members of family i that are found in cluster j. F, the harmonic mean of Precision and Recall, reflects the quality of both Precision and Recall simultaneously:
| (6) |
Classification performance on each family was determined using a family-specific F-measure: Fi=∑j ni,jFi,j/ni, where ni,j is the number of members of family i in cluster j and ni is the number of sequences in the entire family. The family-specific F-measure captures the classification quality on individual families, but does not reflect performance on a mix of sequences from families with varied conservation and architecture. To test classification on heterogeneous data, we also calculated the F-measure on sequences from all families combined (ALL) using the weighted average F=∑i,j ni,jFi,j/n, where n=∑i ni. One family, the kinases, is much larger than the others. To avoid bias, we also calculated F for the set of all sequences except the Kinases (ALL-kin).
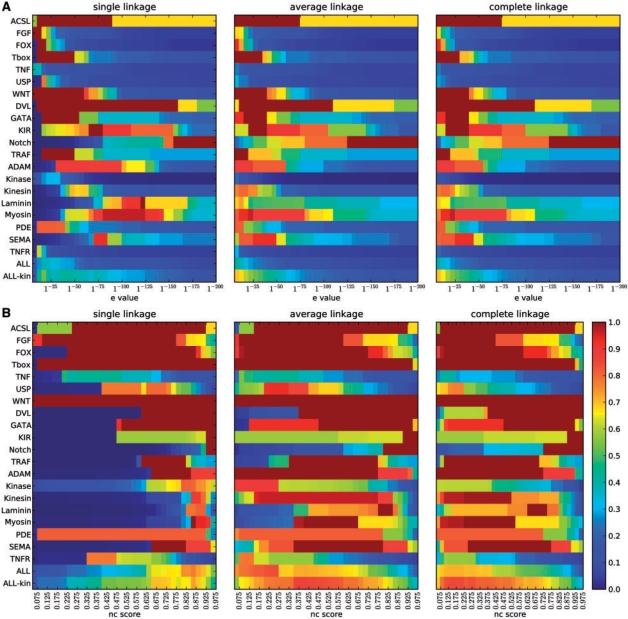
We evaluated classification performance of both GS (Fig. 5A) and GNC (Fig. 5B), for all possible thresholds. Families are grouped by domain architecture: first, single domain families; then, multidomain families with conserved architectures, followed by families with variable architectures. Classification performance is expressed as a heatmap of the F-measure, where F=1 (red) is optimal, and F=0 (blue) is the worst possible clustering quality.
Fig. 5.
Evaluation of clustering performance of sequence similarity (A) and Neighborhood Correlation (B) on 20 curated families in mouse and human. This heatmap illustrates F-measure, where good performance (F=1) is red and low (F=0) is blue, for single-, average-, and complete-linkage agglomerative clustering. Families are ordered by domain structure, where ACSL-WNT are single domain, DVL-TRAF have conserved multidomain architectures and ADAM-TNFR have variable architectures. ALL and ALL-kin depict weighted averages over the full set, and the set excluding Kinase, respectively.
It is immediately clear from inspection of Figure 5 that a much better classification can be obtained using the rewired network: the Figure 5A is mostly blue; Figure 5B is mostly red. Near perfect classification of single domain families, with the exception of TNF and USP, can be obtained using either of the scoring systems. Similar behavior is seen with multidomain families with conserved architectures: good classifications can be achieved by either of the methods, although the optimal classification threshold varies substantially from family to family. In contrast, classification with the rewired network shows a dramatic improvement over sequence similarity for families with variable architectures. Classification of TNF and USP, families with low sequence conservation, is also much improved in the rewired network, showing that rewiring restores missing edges due to remote homology, as well as removing edges due to domain chaining.
Comparison of the performance of GS and GNC on the ALL and ALL-kin datasets reveals that sequence similarity scores are much more family-specific than Neighborhood Correlation scores. The poor performance of single-linkage clustering on GS implies that no threshold can give good performance for most families, a fundamental obstacle to obtaining good classifications on heterogeneous data using sequence similarity. Neighborhood Correlation obtains much better performance on these aggregate datasets: the best performance of the rewired network (Fmax=0.85, avg. linkage) is substantially greater than that of sequence similarity (Fmax=0.42, avg. linkage). This suggests that rewiring is of particular importance for automated, genome-scale analyses.
Since the single-linkage metric simply generates connected components for a particular threshold, comparison of the single-linkage heatmaps for GS and GNC reveals the benefit of rewiring alone, without additional clustering. Neighborhood Correlation rewiring increases transitivity and results in connected components that more closely approximate true families. Both average and complete linkage further improve the classification obtained from GNC, suggesting that Neighborhood Correlation not only increases graph transitivity, but also that rewiring as a pre-processing step is a promising approach for better classification. Interestingly, neither average- nor complete-linkage much improves performance with GS.
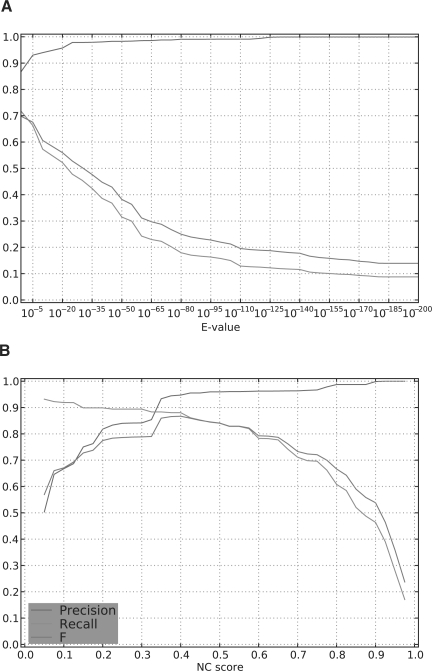
The F-measure captures overall classification performance, but does not detail the tradeoff between Precision and Recall. Figure 6 shows the F, Precision and Recall attained with average linkage for GS and GNC on the ALL-kin dataset. On this dataset, sequence similarity can obtain near perfect Precision, but at a cost of missing roughly half of all true positives. In contrast, classification with Neighborhood Correlation delivers both Precision and Recall >80% for Neighborhood Correlation scores ranging from 0.2 to 0.6.
Fig. 6.
F-measure, Precision and Recall of the ALL-kin dataset, for (A) sequence similarity, and (B) Neighborhood Correlation, after average-linkage clustering.
3.4 Yeast
In a third analysis, we considered how Neighborhood Correlation influences graph properties in the yeast network. We also investigated whether it is beneficial to use additional sequence data when calculating Neighborhood Correlation scores. Since NC(x,y) effectively compares the relationship between x and other sequences with the relationship between y and other sequences, we hypothesized that using additional sequences to calculate Neighborhood Correlation would improve its accuracy.
All 46 060 amino acid sequences from nine yeast genomes were obtained from the YGOB, version 2 database (Byrne and Wolfe, 2005). All-against-all BLAST comparisons were carried out on the set of all genes in Saccharomyces cerevisiae alone; in four genomes (S.cerevisiae, Candida glabrata, Ashbya gossypii, and Kluyveromyces lactis); and in all nine genomes in YGOB2. Neighborhood Correlation scores were then calculated for all pairs in each of these three datasets. From these, we extracted three sequence similarity networks (GS−1, GS−4 and GS−9) and three Neighborhood Correlation networks (GNC−1, GNC−4 and GNC−9) for S.cerevisiae only; that is, in two of these, multiple genomes were used to calculate the edge weights, but we consider only edges in GS and GNC between nodes of the 5616 S.cerevisiae genes in this analysis.
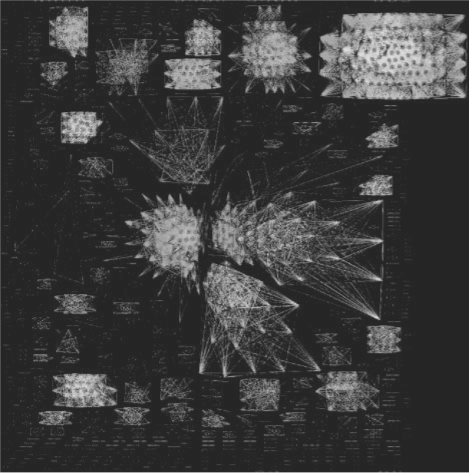
We constructed a visual representation of the GNC network with a force-based layout calculated with Neato (Emden R. Gansner and Stephen C. North, 1999). Figure 7 shows that Neighborhood Correlation breaks the network into disjoint components. Many of these are cliques. Unfortunately, no rigorously curated gold standard for evolutionary families is available in yeast. However, visual inspection revealed that many of these components correspond to groups of genes that are commonly considered as families. For example, actin and the seven actin-related proteins (ARPs) form an isolated clique and the large cluster in the upper right hand corner corresponds to the kinases. This well-defined component structure was not observed in a similar visual representation constructed from the sequence similarity network (GS) (data not shown).
Fig. 7.
Visualization of the S.cerevisiae genome after rescoring with Neighborhood Correlation. Edge color signifies the Neighborhood Correlation score, where gray indicates NC≥0.3, violet ≥0.4, green ≥0.6, orange ≥0.8, and yellow ≥0.9. The dense component at top right contains all kinases. Singleton nodes have been omitted for clarity.
In the absence of a gold standard, we evaluate the ability of Neighborhood Correlation to restore transitivity in the yeast network using the same network measures used in the simulation analysis, shown in Figure 8. The Neighborhood Correlation and sequence similarity axes are aligned such that graph density is constant for NC ≥ 0.15.
Fig. 8.
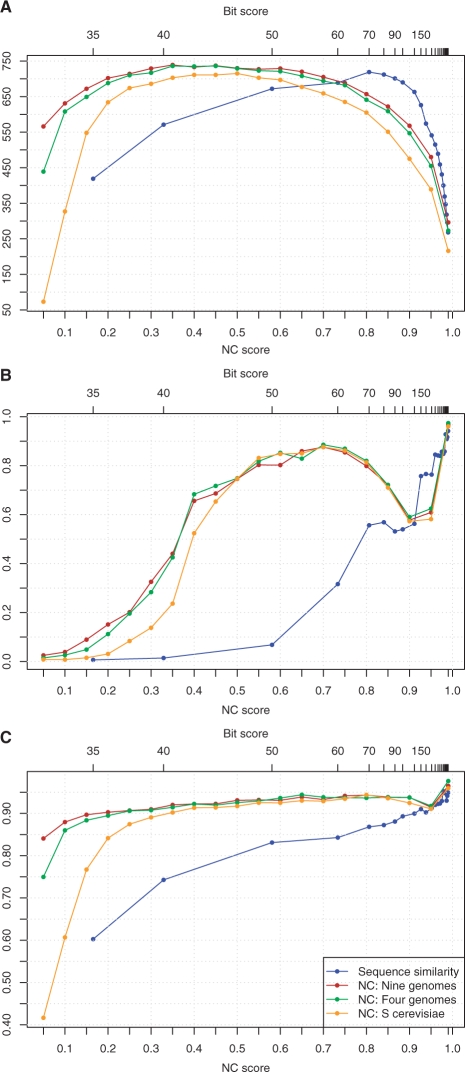
Component and transitivity measures of the network of S.cerevisiae genes for sequence similarity, and Neighborhood Correlation calculated with one, four and nine yeast genomes: (A) connected component count, (B) component density and (C) mean clustering coefficient.
The clustering coefficient (Fig. 8C) is consistently higher in GNC than in GS. This demonstrates higher local density for components of size ≥ 3. Similarly, component density (Fig. 8B) is consistently higher for Neighborhood Correlation than for sequence similarity up to thresholds of NC ≥ 0.9. Taken together, these measures show that in yeast, as in mammalian and simulated networks, Neighborhood Correlation restores transitivity. For all but the highest thresholds, components in GS are larger and sparser than in GNC. This occurs because multiple families are merged into single components in GS, yet failure to recognize remote homology keeps these components sparse.
The component density of GNC decreases markedly between thresholds of 0.75 and 0.9. First,∼10% of components of size 2 break up into singletons in this range. Since the density of a two-node component is one, loss of such pairs will substantially reduce the average value of D(G). In addition, large components become sparser as the threshold becomes more stringent. For example, the largest component in the network in this range (the Kinases), decreases in density from 0.85 to 0.33. At very high stringencies, both networks consist almost entirely of singletons, two-node components and a few very small cliques of size ≥ 3, leading to values of C(G) and D(G) close to one.
The number of components (Fig. 8A) increases from few very weakly connected components at very lenient thresholds to a larger number at more stringent thresholds in both GNC and GS. In GNC, the component count is stable for thresholds roughly from 0.3 to 0.7, illustrating the robustness of Neighborhood Correlation. GS has fewer components at comparable thresholds up to 0.7. Again, this is probably due to larger components containing members of more than one family. At higher thresholds, the number of components decreases in both graphs as components are broken up into singletons, which are not included in the component count.
Comparison of GNC−1, GNC−4 and GNC−9 shows that including more genomes in the calculation of Neighborhood Correlation further increases transitivity. It is reassuring to note that while the clustering coefficient and component density are higher with more genomes, the overall trends are unaffected. Moreover, the differences between GNC−1, GNC−4 and GNC−9 are smaller than the differences between GNC and GS except at very low thresholds.
4 DISCUSSION
Despite advances in gene family classification, classification of multidomain families remains an open problem. Whereas true homology forms a set of disjoint cliques, domain chaining introduces false edges that degrade transitivity. We show empirically through simulation and with real biological data that Neighborhood Correlation captures homology and restores transitivity to the sequence similarity network. From networks degraded by considerable noise, Neighborhood Correlation recovers network clique structure typical of the structure of gene families evolved through vertical descent. When studied from an analytical standpoint, examination of simple graph structures that reflect expected family structure suggest that this is an inherent mathematical property of Neighborhood Correlation. Formalization of this intuition is an interesting area for future development.
In addition to improving transitivity overall, we empirically verify that dense subgraphs in the Neighborhood Correlation graph correspond to known homologous families in the mouse and human genomes. Moreover, because Neighborhood Correlation effectively normalizes scores across families, good quality classification can be achieved with a single threshold for all families.
Families in the network rescored by Neighborhood Correlation are correctly represented as disjoint components, suggesting that Neighborhood Correlation ameliorates the domain chaining problem and captures remote homology.
The application of hierarchical clustering to the rescored network improves performance further. This suggests that while Neighborhood Correlation better estimates homology than sequence similarity, it can also be a useful pre-processing step to more sophisticated clustering algorithms that consider network structure. Empirical evaluation of clustering algorithms on curated multidomain data is a useful direction for future work.
Many family classification methods have been shown to work when validated with single domain sequences, domain models, structural similarity and functional data, though it is important to recognize that none of these explicitly test evolutionary relationship, and all are ill-suited to evaluating the question of homology. Use of such validation is partly due to a lack of available curated datasets. We provide our curation dataset for use by others, at http://www.neighborhoodcorrelation.org.
ACKNOWLEDGEMENTS
We thank N. Song for helpful discussions.
Funding: NSF (grant DBI-0641313); NIH (grant GM-071508), a Pittsburgh Supercomputing Center; David and Lucille Packard Foundation fellowship.
Conflict of Interest: none declared.
Footnotes
1Note that this is distinct from orthology, in which only sequences related through speciation are considered.
REFERENCES
- Altschul S, et al. Gapped BLAST and PSI-BLAST: a new generation of protein database search programs. Nucleic Acids Res. 1997;25:3389–3402. doi: 10.1093/nar/25.17.3389. [DOI] [PMC free article] [PubMed] [Google Scholar]
- Bolten E, et al. Clustering protein sequences—structure prediction by transitive homology. Bioinformatics. 2001;17:935–941. doi: 10.1093/bioinformatics/17.10.935. [DOI] [PubMed] [Google Scholar]
- Bjorklund A, et al. Domain rearrangements in protein evolution. J. Mol. Biol. 2005;353:911–923. doi: 10.1016/j.jmb.2005.08.067. [DOI] [PubMed] [Google Scholar]
- Brejova B, et al. Optimal spaced seeds for homologous coding regions. In: Baeza-YatesR., et al., editors. Proceedings of Symposium on Combinatorial Pattern Matching (CPM'03) 2676 of Lecture Notes in Computer Science. Morelia, Mexico: Springer; 2003. pp. 42–54. [Google Scholar]
- Brown D, Sjolander K. Functional classification using phylogenomic inference. PLoS Comput. Biol. 2006;2:479–483. doi: 10.1371/journal.pcbi.0020077. [DOI] [PMC free article] [PubMed] [Google Scholar]
- Buhler J, et al. Designing seeds for similarity search in genomic DNA. In: Vingron M, et al., editors. RECOMB'03: Proceedings of the Seventh Annual International Conference on Research in Computational Molecular Biology. ACM Press; 2003. pp. 67–75. [Google Scholar]
- Byrne KP, Wolfe K. The Yeast Gene Order Browser: combining curated homology and syntenic context reveals gene fate in polyploid species. Genome Res. 2005;15:1456–1461. doi: 10.1101/gr.3672305. [DOI] [PMC free article] [PubMed] [Google Scholar]
- Crabtree J, et al. Sybil: methods and software for multiple genome comparison and visualization. Methods Mol. Biol. 2007;408:93–108. doi: 10.1007/978-1-59745-547-3_6. [DOI] [PubMed] [Google Scholar]
- Demuth J, et al. The evolution of mammalian gene families. PLoS ONE. 2006;1:e85. doi: 10.1371/journal.pone.0000085. [DOI] [PMC free article] [PubMed] [Google Scholar]
- Emden RGansner, Stephen CNorth. An open graph visualization system and its applications. Software Pract. and Exper. 1999;30:1203–1233. [Google Scholar]
- Enright A, et al. An efficient algorithm for large-scale detection of protein families. Nucleic Acids Res. 2002;30:1575–1584. doi: 10.1093/nar/30.7.1575. [DOI] [PMC free article] [PubMed] [Google Scholar]
- Fitch W. Homology: a personal view on some of the problems. Trends Genet. 2000;16:227–231. doi: 10.1016/s0168-9525(00)02005-9. [DOI] [PubMed] [Google Scholar]
- Heger A, Holm L. Towards a covering set of protein family profiles. Prog. Biophys. Mol. Biol. 2000;73:321–337. doi: 10.1016/s0079-6107(00)00013-4. [DOI] [PubMed] [Google Scholar]
- Heinicke S, et al. The princeton protein orthology database (P-POD): a comparative genomics analysis tool for biologists. PLoS ONE. 2007;2:e766. doi: 10.1371/journal.pone.0000766. [DOI] [PMC free article] [PubMed] [Google Scholar]
- Huynen M, Bork P. Measuring genome evolution. Proc. Natl Acad. Sci. USA. 1998;95:5849–5856. doi: 10.1073/pnas.95.11.5849. [DOI] [PMC free article] [PubMed] [Google Scholar]
- Kim S, Lee J. Bag: a graph theoretic sequence clustering algorithm. Int. J. Data Min. Bioinform. 2006;1 doi: 10.1504/ijdmb.2006.010855. [DOI] [PubMed] [Google Scholar]
- Krause A, et al. Large scale hierarchical clustering of protein sequences. BMC Bioinformatics. 2005;6:15. doi: 10.1186/1471-2105-6-15. [DOI] [PMC free article] [PubMed] [Google Scholar]
- Paccanaro A, et al. Spectral clustering of protein sequences. Nucleic Acids Res. 2006;34:1571–1580. doi: 10.1093/nar/gkj515. [DOI] [PMC free article] [PubMed] [Google Scholar]
- Rahmann S, et al. Exact and heuristic algorithms for weighted cluster editing. Comput. Syst. Bioinformatics Conf. 2007;6:391–401. [PubMed] [Google Scholar]
- Sasson O, et al. ProtoNet: hierarchical classification of the protein space. Nucleic Acids Res. 2003;31:348–352. doi: 10.1093/nar/gkg096. [DOI] [PMC free article] [PubMed] [Google Scholar]
- Song N, et al. Domain architecture comparison for multidomain homology identification. J. Comput. Biol. 2007;14:496–516. doi: 10.1089/cmb.2007.A009. [DOI] [PubMed] [Google Scholar]
- Song N, et al. Sequence similarity network reveals common ancestry of multidomain proteins. PLoS. Comput. Biol. 2008;4:e1000063. doi: 10.1371/journal.pcbi.1000063. [DOI] [PMC free article] [PubMed] [Google Scholar]
- Tatusov R, et al. The COG database: an updated version includes eukaryotes. BMC Bioinformatics. 2003;4:41. doi: 10.1186/1471-2105-4-41. [DOI] [PMC free article] [PubMed] [Google Scholar]
- Weston J, et al. Protein ranking: from local to global structure in the protein similarity network. Proc. Natl Acad. Sci. 2004;101:6559–6563. doi: 10.1073/pnas.0308067101. [DOI] [PMC free article] [PubMed] [Google Scholar]
- Wheeler DL, et al. Database resources of the National Center for Biotechnology Information. Nucleic Acids Res. 2008;36:D13–D21. doi: 10.1093/nar/gkm1000. [DOI] [PMC free article] [PubMed] [Google Scholar]
- Wittkop T, et al. Large scale clustering of protein sequences with FORCE -a layout based heuristic for weighted cluster editing. BMC Bioinformatics. 2007;8:396. doi: 10.1186/1471-2105-8-396. [DOI] [PMC free article] [PubMed] [Google Scholar]
- Wu C, et al. Protein family classification and functional annotation. Comput. Biol. Chem. 2003;27:37–47. doi: 10.1016/s1476-9271(02)00098-1. [DOI] [PubMed] [Google Scholar]
- Zhang Z, et al. Protein sequence similarity searches using patterns as seeds. Nucleic Acids Res. 1998;26:3986–3990. doi: 10.1093/nar/26.17.3986. [DOI] [PMC free article] [PubMed] [Google Scholar]


