Abstract
Motivation: G-quadruplexes are stable four-stranded guanine-rich structures that can form in DNA and RNA. They are an important component of human telomeres and play a role in the regulation of transcription and translation. The biological significance of a G-quadruplex is crucially linked with its thermodynamic stability. Hence the prediction of G-quadruplex stability is of vital interest.
Results: In this article, we present a novel Bayesian prediction framework based on Gaussian process regression to determine the thermodynamic stability of previously unmeasured G-quadruplexes from the sequence information alone. We benchmark our approach on a large G-quadruplex dataset and compare our method to alternative approaches. Furthermore, we propose an active learning procedure which can be used to iteratively acquire data in an optimal fashion. Lastly, we demonstrate the usefulness of our procedure on a genome-wide study of quadruplexes in the human genome.
Availability: A data table with the training sequences is available as supplementary material. Source code is available online at http://www.inference.phy.cam.ac.uk/os252/projects/quadruplexes
Contact: os252@cam.ac.uk; jlh29@cam.ac.uk
Supplementary information: Supplementary data are available at Bioinformatics online.
1 INTRODUCTION
Understanding biological sequences and predicting the functional elements they determine are widely studied themes in computational biology. Examples of well-established problems are gene finding and the prediction of protein structure from its amino acid sequence. Computational methods addressing such challenges helped to gain insights into interesting biological phenomenon. However, other information encoded in the DNA sequence remains to be explored.
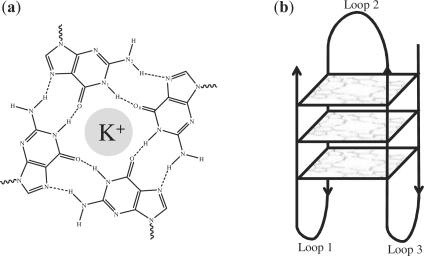
Recently, it has been found that particular G-rich DNA (and RNA) sequences are capable of forming stable four-stranded structures known as G-quadruplexes (Burge et al., 2006; Huppert, 2008; Neidle and Balasubramanian, 2006). G-quadruplexes have been shown to be relevant in a number of biological processes (Patel et al., 2007). They are an important component of human telomeres (Oganesian and Bryan, 2007), and play a role in regulation of transcription (Qin and Hurley, 2008; Siddiqui-Jain et al., 2002) as well as translation (Kumari et al., 2007). Structurally, intramolecular G-quadruplexes consist of a square arrangement of four guanines (a tetrad) in a planar hydrogen bonded form. At the centre of the tetrads is a monovalent cation, e.g. K+, that further stabilizes the structure. The core guanines are linked by three nucleic acid sequences (loops) of varying composition and topology. Figure 1 shows a schematic picture of a G-quadruplex together with the hydrogen bond pattern.
Fig. 1.
(a) Hydrogen bond pattern in a G-tetrad. A monovalent cation occupies the central position. (b) Schematic diagram of an intramolecular G-quadruplex, with three G-stacks.
An obvious challenge is to predict which sequences will form these G-quadruplexes. A necessary condition for G-quadruplex formation is the presence of core guanines and loop sequences. These basic requirements can be used to identify putative G-quadruplexes using a simple pattern-based rule, matching sequences of the form
| (1) |
where GNG are the guanine cores that can occur with different numbers of G-stacks, NG=2, 3, 4. The symbol N denotes any nucleotide. The loop sequences (L1, L2, L3) have varying length, where NL=7 is a typical choice for the maximum length. For very long loops, G-quadruplexes are unlikely to form as their stability decays with the total sequence length (Bugaut and Balasubramanian, 2008; Hazel et al., 2004). Similar rules have been widely used in the literature e.g.(Huppert and Balasubramanian, 2005) and demonstrated to work well in practice. However, they are not exhaustive, for example some structures with much longer loops can be formed (Bourdoncle et al., 2006). The most important limitation of pattern-based sequence rules is that they do not predict the thermodynamic stability, a key property of the G-quadruplex. In order for the G-quadruplex to have a biologically meaningful role, it needs to be stable enough to form a structure at body temperature. Furthermore, it has been speculated that G-quadruplexes that are metastable at body temperature carry the most significant role, as their influence on transcriptional processes can be active or inactive depending on other factors.
This motivates the problem of predicting the G-quadruplex melting temperature as a proxy for stability from its sequence alone. In contrast to simpler systems such as DNA duplexes (SantaLucia, 1998), sequence differences in G-quadruplexes affect thermodynamic stability in a non-linear fashion, hence rendering this prediction task challenging. The nearest neighbour approaches that have been so successful for predicting duplex stability, such as from (SantaLucia, 1998), are not applicable to folded-back structures such as G-quadruplexes.
It is relatively straightforward to experimentally determine the thermodynamic stability for specific G-quadruplexes using ultraviolet (UV) melting (Mergny et al., 1998). In a UV melting experiment, the absorbance of a guanine-rich oligonucleotide is recorded as a function of the temperature. This allows the melting temperature of the G-quadruplex to be deduced. However, no one has managed to extrapolate generalized energy parameters to each component of the structure. Instead, empirical rules and intuition have been built up based on small-scale studies with a few dozen G-quadruplex sequences. Various details have been discovered, establishing the importance, in particular, of the loops that join the core guanines together (Bugaut and Balasubramanian, 2008; Hazel et al., 2004; Lane et al., 2008). Although it is still in the early days of our understanding of G-quadruplex stability, it is clear that both loop length and loop composition are important. The stability of G-quadruplexes is also strongly influenced by the surrounding solution providing the monovalent cation that sits inside the structure, typically between the G-tetrad stacks (Fig. 1). For instance, K+ is strongly favoured over Na+ or Li+ and hence leads to more stable structures.
In this work, we propose a computational prediction method for the stability of G-quadruplexes based on Gaussian process (GP) regression. This includes a special purpose covariance function that allows sequence features potentially affecting the G-quadruplex stability to be flexibly incorporated. The inference procedure automatically determines the relevance of sequence features and yields predictions with error bars. Using a heavy-tailed likelihood, our model gains additional robustness with respect to outliers. The presented framework can also handle experimental data that merely set a maximum or minimum range on the melting temperature rather than an explicit value. This situation occurs if a structure is found to be stable at all experimentally accessible temperatures.
We demonstrate the accuracy of the prediction method on previously unseen sequences and compare it to alternative methods. Finally, we consider an active learning procedure and apply the methodology to assess the stability of G-quadruplexes in gene promoters, comparing them to other G-quadruplexes.
2 QUADRUPLEX PREDICTIONS USING GP
The prediction of G-quadruplex stability can be cast as a regression problem. For a given training dataset with observed G-quadruplexes, 𝒟={xn, tn}n=1N, the task is to infer a latent function f : x→t, mapping from a G-quadruplex input x to its melting temperature t. The main determinant of G-quadruplex stability is the sequence information. However, the cation nature and salt concentration also have an effect on the stability of the resulting G-quadruplex. Our G-quadruplexes were measured at different concentration levels, which must be taken into account when making predictions. We assume that inputs x={s, c} consist of the quadruplex sequence s and a vector of log-salt concentrations c.
To apply the GP machinery, all we need is a positive definite covariance function defined (kernel) between pairs of G-quadruplex inputs. Given a training dataset 𝒟 the posterior distribution over latent function values f is
| (2) |
where θK and θL are hyperparameters of the kernel (K) and the likelihood (L), respectively. We use X to denote the set of all training inputs, X=x1,…, xN. The covariance matrix KX, X(θK) is derived from the covariance function k(x, x′|θK) which specifies how function values at two inputs x, x′ covary. The noise model pL(tn|fn, θL) relates function values fn and the corresponding noisy observations tn. For simplicity let us first assume standard Gaussian noise, pL(tn|fn, θL)=𝒩tn|fn, σ2) with noise level σ. In this case, the predictive distribution for an unseen input x⋆ is a Gaussian again (Rasmussen and Williams, 2006), where t⋆∼𝒩(μ⋆, v⋆) and
 |
(3) |
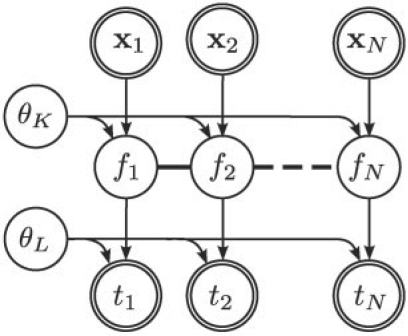
A Bayesian network representation of this model is shown in Figure 2. A comprehensive introduction to GPs can be found in Rasmussen and Williams (2006).
Fig. 2.
Bayesian network representation of a GP regression model. The model relates observed independent input/output pairs {xn, tn}n=1N. The thick lines couple the latent function value {fn}, illustrating the smoothness assumptions introduced by the GP prior. The parameters θK and θL denote hyperparameters of the kernel and likelihood, respectively.
Hyperparameters: a GP is a non-parametric model. The only explicit parameters of the model are hyperparameters θL and θK, all other parameters can be integrated out and are not represented explicitly.
In a GP model the posterior probability of the hyperparameters is
| (4) |
The log of the first term, ℒ(θK, θL) (marginal likelihood), can again be computed in closed form for a Gaussian-noise model (Rasmussen and Williams, 2006). Gradient-based optimizers can be used to then determine the most probable setting of the hyperparameters
| (5) |
2.1 Covariance function and hyperpriors
An important design choice for using a GP is a suitable covariance function. We use a product of covariance functions to combine kernels evaluated on the sequence s and solution concentrations c
| (6) |
where ks is the sequence kernel and kc the concentration kernel. The product expresses the belief that both kernels must assign high similarities for covariation of function values.
The squared exponential concentration kernel decays exponentially with log-concentration difference
| (7) |
where Ac determines the typical amplitude of deviations from the mean and {ci} are log salt concentrations in mM of Na+, K+, NH4+ and Mg2+, respectively. These are the four most common stabilizing cations for G-quadruplexes; the nature of the anion does not seem to play a role. The lengthscale parameters lc determine the significance of the associated concentration parameters where large lengthscales correspond to less relevant parameters and short length scales to more relevant ones. To make the lengthscale comparable, the individual input dimensions are linearly rescaled such that observed training inputs fall into a set range, here −5 to 5.
The sequence kernel, ks, is a sum of two covariance functions. The first covariance is designed to specifically incorporate existing beliefs about characteristic sequence features that are likely to determine the stability of the G-quadruplex (Lane et al., 2008). For flexibility, we consider G-quadruplexes that contain either two, three or four stacked tetrads and hence have the equivalent number of guanines in each run. From the raw sequence information of a G-quadruplex with the form
| (8) |
a set of features f is extracted:
Ltotal – total length of the sequence (in bases)
NG – number of G-tetrad stacks (2, 3 or 4)
L1 – length of the first loop (from the 5′ end, in bases)
L2 – length of the second loop
L3 – length of the third loop
FA – relative frequency of adenine in the sequence
FC – relative frequency of thymine
FT – relative frequency of cytosine
The loop lengths determine the number of bases between the guanine stacks, N1−NL. The relative frequency of the adenine, thymine and cytosine are calculated as  , where NA denotes the total number of adenines in the sequence (similarly for thymine and cytosine). Again, a squared exponential kernel is used to combine these features
 |
(9) |
where fi denotes the i-th of the eight sequence features. The parameters have the same interpretation as for the concentration kernel. As before, input dimensions are rescaled and the lengthscale parameters lf was adjust the relevance of the sequence features. The second sequence covariance function is ignorant to the biological meaning of the G-quadruplex sequence and merely treats it as character string. We can construct a spectrum kernel (Leslie et al., 2002), that is sensitive to common k-mers present in two sequences s and s′
| (10) |
where Φk(s) maps the sequence s to a vector of counts with the number of occurances for each k-mer in s. The number of possible k-mers in a nucleotide sequence scales as 4k and hence only small orders k are practical. In experiment,1 we consider k-mers up to an order of k=4. Due to this low order of k, this spectrum kernel is local in that it is not sensitive to long common substrings. In contrast, the feature kernel captures global sequence characteristics and hence both sequence kernels complement each other.
Finally, all three kernels are combined in
| (11) |
The relative weights of the individual kernels are controlled by the amplitude parameters Ac, Af and As.
Hyperpriors: priors on all kernel- and likelihood-hyperparameters {θK, θL} are Gamma distributed. The prior on the expected amplitudes of the squared exponential kernels Af and Ac is Γ(2, 10) with an expected value of 20. The amplitude of the string kernel has a prior As∼Γ(2, 0.5). The prior on the noise level σ is Γ(2, 0.5), which corresponds to an a priori uncertainty of ±1○C about the measured G-quadruplexes' melting temperatures. The lengthscale parameters of the feature and concentration kernels have a prior of Γ(4, 10), which favours long lengthscales (mean 40) encouraging irrelevant features to be switched off.
2.2 Robust likelihood
The presentation of the GP model so far makes the simplifying assumption that observation noise is Gaussian. For our full model, we use a heavy-tailed noise model which acknowledges that a small fraction of the data points can be extremely noisy (outliers) while others are measured with considerably more precision.
The ‘two model’ (Jaynes and Bretthorst, 2003) reflects this belief,
| (12) |
Here, π0 represents the probability that a datum is a regular observation and (1−π0) is the probability of an outlier observation. The variance of the outlier component, σ2∈f, is much larger than for regular observations, σ2, which allows the model to effectively discard outlier observations.
When using this likelihood model, the posterior in Equation (2) is no longer computable in closed form. To overcome this problem, we use Expectation Propagation (EP) (Minka, 2005) for approximate inference. The goal of EP is to approximate the exact posterior with a tractable alternative of the form
| (13) |
where gn(fn|Cn, μn, νn) denote approximate factors.
Following Rasmussen and Williams (2006) we choose unnormalized Gaussians
| (14) |
which results in a GP for the approximate distribution again.
The idea of EP is to iteratively update one approximate factor at a time, leaving all other factors fixed. This is achieved by minimizing the Kullback–Leibler (KL) divergence, a distance measure for distributions (Kullback and Leibler, 1951). The update for the i-th approximate factor is performed by minimizing
 |
(15) |
with respect to the i-th factor's parameters μi, νi and Ci. This is done by matching the moments between the two arguments of the KL divergence which can then be translated back into an update for factor parameters. There is no convergence guarantee for EP but in practice it is found to converge for the likelihood model we consider (see also Kuss et al., 2005). The fact that the mixture of Gaussian likelihood is not log-concave represents a problem as it may cause invalid EP updates, leading to a covariance matrix that is not positive definite. We avoid this problem by damping the updates as suggested by Kuss et al. (2005) and Seeger (2005).
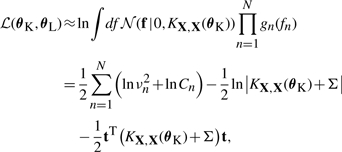
EP also yields an approximation of the log marginal likelihood which can be used to determine the setting of hyperparameters
 |
(16) |
where Σ=diag({νn}n=1N).
In addition to the noise level σ (Section 2.1), the robust likelihood includes a parameter σ∈f and the mixing proportion π0. The parameter π0 is optimized together with the remaining hyperparameters. The noise level of outliers, σ∈f, is set to 104.
After convergence of EP, we obtain a GP as approximate posterior distribution (Equation 13). Predictions from this model follow analogous to the standard GP (Equation 3).
A comprehensive overview on EP approximations for GP models can be found in Rasmussen and Williams (2006); robust GP regression has been previously applied to biological time series in Stegle et al. (2008).
2.3 Constrained likelihood
In addition to ‘normal’ observations of sequence/temperature pairs, our G-quadruplex measurements also include a small fraction of sequences where only a bound on the melting temperature was determined. For example, if a G-quadruplex is so stable that it does not complete its melting transition within the experimentally accessible range (typically 10–85○C), one can only deduce that the melting temperature is larger than this threshold value. Such observations can be included using a theta likelihood function. For instance, for an observed lower bound tn
| (17) |
where  . These non-Gaussian likelihood terms can be dealt with using an EP approximation similar to the one used in (12), where exact likelihood terms are approximated by Gaussian approximate site functions.
2.4 Active learning
In addition to predicting G-quadruplex melting temperatures, it is possible to use the GP framework for experimental design, i.e. to choose which of a set of candidates to measure. Suppose that we would like to optimally expand a training dataset 𝒟, such that we can make most informative predictions about a test set 𝒟test. A naive approach would be to randomly draw a subset of the sequences in 𝒟test, measure their melting temperatures and use them as additional training data. Alternatively we can consider active learning, choosing this set using an information criterion as proposed by MacKay (1992), or in the context of GP discussed by Seo et al. (2000). A practical objective function is the mean marginal information gain over the set of interest, here 𝒟test={x′m, t′m}m=1M. If the predictions are Gaussian, the mean marginal entropy is entirely determined by the predicted variances σt′m2
| (18) |
To decide which sequence to measure and add to the training data, we iterate through all candidate test inputs x′m∈𝒟test, choosing the one which minimizes SM. The mean entropy SM can be efficiently evaluated as predictive uncertainties of a GP, σt′m2, only depend on the training inputs (Equation 3) and hence candidate sequences can be scored before knowing their melting temperature (Seo et al., 2000). Once a measurement has been taken, the new input/target pair  is added to the training dataset and hyperparameters are optimized again.
3 EXPERIMENTS
To evaluate the proposed method, we applied the GP predictor to a meta dataset summarizing major G-quadruplex experiment data available as of today. In total, this dataset consists of 260 G-quadruplex structures which have been experimentally tested with varying salt concentrations. All of the considered sequences were of the form described by the pattern in Equation (8). Hence the covariance function as introduced in Section 2.1 was applicable.
3.1 Predictive performance on observed data
To assess the accuracy of the GP method, the model was trained on subsets of all 260 G-quadruplexes. Subsequently, the trained model was used to predict melting temperatures of G-quadruplexes in the remaining test set, and predictions were compared with the true observed melting temperatures. This predictive test was repeated for different training/split ratios and multiple random splits.
3.1.1 Mean prediction
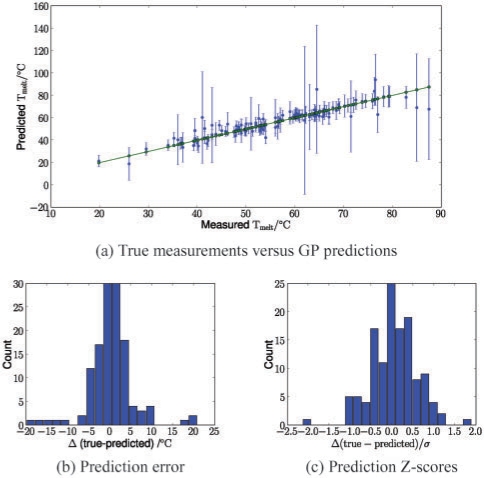
We first investigated how well we were able to predict real data using our model. Figure 3a shows marginal GP test predictions versus the true melting temperatures for a representative 50:50 training/test split. The plot illustrates that the GP has estimated appropriately sized error bars. A histogram view of the differences of the true melting temperatures and the predictions is shown in Figure 3b. The results show that most of the experimental data was predicted within a 5○C error margin, a reasonable standard of accuracy. Indeed, across 100 random 50:50 training/test splits, on average 80% of the predictions were within ±5○C of the experimentally determined values.
Fig. 3.
Accuracy of GP predictions for a representative 50:50 training/test split (260 total measurements). (a) True measured melting temperatures (green) and marginal GP predictions with ±2 SDs error bars (blue). (b) Prediction errors Δ. (c) Z-Scores for the predicted values,  .
.
We then compared the performance of our model with alternative methods. This comparison includes the proposed GP model (GP robust), a simpler variant of the model without the robust and constrained likelihood (GP standard), Bayesian linear regression on the sequence features f (Linear regression, Bishop (2006)) and a support vector machine (SVM, Fan et al., (2005)). The SVM was applied with the same kernel as used in the GP models. For the standard GP, linear regression and the SVM, sequences where the data only supplied an upper or lower bound on the melting temperature (i.e. the sequence was too stable to measure under these conditions) had to be excluded. In total, this reduced the size of the training dataset from 260 to 256 sequences.
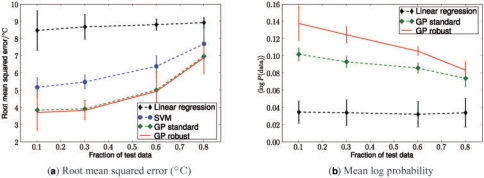
Figure 4a, shows the root mean squared error on the test dataset for different algorithms as a function of the relative test set size. As expected, the performance of all algorithms decreased with growing test set and therefore shrinking training set sizes. The GP methods outperformed the SVM, and linear regression. Our robust GP model performed marginally but consistently better than the standard GP.
Fig. 4.
Comparative predictive performance of different algorithms evaluated as a function of the relative test-set size (260 total measurements). (a) Root mean squared error on the test set. (b) Mean log probability of the test data under the predictive distribution. Error bars show 1SD estimated from 100 random training/test splits.
3.1.2 Variance prediction
As a second criterion, we assessed the mean log probability of the test data under the predictive distribution given by different models. Bigger predictive probability indicates that a method not only is accurate in estimating the mean but also yields appropriately sized error bars. For this analysis, the results from the support vector machine had to be excluded as the method does not yield a predicted uncertainty. The results in Figure 4b mirror the comparison of the root mean squared errors. However, using this probabilistic performance measure, the robust GP performed significantly better than the standard GP variant. This suggests that the robust likelihood model helps to ensure appropriate predictive uncertainties. The quality of these error bars is also supported by Figure 3c, which shows Z-scores of test predictions for a 50:50 training/test split. The number of data points within a ±2 SDs margin is in line with the expected number hence showing that the robust GP model ‘knows what it knows’. This is an important and powerful feature for making useful predictions, and will be relevant in the genome-wide G-quadruplex study in Section 4.
3.2 Determining causal features of the G-quadruplex sequence
To understand the mechanisms of G-quadruplex stability it is useful to be able to analyse which sequence features play a role in determining the stability of a G-quadruplex. Such insights can be gained from observing the optimized hyperparameters of the feature kernel kf. As the lengthscale parameter lfi indicates the relevance of a particular feature i, this can be regarded as a form of feature selection. A related approach has been described by Chu et al. (2005) who used GP for biomarker discovery in microarray experiments.
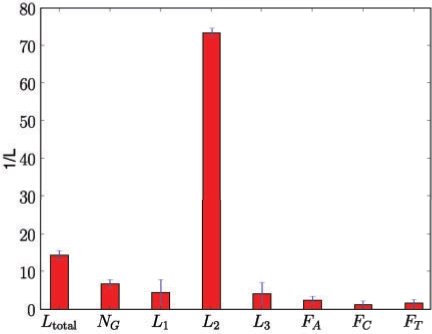
The string covariance function ks(s, s′) explains part of the sequence similarity and thus makes the relevances of the sequence feature kernel difficult to interpret. Hence the string covariance was excluded for this evaluation. Figure 5 shows the inverse lengthscale parameters of the sequence kernel optimized on the full G-quadruplex dataset. The results were averaged over 100 independent optimizations with random starting points. The results show that the relevance of features varied significantly. The most important features were the length of the middle sequence (L2), the total loop length (Ltotal) and the number of guanine stacks (NG). Among the parameters for base composition frequency, the adenine frequency appeared to be most important. Both observations are in line with previously observed characteristics of G-quadruplexes (Lane et al., 2008). However, it had been expected that L1 and L3 would also have a large effect. In this context, it is interesting to note the strong fluctuation of the significances of the outer loop lengths L1 and L3 as indicated by the error bars in Figure 5. A possible explanation for this effect is that there are dependencies between these parameters such that either one or the other feature is needed to explain G-quadruplex stability. Obviously, there is an underlying relationship between Ltotal, NG and L1…3. As a result of this interaction, independent restarts might then explore different modes of the hyperparameters' posterior distribution.
Fig. 5.
Optimized inverse lengthscale hyperparameters. The plot shows empirically estimated means and ±1 SD error bars estimated from 100 restarts of the optimization procedure. Larger bars indicate more important parameters.
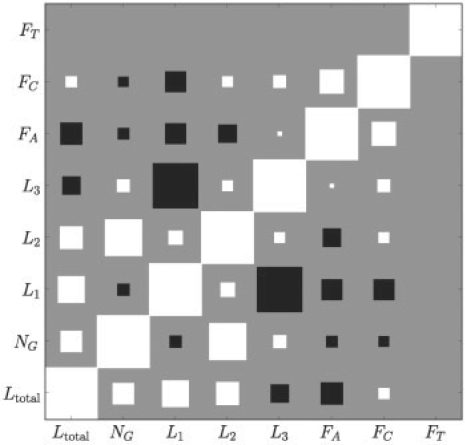
To better understand the posterior over hyperparameters, we employed a Hamiltonian Monte Carlo sampler (e.g. MacKay, 2003) to draw samples from this distribution. Figure 6 shows the correlations between hyperparameters of the feature kernel as a Hinton diagram. The correlation coefficients have been calculated from 500 MCMC samples (500 burn-in). This figure shows that the relevances of L1 and L3 were indeed anti-correlated. This observed anti-correlation can be explained by positive correlations between the corresponding features in the training dataset, causing that either L1 or L3 is sufficient to predict the melting temperature. A strong positive correlation of hyperparameters was observed between the loop length L2 and the number of G-stacks NG.
Fig. 6.
Correlations between inferred hyperparameters illustrated as Hinton diagram. Correlation coefficients were estimated from 500 Monte Carlo sample. The size of the squares denote the strength of the correlation, where white squares indicate positive correlation and black squares negative correlation.
4 GENOME-WIDE ANALYSIS OF G-QUADRUPLEX CANDIDATES
We applied the GP predictor to human genome-wide G-quadruplex candidates downloaded from the quadruplex.org database (Wong et al., 2008). The database contains candidate structures extracted from sequence information using the pattern-based rule from Equation (8), considering quadruplexes with three or more G-stacks (NG≥3).
Using this rule a total of 359 548 G-quadruplex candidates with precisely 3 loops have been identified genome-wide, from a total of 373 k predicted sequences, some of which contain several possible G-quadruplexes, and hence cannot be predicted with the available data. Following Huppert and Balasubramanian (2007), we also extracted those G-quadruplexes found in the promoters of human genes, looking at the 200 bp upstream of the transcription start site. Again restricting to 3-loop G-quadruplexes there were 10 987 quadruplexes in human promoter regions.
All computational predictions for these G-quadruplexes were made for a solution containing 100 mM K+, which roughly approximates physiological conditions and has become something of a standard for experimentation.
4.1 Active learning for promoter G-quadruplexes
Given the large number of genomic sequences and the relatively small number of data points, it is necessary to be efficient with data collection, so as to maximize the information derived from each new experiment. We therefore developed a method of active learning such that we can predict which experimental data (i.e. melting temperatures of sequences) would be most useful to collect. As a preliminary case study of the usefulness of active learning, we considered the set of promoter G-quadruplexes and applied the active learning strategy outlined in Section 2.4.
Given the training dataset, we selected the subset of the 10 most informative G-quadruplexes in promoter regions, assessed by the marginal information gain. The melting temperatures of the corresponding sequences were experimentally determined and added to the training set. As an alternative, we did the exact same experiment but selected 10 randomly chosen sequences instead. Again the sequences were experimentally characterized and added to the training set. In each case, the sequences were prepared at 4 μM concentration in a Tris–HCl buffer at pH 7.4 with 100 mM KCl. A Varian Cary 300 spectrophotometer was used to measure the absorbance at 295 nm over repeated slow heating/cooling cycles (Mergny et al., 1998). Melting temperatures were determined by the derivative method. Figure 7 shows the average predictive uncertainty for all promoter quadruplexes as a function of the number of additional measurements. Results for the physical measurements are indicated as red and black crosses. Lines show the expected uncertainties obtained from the model without conducting any physical measurement.
Fig. 7.
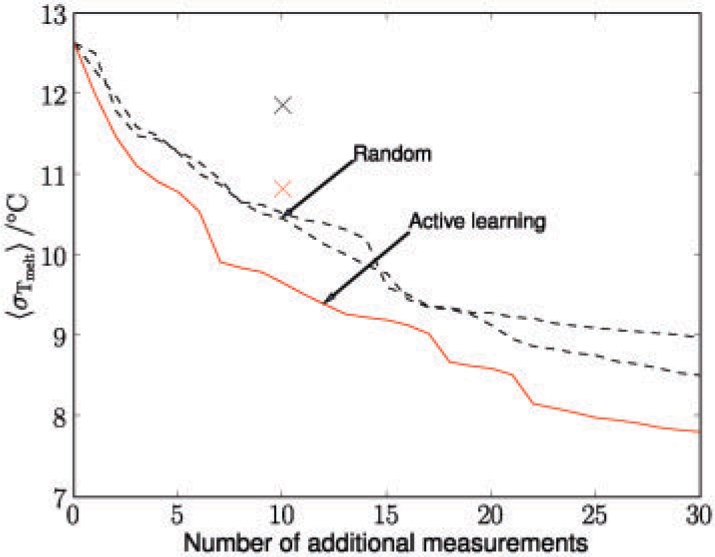
Average predictive uncertainty for promoter G-quadruplexes as a function of the number of additional measurements. Compared are two random measurement sequences (black) and the active learning strategy (red). The red and black cross indicate the average predictive uncertainty after physically measuring 10 actively (red) or randomly (black) chosen G-quadruplexes.
It is apparent that very few additional measurements can significantly reduce the predictive uncertainty. This observation can be explained by the sequence homology present in the G-quadruplexes found across the genome (Huppert and Balasubramanian, 2005; Todd et al., 2005). The active selection performed significant better than the randomly selected sequences. Active learning allows a feedback cycle to be developed, where after each set of data is added, new learning can be performed to optimize the next data collection, resulting in efficient experimentation.
The average uncertainties resulting after real measurements were higher than the model expectations. This discrepancy is because the theoretical calculations are approximations based on fixed hyperparameters, whereas for the physical measurements the hyperparameters were re-optimized (Section 2.4). However, we did clearly observe a substantial reduction in uncertainty using the experimental data. These results are supportive and encouraging that active learning in the context of G-quadruplex structures is a helpful tool, although clearly more than 10 further data points are required to make a substantial difference to the predictive power of the model.
4.2 Study of genome-wide G-quadruplex candidates
We also performed predictions on all 360 k G-quadruplexes genome-wide. The predictive uncertainty for those G-quadruplexes varied significantly. Figure 8 shows a histogram of the predictive uncertainty in SD for the entire set of all G-quadruplex sequences. For 90% of the sequences this uncertainty was <14○C. At a more stringent cut off level, still 63% of the sequences could be determined within ±10○C and 6% within ±5○C. This highlights the need for further data collection and the active learning methodology previously described, as well as highlighting the usefulness of predictive uncertainties.
Fig. 8.
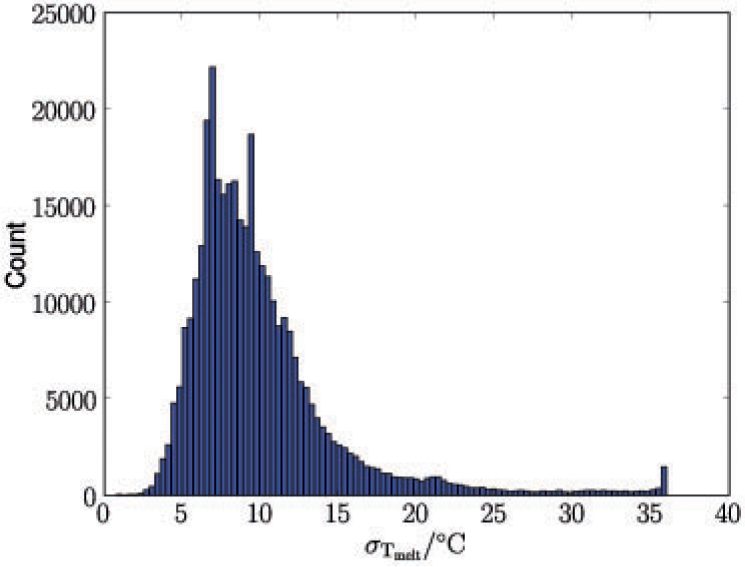
Predictive uncertainty for genome-wide G-quadruplex candidates shown in standard deviations in degree celsius.
4.2.1 Quadruplexes in promoters
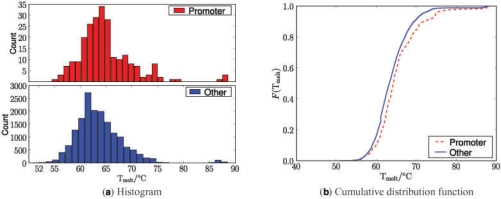
Previous analysis of G-quadruplexes suggests that G-quadruplexes are likely to play a widespread regulatory role, supporting experimental demonstrations. It has been shown that G-quadruplexes are over-represented inside promoter regions compared to elsewhere in the genome, by about an order of magnitude (Huppert and Balasubramanian, 2007). However, so far it has not been possible to assess whether these quadruplex structures have different stabilities. Here, we use the developed GP predictor to investigate whether there are systematic differences of G-quadruplex stability inside and outside of promoter regions. Figure 9 directly compares the predictive mean melting temperature for G-quadruplex structures inside promoter regions with G-quadruplexes elsewhere in the genome. For this analysis, we restricted the considered sequences to those that could be predicted with at most a 5○C standard deviation error margin yielding a total of 17 006 G-quadruplexes out of which 235 were in promoter regions. The plots suggest that the statistics of melting temperature might indeed be different for promoter G-quadruplexes. The significance of the difference between the two distributions, melting temperatures of promoter G-quadruplexes and non-promoter quadruplexes, was assessed by a Kolmogorov–Smirnov test. A two-sided test on the predicted mean temperatures for promoter and non-promoter G-quadruplexes found the difference was significant (P=4.05 × 10⁻⁵). This result suggests that G-quadruplexes found in gene promoters are likely to be more stable than those found in the bulk of the genome.
Fig. 9.
Mean predictions of the melting temperature in 100 mM KCl for genome-wide G-quadruplex candidates with a predicted uncertainty <5 ○C. (a) Histograms for promoter and non-promoter quadruplexes. (b) Cumulative distribution functions.
5 DISCUSSION AND CONCLUSION
We have here presented a robust and sensitive method for inferring the stability of G-quadruplexes from the sequence information. Our approach is robust with respect to outliers, allows constraints to be incorporated as observations and automatically determines relevant sequence features. We have further demonstrated how active learning can be used to perform experimental design to guide the choice which sequences of a set of candidates to measure.
We demonstrated as proof of principle that we can apply this approach to determine features of biologically important G-quadruplexes, selecting as our example G-quadruplexes found in the 200 bp region upstream of known human gene transcription start sites, a region containing much promoter activity. We have shown previously that G-quadruplexes are concentrated in this region (Huppert and Balasubramanian, 2007), and a number of individual studies have confirmed that these can have transcriptional regulatory ability (Qin and Hurley, 2008). From the results shown here, we can now conclude that the G-quadruplexes in promoters are likely to be more stable than in the genome as a whole, further supporting the hypothesis that they play an important general role in transcriptional control. The precise mechanistic details of how G-quadruplexes regulate transcription are not entirely clear, but the current model is that their formation disrupts the binding of the normal transcriptional machinery (Qin and Hurley, 2008). This approach can be further extended to other regions where G-quadruplexes are found to investigate other functional roles.
Several interesting and fruitful extensions to our proposed method could be considered. The sizes of currently available G-quadruplex datasets is very limited. As more data becomes available it would be possible to apply more general sequence kernels characterizing similarity of the loop sequences. Such an approach might yield novel insights into how the sequence composition influences the stability of G-quadruplex structures. We are currently in the process of scaling available G-quadruplex data to significantly larger datasets using the active learning approach proposed in this work to efficiently explore the phase space available. Once the amount of available data goes beyond 1000 examples, it would be helpful to explore sparse approximations to the proposed GP scheme (for instance Snelson and Ghahramani, 2006).
We will also arrange a data store for other researchers to contribute experimental data they have collected. We plan to have discussions with other researchers to establish a standard for experimental measurements, as well as standards for the quality and style of data provided, which should include measurements of ΔG(37○C), ΔH and ΔS as well as the melting temperature. This would allow us to predict these parameters in addition to the melting temperature alone. We intend to provide a web-enabled version of these predictions. Links to these resources, source code and Supplementary Material are available online.2 The field of G-quadruplexes has grown rapidly in recent years, and we anticipate that the ability to predict their thermodynamic properties will be useful to many in the field, and accelerate the rate of discovery of new functional roles for these fascinating structures.
Conflict of Interest: none declared
Footnotes
1Source code for the mapping from strings to k-mer count vectors is taken from the Shogun toolbox (Sonnenburg et al., 2006).
REFERENCES
- Bishop CM. Pattern Recognition and Machine Learning. New York: Springer; 2006. [Google Scholar]
- Bourdoncle A, et al. Quadruplex-based molecular beacons as tunable DNA probes. J. Am. Chem. Soc. 2006;128:11094–11105. doi: 10.1021/ja0608040. [DOI] [PubMed] [Google Scholar]
- Bugaut A, Balasubramanian S. A sequence-independent study of the influence of short loop lengths on the stability and topology of intramolecular DNA G-quadruplexes. Biochemistry. 2008;47:689. doi: 10.1021/bi701873c. [DOI] [PMC free article] [PubMed] [Google Scholar]
- Burge S, et al. Quadruplex DNA: sequence, topology and structure. Nucleic Acids Res. 2006;34:5402. doi: 10.1093/nar/gkl655. [DOI] [PMC free article] [PubMed] [Google Scholar]
- Chu W, et al. Biomarker discovery in microarray gene expression data with Gaussian processes. Bioinformatics. 2005;21:3385–3393. doi: 10.1093/bioinformatics/bti526. [DOI] [PubMed] [Google Scholar]
- Fan RE, et al. Working set selection using second order information for training support vector machines. J. Mach. Learn. Res. 2005;6:1889–1918. [Google Scholar]
- Hazel P, et al. Loop-length-dependent folding of G-quadruplexes. J. Am. Chem. Soc. 2004;126:16405–16415. doi: 10.1021/ja045154j. [DOI] [PubMed] [Google Scholar]
- Huppert JL. Four-stranded nucleic acids: structure, function and targeting of G-quadruplexes. Chem. Soc. Rev. 2008;37:1375–1384. doi: 10.1039/b702491f. [DOI] [PubMed] [Google Scholar]
- Huppert JL, Balasubramanian S. Prevalence of quadruplexes in the human genome. Nucleic Acids Res. 2005;33:2908. doi: 10.1093/nar/gki609. [DOI] [PMC free article] [PubMed] [Google Scholar]
- Huppert JL, Balasubramanian S. G-quadruplexes in promoters throughout the human genome. Nucleic Acids Res. 2007;35:406. doi: 10.1093/nar/gkl1057. [DOI] [PMC free article] [PubMed] [Google Scholar]
- Jaynes ET, Bretthorst GL. Probability Theory: The Logic of Science. UK: Cambridge University Press; 2003. [Google Scholar]
- Kullback S, Leibler R. On information and sufficiency. Ann. Math. Stat. 1951;22:79–86. [Google Scholar]
- Kumari S, et al. An RNA G-quadruplex in the 5′ UTR of the NRAS proto-oncogene modulates translation. Nat. Chem. Biol. 2007;3:218–221. doi: 10.1038/nchembio864. [DOI] [PMC free article] [PubMed] [Google Scholar]
- Kuss M, et al. Technical Report 136. Tubingen: Max Planck Institute for Biological Cybernetics; 2005. Approximate inference for robust gaussian process regression. [Google Scholar]
- Lane AN, et al. Stability and kinetics of G-quadruplex structures. Nucleic Acids Res. 2008;36:5482–5515. doi: 10.1093/nar/gkn517. [DOI] [PMC free article] [PubMed] [Google Scholar]
- Leslie C, et al. The spectrum kernel: a string kernel for SVM protein classification. Proceedings of the Pacific Symposium on Biocomputing. 2002;7:566–575. [PubMed] [Google Scholar]
- MacKay DJC. Information-based objective functions for active data selection. Neural Comput. 1992;4:590–604. [Google Scholar]
- MacKay DJC. Information Theory, Inference and Learning Algorithms. UK: Cambridge University Press; 2003. [Google Scholar]
- Mergny JL, et al. Following G-quartet formation by UV-spectroscopy. FEBS Lett. 1998;435:74–78. doi: 10.1016/s0014-5793(98)01043-6. [DOI] [PubMed] [Google Scholar]
- Minka TP. Technical report. Cambridge, UK: Microsoft Research Ltd.; 2005. Divergence measures and message passing. [Google Scholar]
- Neidle S, Balasubramanian S. Quadruplex Nucleic Acids. Cambridge, UK: Royal Society of Chemistry; 2006. [Google Scholar]
- Oganesian L, Bryan TM. Physiological relevance of telomeric G-quadruplex formation: a potential drug target. Bioessays. 2007;29:155. doi: 10.1002/bies.20523. [DOI] [PubMed] [Google Scholar]
- Patel DJ, et al. Human telomere, oncogenic promoter and 5′-UTR G-quadruplexes: diverse higher order DNA and RNA targets for cancer therapeutics. Nucleic Acids Res. 2007;35:7429. doi: 10.1093/nar/gkm711. [DOI] [PMC free article] [PubMed] [Google Scholar]
- Qin Y, Hurley LH. Structures, folding patterns, and functions of intramolecular DNA G-quadruplexes found in eukaryotic promoter regions. Biochimie. 2008;90:1149–71. doi: 10.1016/j.biochi.2008.02.020. [DOI] [PMC free article] [PubMed] [Google Scholar]
- Rasmussen CE, Williams CKI. Gaussian Processes for Machine Learning. Cambridge, UK: MIT Press; 2006. [Google Scholar]
- SantaLucia J. A unified view of polymer, dumbbell, and oligonucleotide DNA nearest-neighbor thermodynamics. Proc. Natl Acad. Sci. USA. 1998;95:1460–1465. doi: 10.1073/pnas.95.4.1460. [DOI] [PMC free article] [PubMed] [Google Scholar]
- Seeger M. Technical report. Berkeley: University of California; 2005. Expectation Propagation for exponential families. [Google Scholar]
- Seo S, et al. Gaussian process regression: Active data selection and test point rejection. Neural Networks, 2000. IJCNN 2000, Proceedings of the IEEE-INNS-ENNS International Joint Conference. 2000;3 [Google Scholar]
- Siddiqui-Jain A, et al. Direct evidence for a G-quadruplex in a promoter region and its targeting with a small molecule to repress c-MYC transcription. Proc. Natl Acad. Sci. USA. 2002;99:11593–11598. doi: 10.1073/pnas.182256799. [DOI] [PMC free article] [PubMed] [Google Scholar]
- Snelson E, Ghahramani Z. Sparse Gaussian processes using pseudo-inputs. Adv. Neural Inform. Process. Sys. 2006;18:1257. [Google Scholar]
- Sonnenburg S, et al. Large scale multiple kernel learning. J. Mach. Learn. Res. 2006;7:1531–1565. [Google Scholar]
- Stegle O, et al. Gaussian process robust regression for noisy heart rate data. IEEE Trans Biomed. Eng. 2008;55:2143–2151. doi: 10.1109/TBME.2008.923118. [DOI] [PubMed] [Google Scholar]
- Todd A, et al. Highly prevalent putative quadruplex sequence motifs in human DNA. Nucleic Acids Res. 2005;33:2901. doi: 10.1093/nar/gki553. [DOI] [PMC free article] [PubMed] [Google Scholar]
- Wong H, et al. Quadruplex.org. University of Cambridge; 2008. Available at http://www.quadruplex.org (Last accessed date December, 08) [Google Scholar]


