Vacuolar α-mannosidase, a cargo protein of the cytoplasm-to-vacuole targeting pathway, has been expressed, purified and crystallized.
Keywords: α-mannosidase, cargo proteins, Cvt pathway, Saccharomyces cerevisiae
Abstract
Saccharomyces cerevisiae α-mannosidase (Ams1) is a cargo protein that is transported to the vacuole by the cytoplasm-to-vacuole targeting (Cvt) pathway during conditions of growth and by autophagy during conditions of starvation. After transport to the vacuole, Ams1 functions as a resident hydrolase. Ams1 has been overexpressed in the methylotrophic yeast Pichia pastoris, purified and crystallized in two crystal forms. Form I belongs to space group P21, with unit-cell parameters a = 145.7, b = 127.7, c = 164.0 Å, β = 101.5°. Form II belongs to space group I222 or I212121, with unit-cell parameters a = 127.9, b = 163.7, c = 291.5 Å. Diffraction data were collected from these crystals to a resolution of 3.3 Å for form I and of 2.6 Å for form II using synchrotron radiation.
1. Introduction
In the yeast Saccharomyces cerevisiae, most vacuolar enzymes are transported to the vacuole through the secretory pathway. However, vacuolar α-mannosidase (Ams1) and aminopeptidase I (Ape1) have been reported to be transported to the vacuole by a novel pathway called the cytoplasm-to-vacuole targeting (Cvt) pathway under vegetative conditions (Yoshihisa & Anraku, 1990 ▶; Klionsky et al., 1992 ▶; Baba et al., 1997 ▶; Scott et al., 1997 ▶; Hutchins & Klionsky, 2001 ▶). The Cvt pathway overlaps genetically with autophagy, the bulk degradation process that transports proteins and organelles to the vacuole for degradation, and their molecular machineries are similar to each other (Klionsky & Ohsumi, 1999 ▶). In general, starvation-induced autophagy is nonselective; however, it selectively transports Ams1 and Ape1 to the vacuole. Immediately after synthesis, Ams1 and Ape1 independently assemble into oligomers (Hutchins & Klionsky, 2001 ▶; Kim et al., 1997 ▶), which are then recognized by their receptor, Atg19 (Scott et al., 2001 ▶). Atg19 further interacts with Atg8 and Atg11, which tether the Ams1–Ape1–Atg19 complex, termed the Cvt complex, to the pre-autophagosomal structure (PAS; Yorimitsu & Klionsky, 2005 ▶). PAS is the perivacuolar vesicle-forming site where the cargo–receptor complex is selectively enwrapped by a double-membrane structure termed the Cvt vesicle under growth conditions and by a similar but larger double-membrane structure termed the autophagosome under starvation conditions (Suzuki et al., 2001 ▶, 2002 ▶; Kim et al., 2002 ▶). The outer membrane of the Cvt vesicle or the autophagosome then fuses with the vacuole and Ams1 is transported to the vacuole. One identified role of Ams1 is in the degradation of free oligosaccharides (Chantret et al., 2003 ▶).
Neither the reason why yeast utilizes the Cvt pathway and autophagy to transport Ams1 to the vacuole nor the mechanism has been elucidated. Structural studies of Ams1 would be helpful in order to answer these questions as well as to understand the functions of this poorly characterized enzyme. In this report, we describe the expression, purification and crystallization of full-length Ams1.
2. Expression and purification
Full-length Ams1 (1083 residues) was expressed as follows. Using the NdeI–XhoI restriction sites, the region encoding residues 1–1083 of Ams1 was inserted into a modified pGAPZα vector (Invitrogen) in which the α-factor signal sequence was deleted and a His6 tag and a γTEV protease-cleavage sequence as well as an NdeI site were instead introduced upstream of the XhoI site. Pichia pastoris SMD1168 strain (Invitrogen) transformed with this vector was cultured at 301 K for 36 h. After cell lysis by sonication, Ams1 was first purified by affinity chromatography using an Ni–NTA agarose column (Qiagen) and the His6 tag was then cleaved with γTEV protease. A Gly-His sequence remained at the N-terminus of Ams1 (the calculated molecular weight of the tag-removed Ams1 was 124 689 Da). Ams1 was then purified on a Resource S cation-exchange column (GE Healthcare) eluted with a 0–1 M NaCl gradient in 20 mM MES buffer pH 6.0. Ams1 was further purified by size-exclusion chromatography using a Superdex 200 column (GE Healthcare) eluted with 20 mM MES buffer pH 6.0 and 150 mM NaCl and was concentrated to 6 mg ml−1 in 20 mM MES buffer pH 6.0, 150 mM NaCl and 2 mM DTT.
3. Crystallization
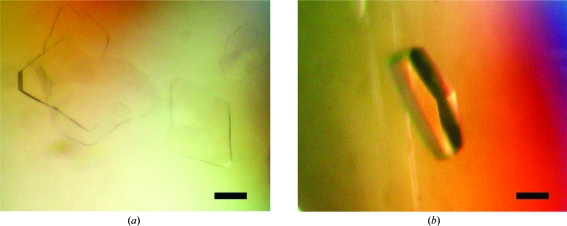
Crystallization trials were performed using the sitting-drop vapour-diffusion method at 293 K. Initial screening was performed using Crystal Screen and Crystal Screen 2 (Hampton Research) and Wizard I and Wizard II (Emerald Biostructures). Crystals were obtained in two crystal forms by mixing 0.3 µl 6 mg ml−1 Ams1 in 20 mM MES buffer pH 6.0, 150 mM NaCl and 2 mM DTT with 0.3 µl reservoir solution and equilibrating against 100 µl reservoir solution. Form I crystals were obtained using reservoir solution consisting of 0.1 M Tris–HCl pH 8.5, 4%(w/v) polyethylene glycol 8000. They grew to average dimensions of 200 × 200 × 20 µm after a day (Fig. 1 ▶ a). Form II crystals were obtained with reservoir solution consisting of 0.1 M HEPES buffer pH 7.0, 8%(w/v) polyethylene glycol 3350 and 0.1 M calcium acetate. They grew to average dimensions of 400 × 100 × 50 µm after a day (Fig. 1 ▶ b).
Figure 1.
Crystals of Ams1. The black scale bar is 100 µm in length.
4. Preliminary crystallographic analysis
Crystals were immersed into reservoir solution supplemented with 30% glycerol as a cryoprotectant for several seconds and were then flash-cooled and kept in a stream of nitrogen gas at 95 K during data collection. Diffraction data were collected on ADSC Quantum 210 (form I) and 270 (form II) charge-coupled device detectors using beamlines NW12A (form I) and BL-17A (form II) at KEK, Japan. The diffraction data were indexed, integrated and scaled with the program HKL-2000 (Otwinowski & Minor, 1997 ▶). The data-collection statistics are summarized in Table 1 ▶.
Table 1. Data-collection statistics.
Values in parentheses are for the highest resolution shell.
| Crystal form | I | II |
|---|---|---|
| Space group | P21 | I222 or I212121 |
| Resolution range (Å) | 50–3.3 (3.36–3.30) | 50–2.6 (2.64–2.60) |
| Wavelength (Å) | 1.000 | 1.000 |
| Observed reflections | 214686 | 499026 |
| Unique reflections | 88641 | 93738 |
| Mosaicity (°) | 0.54–2.72 | 0.15–0.59 |
| Completeness (%) | 91.4 (91.5) | 99.8 (99.6) |
| Rmerge(I)† (%) | 11.6 (29.8) | 6.8 (29.5) |
| 〈I/σ(I)〉 | 10.1 (3.0) | 32.7 (7.0) |
R
merge(I) = 
 , where I
i(hkl) is the ith observed amplitude of reflection hkl and 〈I(hkl)〉 is the mean amplitude for measurements of reflection hkl.
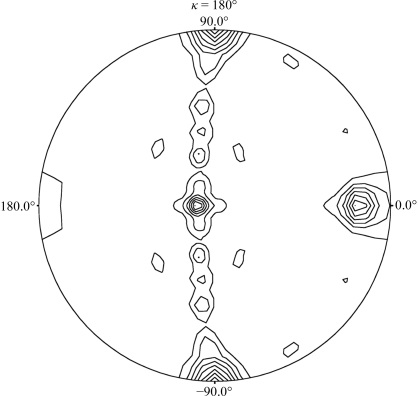
The form I crystal belonged to the monoclinic space group P21, with unit-cell parameters a = 145.7, b = 127.7, c = 164.0 Å, β = 101.5°. The form II crystal belonged to the orthorhombic space group I222 or I212121, with unit-cell parameters a = 127.9, b = 163.7, c = 291.5 Å. The acceptable range of volume-to-mass ratio (V M) values (Matthews, 1968 ▶) indicated that the form I crystal contained 4–6 protein molecules per asymmetric unit (V M = 2.0–3.0 Å3 Da−1; estimated solvent content 38.5–59.0%) and the form II crystal contained 2–3 protein molecules per asymmetric unit (V M = 2.0–3.1 Å3 Da−1; estimated solvent content 39.7–59.8%). Self-rotation functions calculated using the CCP4 software suite (Collaborative Computational Project, Number 4, 1994 ▶) showed that form I contains two noncrystallographic twofold axes (Fig. 2 ▶), suggesting that form I may contain an even number of molecules, namely four or six, per asymmetric unit. In contrast, no obvious noncrystallographic axis was found in form II. Form I and II crystals diffracted to 3.3 and 2.6 Å resolution, respectively. Molecular replacement was performed for both crystal forms using the crystal structure of Golgi α-mannosidase II from Drosophila melanogaster (PDB code 1hty; van den Elsen et al., 2001 ▶; 22% sequence identity to S. cerevisiae Ams1 over 758 residues) as the search model, but no solution was obtained. Structure determination by the multiple isomorphous replacement method is now in progress.
Figure 2.
The self-rotation functions from the data set of a form I crystal. The self-rotation functions were calculated using a 30 Å radius of integration and data in the resolution range 15–4 Å.
Acknowledgments
We thank the staff at beamlines NW12A and BL-17A, KEK, Japan for data-collection support. This work was supported by a Grant-in-Aid for Scientific Research on Priority Areas and by the National Project on Protein Structural and Functional Analyses from the Ministry of Education, Culture, Sports, Science and Technology (MEXT), Japan. This work was carried out under the NIBB Cooperative Research Program (4-148).
References
- Baba, M., Osumi, M., Scott, S. V., Klionsky, D. J. & Ohsumi, Y. (1997). J. Cell Biol.139, 1687–1695. [DOI] [PMC free article] [PubMed]
- Chantret, I., Frenoy, J. P. & Moore, S. E. (2003). Biochem. J.373, 901–908. [DOI] [PMC free article] [PubMed]
- Collaborative Computational Project, Number 4 (1994). Acta Cryst. D50, 760–763.
- Elsen, J. M. H. van den, Kuntz, D. A. & Rose, D. R. (2001). EMBO J.20, 3008–3017. [DOI] [PMC free article] [PubMed]
- Hutchins, M. U. & Klionsky, D. J. (2001). J. Biol. Chem.276, 20491–20498. [DOI] [PMC free article] [PubMed]
- Kim, J., Huang, W. P., Stromhaug, P. E. & Klionsky, D. J. (2002). J. Biol. Chem.277, 763–773. [DOI] [PMC free article] [PubMed]
- Kim, J., Scott, S. V., Oda, M. N. & Klionsky, D. J. (1997). J. Cell Biol.137, 609–618. [DOI] [PMC free article] [PubMed]
- Klionsky, D. J., Cueva, R. & Yaver, D. S. (1992). J. Cell Biol.119, 287–299. [DOI] [PMC free article] [PubMed]
- Klionsky, D. J. & Ohsumi, Y. (1999). Annu. Rev. Cell Dev. Biol.15, 1–32. [DOI] [PubMed]
- Matthews, B. W. (1968). J. Mol. Biol.33, 491–497. [DOI] [PubMed]
- Otwinowski, Z. & Minor, W. (1997). Methods Enzymol.276, 307–326. [DOI] [PubMed]
- Scott, S. V., Baba, M., Ohsumi, Y. & Klionsky, D. J. (1997). J. Cell Biol.138, 37–44. [DOI] [PMC free article] [PubMed]
- Scott, S. V., Guan, J., Hutchins, M. U., Kim, J. & Klionsky, D. J. (2001). Mol. Cell, 7, 1131–1141. [DOI] [PMC free article] [PubMed]
- Suzuki, K., Kamada, Y. & Ohsumi, Y. (2002). Dev. Cell, 3, 815–824. [DOI] [PubMed]
- Suzuki, K., Kirisako, T., Kamada, Y., Mizushima, N., Noda, T. & Ohsumi, Y. (2001). EMBO J.20, 5971–5981. [DOI] [PMC free article] [PubMed]
- Yorimitsu, T. & Klionsky, D. J. (2005). Mol. Biol. Cell, 16, 1593–1605. [DOI] [PMC free article] [PubMed]
- Yoshihisa, T. & Anraku, Y. (1990). J. Biol. Chem.265, 22418–22425. [PubMed]


