Abstract
This study investigates the temporal dynamics of ictal electrical activity induced by injection of the GABAA receptor antagonist bicuculline, and the glutamate agonist kainic acid, into the CA3 area of hippocampus. Experiments were conducted in freely moving adult Wistar rats implanted with microelectrodes in multiple brain areas. Wide-band electrical activity (0.1–3000 Hz) was recorded, and the latency of seizure onset as well as the pattern of electrical activity were investigated for each drug. The latencies between injection and the occurrence of first epileptiform events were 3.93 ± 2.76 (±STD) min for bicuculline and 6.37 ± 7.66 min for kainic acid, suggesting the existence of powerful seizure-suppressive mechanisms in the brain. Bicuculline evoked high-amplitude rhythmic epileptiform events at the site of injection which resembled interictal EEG spikes and rapidly propagated to adjacent and remote brain areas. Kainic acid evoked a completely different pattern with a gradual increase in the amplitude of 30–80 Hz activity. Whereas there was strong temporal correlation between EEG events at the site of bicuculline injection and discharges in distant areas, much less correlation was seen with kainic acid injection. Both patterns were followed by generalized ictal EEG discharges and behavioral seizures. Our results illustrate that the same area of the brain can trigger seizures with different electrographic patterns. The knowledge of the network mechanisms underlying these two distinct electrographic patterns might be helpful in designing differential strategies for preventing seizure occurrence.
Introduction
We and others have described two predominant depth-recorded electrographic ictal EEG onsets in patients with mesial temporal lobe epilepsy (Spencer et al., 1992; Velasco et al., 2000; Bragin et al., 2005). The most common is a buildup of rhythmic hypersynchronous discharges, which often begins focally and appears to be most characteristic of hippocampal sclerosis. The other consists of a buildup of low-voltage fast activity, which often begins regionally and could implicate involvement of extrahippocampal structures in seizure generation. Because the low-voltage fast ictal onset resembles the electrographic pattern of seizures initiated by focal cortical penicillin (Matsumoto and Marsan, 1964a,b), we have suggested that the underlying neuronal mechanism involves disinhibition, whereas the other pattern should require enhanced inhibition, in addition to enhanced excitation, to produce hypersynchrony (Engel, 1989). Our studies with a chronic rat model of mesial temporal lobe epilepsy, which develops months after status epilepticus induced by intrahippocampal kainic acid injection, however, have identified seizures characterized by both ictal onset patterns, and both appear to originate in the sclerotic hippocampus (Bragin et al., 1999). The experiments reported here were designed to determine whether the two ictal onset EEG patterns can be reproduced acutely by different epileptogenic agents and whether both can be induced in the hippocampus. Furthermore, if both treatments result in two different ictal onset patterns originating in the same hippocampal structure, this would further support the view that the ictal mechanisms are not dependent on different neuronal substrates.
Materials and Methods
The University of California, Los Angeles Institutional Animal Care and Use Committee approved all procedures described in this study.
Microelectrode implantation.
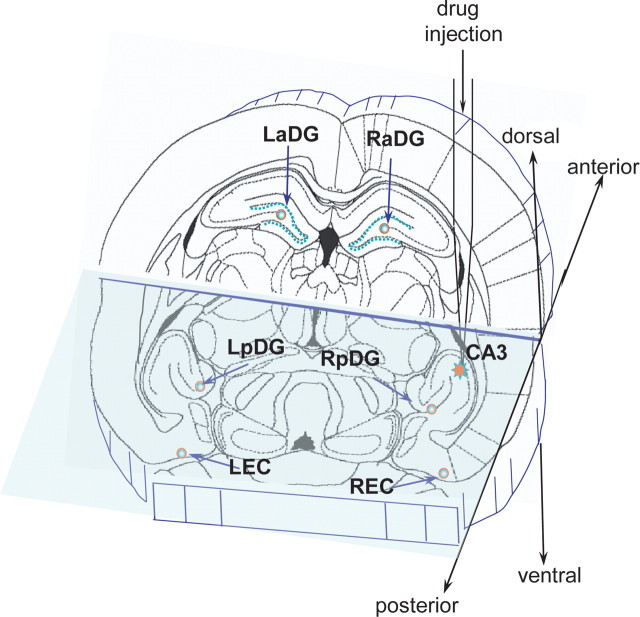
Adult Wistar rats (250–300 g, n = 15) were anesthetized with isoflurane and fixed into a stereotaxic frame. A guide cannula was implanted into the stratum oriens of the CA3 region of the right posterior hippocampus [coordinates according to Paxinos and Watson (1997): anterior–posterior (AP), −5.0; medial–lateral (ML), 5.0; dorsal–ventral (DV), 5.3]. A tungsten wire was glued to the guide cannula with the tip 0.5 mm longer than the tip of the guide cannula and used as a recording microelectrode from the site of drug injection. Fixed-recording microelectrodes consisting of (50 μm diameter) tungsten wire were implanted into (1) dentate gyrus (DG) adjacent to the point of injection (AP, −5.6; ML, 3.5; DV, 5.0), (2) remote DG of the anterior hippocampal complex (AP, −3.5; ML, 2.0; DV, 4.5), (3) ipsilateral entorhinal cortex (EC) (AP, −8.0; ML, 5.0; DV, 7.0), (4) piriform cortex (Pir) (AP, 1.0; ML, 4.5; DV, 7.5) and (5) symmetrical contralateral sites. The schematic representation of the location of the injection area and the recording microelectrodes is shown in the Figure 1. In three rats, multiple recording site recording probes with 100 μm space between recording sites were implanted in the CA1 (Bragin et al., 2000). Experiments were performed under freely moving conditions.
Figure 1.
A schematic representation of the location of the area of drug injection in right posterior CA3 and the recording sites in the adjacent and remote areas of the brain. LaDG and RaDG, Left and right anterior dentate gyrus; LEC, left entorhinal cortex. RPir is not in the plane of the schematic.
Baseline data acquisition.
All recordings were done while in the freely moving conditions. Beginning 1 week after surgery, wide-band recordings of electrical activity were performed for 8–10 h every day. Five 4-channel MOSFET input operational amplifiers mounted in the cable connector served to reduce cable movement artifacts. Physiological data were recorded wide band 0.1 Hz to 3.0 kHz and sampled at 10 kHz per channel (16 channels) with 12-bit precision on a Pentium PC using Run Technologies DataPac software or RC-Electronics software with parallel video monitoring of behavioral status.
Injection protocol.
After 3 d of baseline recordings, either bicuculline or kainic acid was injected into posterior CA3 with a 10 μl Hamilton syringe that extended to a needle that fit into the injection cannula, which was 0.5 mm longer than the implanted guide cannula. Bicuculline at a concentration of 100 μm was injected in a volume of 2 μl at a flow rate of 0.1 μl/10 s. Bicuculline injection was always performed first because bicuculline, at the given concentration, did not have long-term effects, and electrical activity returned to baseline within 4–6 h. Kainic acid at a concentration of 9.3 mm in a volume of 0.2 μl and a flow rate of 0.1 μl/10 s was injected 24 h later under similar conditions after preliminary 1 h recording of the baseline activity. After injection of each drug, electrical activity was recorded for 2 h. After bicuculline injection, no other pharmacological treatment was performed, but after kainic acid injection, diazepam, 5 mg/kg, was given to decrease severity of the status.
Definitions and data analysis.
The electrographic patterns after a convulsant injection were divided into two phases: an electrographic phase, which indicated a seizure onset, when persistent abnormalities of electrical activity occurred without visible changes in behavior, and a clinical phase, which was characterized by the occurrence of the behavioral components of the seizure, such as staring, oral facial twitching, wet-dog shakes, clonic forepaw movement, rearing, and loss of balance (stages 1–5 of Racine's classification) (Racine, 1972). The occurrence of behavioral seizures was detected on-line by visual observation and placing a mark on the record and verified off-line by reviewing video tapes.
Analysis of electrophysiological data was performed off-line on a Pentium computer, using DataPac software. Initially, data were reviewed by three coauthors independently and consensus was reached about the patterns during the transition period and the time of the EEG abnormality. To avoid contamination of the pattern of seizure onset by previous epileptiform activity, only the first seizure that occurred after the convulsant injection was analyzed.
Changes in power of beta, gamma, theta, and alpha activity during the transition period were displayed with Mathlab (Mathworks) time-dependent power spectral analysis. The resulting display used a relative heat map to show variations in power density. Dark blue indicated low spectral density, whereas the “hotter” colors ranging from light green, to yellow, to dark red indicated high spectral density. The original EEG was filtered from 20 to 80 Hz for the beta and gamma activity, and 0.1–12 Hz for the delta and theta activity. Patterns of beta and gamma activity were then compared with the activity of theta and alpha oscillations. High-pass 600 Hz filtered data were considered to be multiunit activity if spikes with amplitudes twice as high as the microelectrode noise existed in the record.
For perievent time histogram analysis, the maximum amplitude of field potentials was detected by the DataPac software (RUN Technologies) and used as a zero point. Multiunit activity was detected by setting a threshold at 2 SD from the middle of the record.
Current-source density analysis.
The details of this analysis were described in earlier publications (Bragin et al., 1995, 1997; Ylinen et al., 1995). Field patterns (EEG spikes, slow waves, fast oscillatory waves) were first averaged using the identified positive or negative peaks of the filtered events. Smoothing of the averaged potential profiles was accomplished by convoluting the potential as a function of depth with a three-point rolling average of the voltage in the depth. The second spatial derivative was calculated from a polynomial interpolated through the smoothed data points. Although some resistivity differences are present in the different hippocampal layers, in practice, these are not large enough to significantly modify the calculated distribution of current generators. Therefore, isotropy of the extracellular space is assumed in the current-source density (CSD) analysis. The results are, therefore, presented as the unscaled second derivative of potential as a function of depth and will be referred to as CSD. The spatial filtering procedure disproportionally attenuated fast events, such as population spikes, but the CSD profiles in this study are not intended to faithfully represent these events. The exact anatomical layers corresponding to the vertical scale of the CSD maps were reconstructed with the aid of the histologically identified recording tracks and evoked potentials. Current sinks and sources associated with the activation of the perforant path provided precise landmarks for the identification of the recording sites. In addition, unitary activity in the CA1 pyramidal layer provided further help for the depth calibration of the electrodes.
Histological procedures.
At the end of the electrophysiological experiments, rats were deeply anesthetized and perfused with 2.5% paraformaldehyde. Brains were removed and placed in 2.5% paraformaldehyde for at least 48 h before histological sectioning and Nissl staining to verify electrode placements. On the horizontal histological sections, the electrode track was traced downward until it disappeared from the section, and the last section in which each electrode's track was visible was considered the site of recording.
Results
In total, 13 kainic acid seizures and 12 bicuculline seizures were analyzed from 15 rats. Although it is known that the action of bicuculline lasts several hours, to confirm that the pattern of seizures evoked by kainic acid was not changed by previous bicuculline injection, kainic acid was applied without previous bicuculline injection in three rats.
Bicuculline injection
The mean latent period for the first EEG signs of epileptiform activity in the dentate gyrus, located 2 mm away from the point of injection in the CA3 area of hippocampus, was 3.9 ± 2.7 min (± here and everywhere is SD) after bicuculline injection.
Electrographic patterns
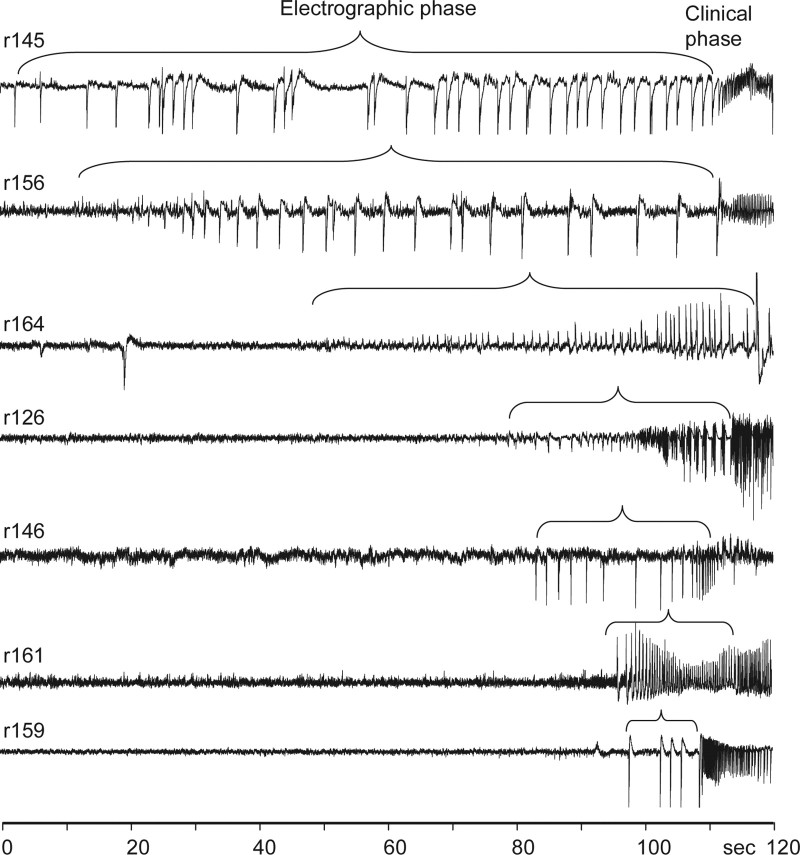
The first EEG abnormality after bicuculline injection was the occurrence of high-amplitude epileptiform EEG spikes (Fig. 2) followed by a rhythmic 5–20 Hz pattern of ictal discharge, which coincided with the appearance of the behavioral seizure. The frequency of EEG spikes before the occurrence of the clinical phase varied from 0.2 to 3 per second, and the duration of the electrographic phase varied in different rats from 12 to 110 s.
Figure 2.
Patterns of seizure onsets in the dentate gyrus induced by bicuculline injection into ipsilateral CA3 area of hippocampus. Numbers on the left indicate rat identification. Bracket above each record outlines the electrographic phase followed by the clinical phase of the seizure with the behavioral component.
The electrographic phase of seizures was characterized by a consistent increase in amplitude of epileptiform EEG spikes at the site of injection and other recorded areas of the brain. After occurrence of epileptiform events in the area of injection, brain areas with direct connections with this area became involved in the epileptiform activity, followed by areas with indirect connections. The progressive involvement of the dentate gyrus adjacent to the site of injection is shown in Figure 3A. When the first epileptiform spike occurred at the site of injection, there was no significant change in activity of the adjacent dentate gyrus. After 3–5 spikes, the spikes also occurred in the dentate gyrus, and their amplitude progressively increased toward to clinical seizure. Ipsilateral entorhinal cortex and contralateral posterior dentate gyrus, which also have direct connections with the injected CA3, showed similar “speed” of involvement in the epileptiform activity. Areas with no direct connections to injected CA3 became involved in the epileptiform discharges later than areas having direct connections. This is illustrated in Figure 3B, where the gray area outlined by the diamonds indicates the amplitude of the spikes in the injected CA3. Discharges reached maximum amplitude after 12–14 spikes and then slowly decreased toward the onset of the clinical seizure. The slope of the increase in amplitude of epileptiform spikes in areas that receive direct projections [right entorhinal cortex (REC), left posterior dentate gyrus (LpDG), and right posterior dentate gyrus (RpDG)] is less steep (Fig. 3B, graphs within the yellow area). The recruitment of more remote brain areas occurred later and reached a maximum at the time of the onset of the clinical phase (Fig. 3B, graphs within the blue area). At the time of clinical seizure onset, the amplitude of spikes at the site of injection was surprisingly smaller than earlier during the transition period.
Figure 3.
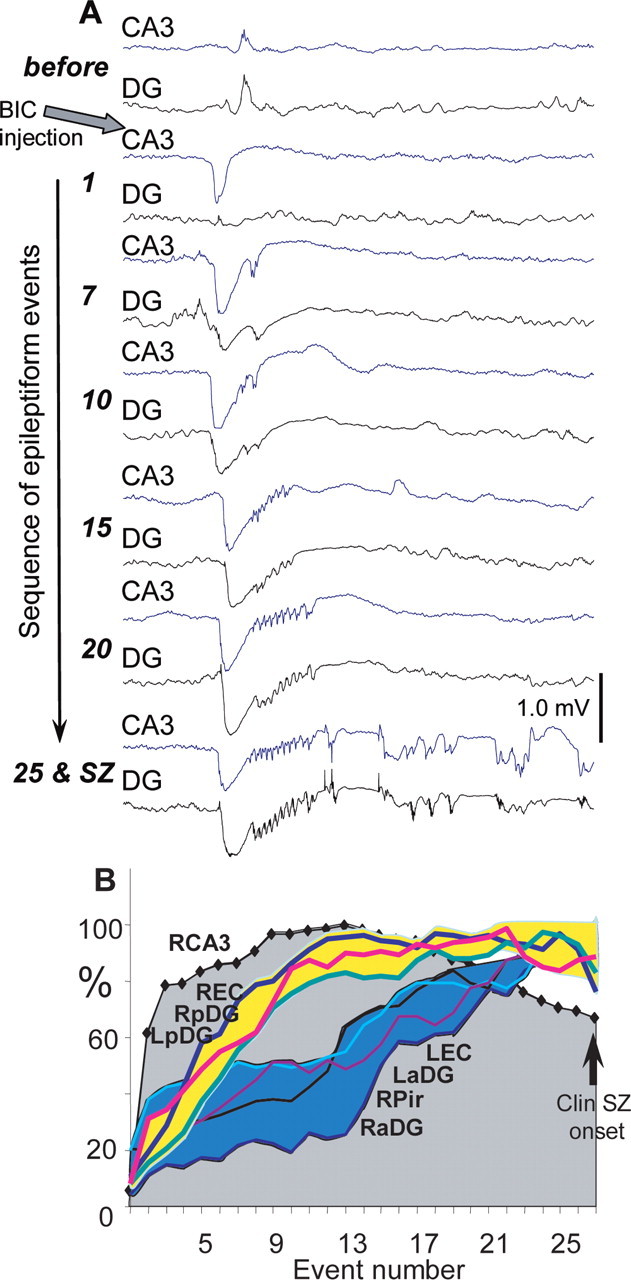
Involvement of brain areas in the epileptiform discharge evoked by injection of bicuculline into CA3. A, A sequential occurrence of epileptiform events at the point of injection (CA3) and in the adjacent dentate gyrus (as shown in Fig. 1). Numbers on the left indicate sequential number of the epileptiform event from the moment of occurrence. B, A graph of amplitude of epileptiform events during the transition period in the area of bicuculline injection (RCA3), in areas receiving monosynaptic or bisynaptic projections from CA3, LpDG, RpDG, and REC, and areas remote from the point of bicuculline injection [left entorhinal cortex (LEC), LaDG, right anterior dentate gyrus (RaDG), and RPir].
Distant spikes occurred within a time window of 30–50 ms after spike generation at the site of injection. This is illustrated in Figure 4A, where the last 10 epileptiform events before the clinical phase are superimposed and averaged. The dashed lines outline a 50 ms window, and the left one is placed at the beginning of the epileptiform event in the seizure onset area.
Figure 4.
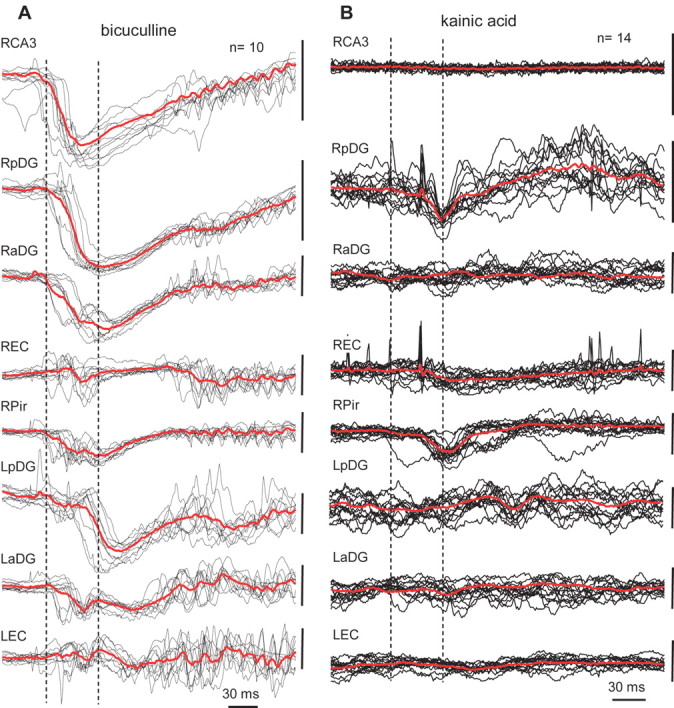
A, Examples of epileptiform events recorded in different brain areas during the electrographic phase of a seizure evoked by bicuculline injection. Events were collected and superimposed within a period of 20 s before the clinical phase of the seizure using the peak of the event generated in the right dentate gyrus as a zero point. Red lines represent average of these potentials. Dashed lines outline a 40 ms window when all events reach the maximum of amplitude. B, Examples of 14 epileptiform events from the same recording sites within a period of 20 s before the clinical phase of a seizure evoked by kainic acid injection. See schematic of electrode montage in Figure 1. The calibration bar on the right of each line is 1.0 mV.
Voltage-depth profiles
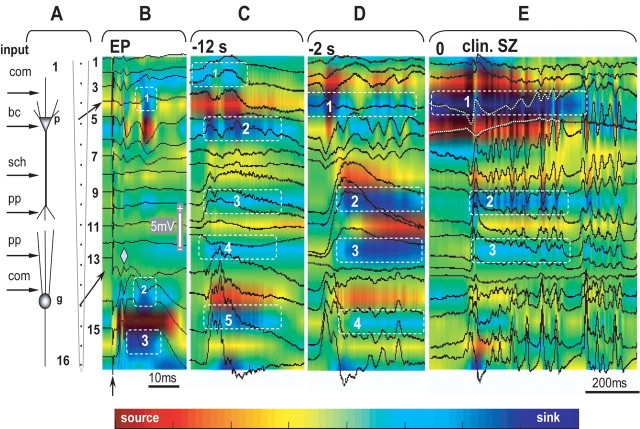
We performed recordings of seizures evoked by bicuculline injection with 16-channel silicon probes along the CA1–DG axis adjacent to the seizure onset area. After histological verification of the location of the silicon probes, the pattern of sinks and sources of evoked potentials to perforant path stimulation (Fig. 5A,B) was used as a template for localization of sinks and sources of spontaneous events occurring during the transition period and at the behavioral seizure onset. Figure 5B shows that during perforant path stimulation, the response recorded with the 16-channel probe consisted of a population spike in the dentate gyrus with phase reversal at recording site #13 (diamond) and delayed responses in the stratum radiatum of CA1. Current-source density analysis revealed that after an initial population EPSP and population spike in the dentate gyrus, three late sinks appeared in the stratum pyramidal of CA1 (Fig. 5B1, dashed box), granular layer (Fig. 5B2, dashed box), and in the hilus (Fig. 5B3, dashed box).
Figure 5.
Development of a seizure within the CA1–dentate gyrus axis after bicuculline injection into ipsilateral CA3. The location of the silicon probe is illustrated on the left side of the figure (A). The characters “p” and “g” indicate pyramidal and granular layers. The numbers indicate the recording sites from the top to the bottom. The schematic on the left indicates the location of the synaptic inputs to CA1 and DG at the area of the penetration of the silicon probe. com, Commissural; bc, basket cells; sch, Shaffer collaterals; pp, perforant path. B, Voltage-depth profiles of evoked potentials (EP) to the perforant path stimulation (arrow). The color illustrates the current-source density map, where the “hot” color indicates source and the “cold” indicates sink. C, D, Voltage-depth profiles and current-source density map of epileptiform events correspondingly 12 and 2 s before the seizure. E, Seizure onset. For details, see Results.
Voltage-depth profiles and maps of sinks and sources of epileptiform events occurring during the transition period are shown on Figure 5, C and D. The spatial pattern and power of the sinks and sources changed when approaching the clinical seizure onset. At 12 s before the clinical seizure onset (Fig. 5C), there were sinks in the stratum oriens, radiatum, and hilus (Fig. 5C1,C2,C5, dashed boxes), reflecting synaptic inputs from CA3 via Schaffer collaterals, and weaker sources in the stratum lacunosum-moleculare which receives input from entorhinal cortex (Fig. 5C3,C4, boxes). At 2 s before the clinical seizure onset (Fig. 5D), most prominent sinks appeared in the stratum moleculare of CA1 and dentate gyrus (Fig. 5D2,D3, boxes) indicating a powerful signal coming from the entorhinal cortex. At the level of the CA1 pyramidal layer, the sink appeared when there was no field electrical activity (Fig. 5D1, box). Its power significantly increased at the onset of the clinical seizure, whereas the power of the sinks in the stratum radiatum and stratum lacunose-moleculare decreased (Fig. 5E). The sink at the level of the pyramidal layer of CA1 further increased immediately before the clinical seizure onset (Fig. 5E1, box), whereas sinks in the dendritic layer and in the dentate gyrus became weaker (Fig. 5E2,E3, boxes).
This pattern of sinks and sources was observed in two of three rats. In the third rat, more obvious changes were visible in the dentate gyrus rather than in CA1, although the pattern and shape of local field potentials was similar to the examples presented in previous figures.
Neuronal discharges during the transition to electrographic and clinical seizure
In these experiments, we focused only on the measurement of synchrony of neuronal discharges in multiunit recordings during the transition period and at the seizure onset, not on the discharges of individual neurons. The synchrony of discharges of spatially separated neurons increased during EEG spikes. Neurons in the seizure onset zone and in adjacent areas increased their synchrony during the initial descending part of the epileptiform event (Fig. 6A,B) and discharged rhythmically during the ascending part. Discharges of neurons in remote areas were synchronized later, mostly during the ascending part of events.
Figure 6.
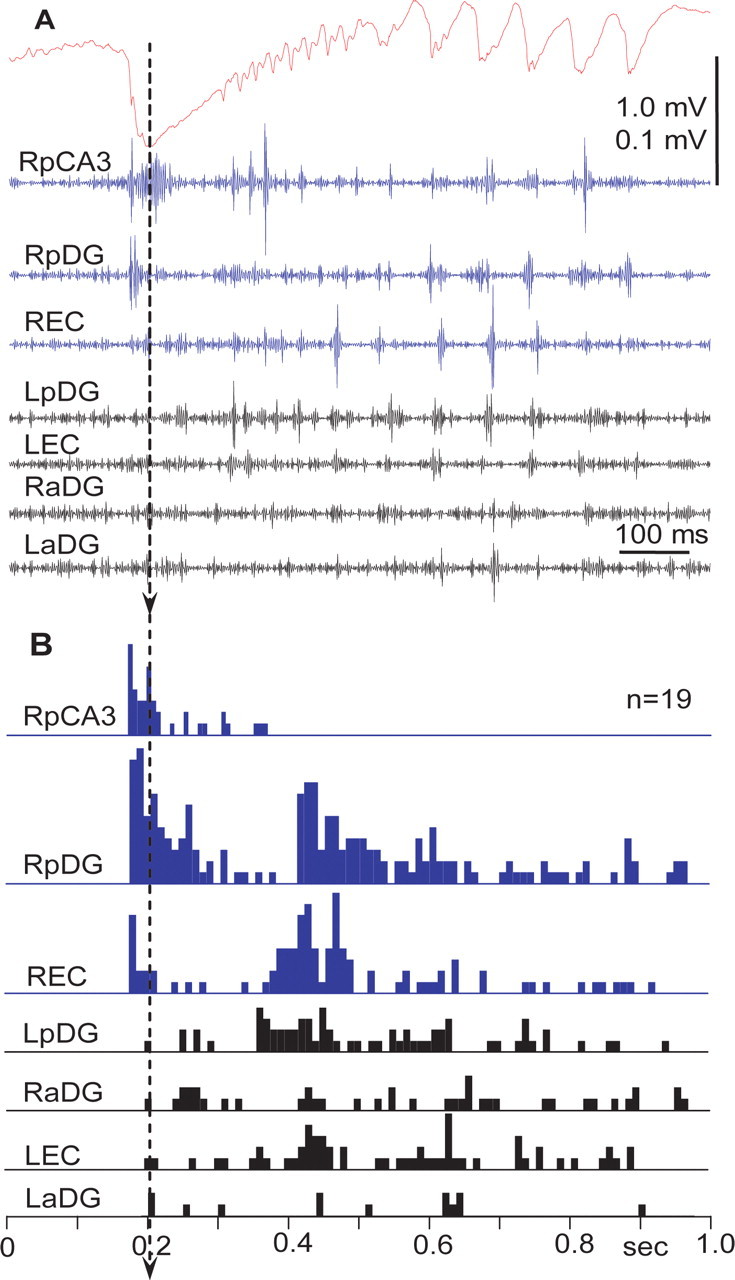
Field potentials and unit discharges during the transition period after bicuculline injection. A, Field potential (top) recorded from CA3 and multiunit activity recorded in different areas of the brain (for details, see schematic in Fig. 1). Blue lines mark areas of the brain where neuronal discharges show strong correlation with the onset of epileptiform events. B, Perievent time histograms of multiunit discharges in relation to epileptiform field potentials. The peak of the field potential is taken as the zero point. Only units located in CA3, ipsilateral posterior dentate gyrus, and entorhinal cortex show responses during onset of the epileptiform event. Other brain areas became involved in the epileptiform event later. Arrow indicates the peak of the initial wave of the epileptiform event that was used as a triggering point for construction of perievent histograms.
Kainic acid injection
The mean latent period between the time of kainic acid injection and the time at which the first epileptiform events occurred was 6.3 ± 7.6 (±STD) min, which was significantly longer than for bicuculline injection (p < 0.05).
Electrographic patterns
The pattern of electrical activity during the transition period was different from the pattern that we observed after the bicuculline injection. In 10 of 13 seizures, a gradual increase in the amplitude of the EEG signal was observed while approaching the clinical seizure onset. In one of the remaining three rats, an initial suppression of electrical activity was observed before development of epileptiform discharges, and in two rats, fast irregular spiking preceded the clinical seizure onset.
A typical pattern of seizure development after kainic acid injection into the CA3 area of hippocampus is shown in Figure 7A. The effect of kainic acid began with barely noticeable changes in the amplitude of the EEG signal at the site of injection (red line) and much more prominent increases in amplitude of the EEG in the right anterior and posterior dentate gyri as well as in the right entorhinal cortex. This pattern was similar in 10 rats when kainic acid was injected 24 h after bicuculline and in three rats when kainic acid was injected alone. The increase in amplitude of the electrical activity after kainic acid injection occurred because of an increase in the power of beta and gamma activity (Fig. 8A), as well as the occurrence and gradual increase in amplitude of multiunit discharges, which could be detected in high-pass 600 Hz recordings (Fig. 8B, the second from the top and the bottom lines). The power of EEG activity in the frequency band between 0.1 and 10 Hz decreased and disappeared during the transition period, then reappeared during the clinical seizure onset (Fig. 8A). Bicuculline injected previously in the same area of the same rat (Fig. 7B) evoked a completely different pattern during the transition period, consisting of high-amplitude EEG spikes as described in the preceding section.
Figure 7.
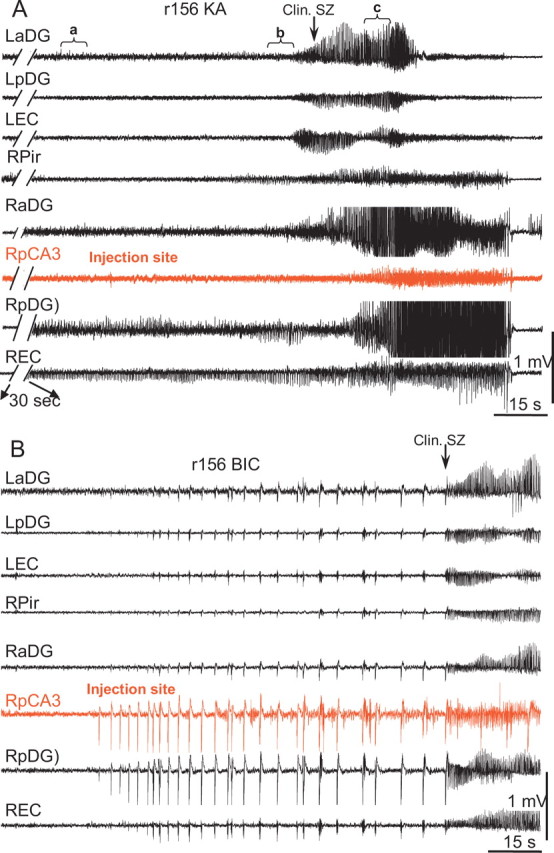
A, B, Development of seizures after injection into CA3 of kainic acid (A) and bicuculline (B). To adjust similar time for behavioral seizure occurrence, a 30 s break was used in the tracings with kainic acid injection. In the case of kainic acid injection, the most significant changes occurred outside the area of injection, whereas after bicuculline injection, the most dramatic changes occurred within the area of injection and immediate surrounding areas: RpDG and REC. LaDG and RaDG, Left and right anterior dentate gyrus, respectively; LEC, left entorhinal cortex.
Figure 8.
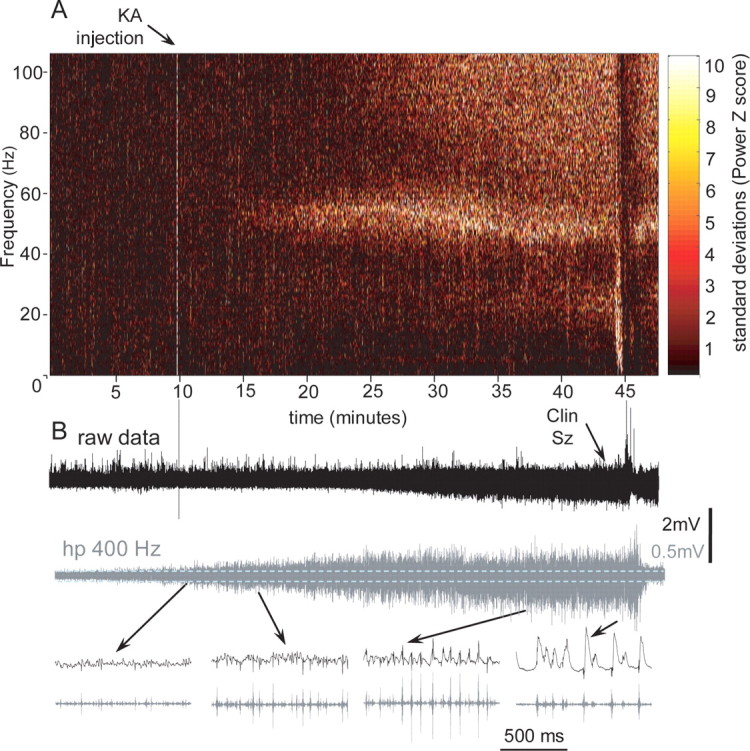
Development of a seizure after kainic acid injection. A, Color-coded power spectral maps calculated with a Fast Fourier Transform using a sliding window of 10 s with 1 s overlap. The change in the color is coded in SDs with the scale on the right side of the plot. The hot color indicates an increase in the power of specific frequency bands. B, Increase in amplitude during the transition period on the records of raw data (0.1 Hz–3 kHz) and multiunit activity (hp 400 Hz). Below, Extended fragments of records from different times during the transition period.
Event averaging showed correlative activity of other brain areas with the epileptiform activity recorded at the site of bicuculline injection (Fig. 4A) but did not reveal the same degree of correlative activity between different areas after kainic acid injection. The event-triggered averages revealed correlative activity among two to three brain areas but never among all brain areas, as was the case for bicuculline. Figure 4B illustrates event-triggered averages from the ipsilateral posterior dentate gyrus (RpDG) during the last 20 s before the clinical seizure. Only the ipsilateral piriform cortex [right Pir (RPir)] showed correlative activity with epileptiform events generated in the ipsilateral dentate gyrus. Similar data were obtained when other brain areas were used as the event triggering point.
Voltage-depth profiles
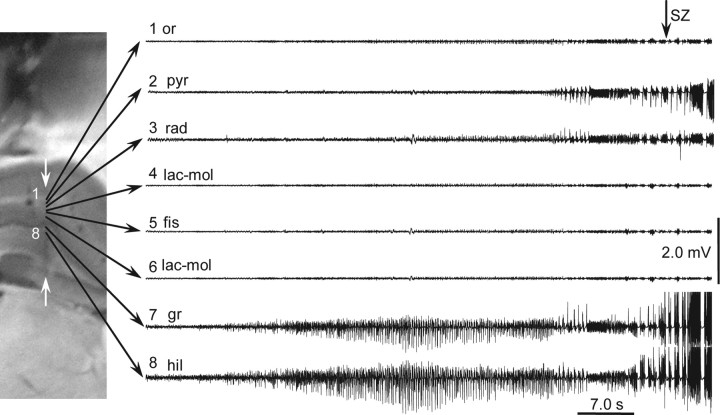
In all experiments (n = 3) with multiple recording site probes implanted into the CA1–DG area, epileptiform events after kainic acid injection began first in the DG (Fig. 9) and later in CA1. Correspondingly, all significant sinks and sources where located within these areas (data not shown).
Figure 9.
Transition to seizure after intra-CA3 kainic acid injection recorded by silicon probe implanted in CA1–dentate gyrus. Eight recording sites were selected for demonstration. Epileptiform activity first appeared in the dentate gyrus and much later in CA1. The histological section with the track of the silicon probe (white arrows) is shown on the left. or., Oriens; pyr, pyramidale; rad, radiatum; lac-mol, lacunose-moleculare; fis, fissure; gr, granular; hil, hilus.
Neuronal discharges
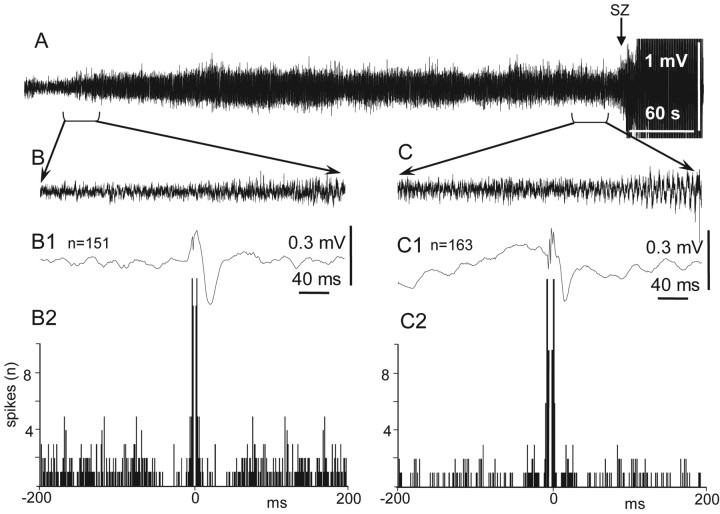
The rate of multiunit discharges increased during the electrographic phase before clinical seizures. However, in contrast to the transition period evoked by bicuculline, this increase did not show a prominent rhythmic pattern, nor were units synchronized at frequencies 15–40 Hz. As the time of clinical seizure onset neared, multiunit discharges became more frequent and coalesced into population spikes (Fig. 8B, bottom line). Event-triggered histograms show that multiunit discharges predominantly occurred at the positive phase of local gamma activity (Fig. 10B1,B2,C1,C2).
Figure 10.
Correlation of multiunit discharges with local field potentials within dentate gyrus during the transition period to seizure evoked by kainic acid injection into ipsilateral CA3. A, Six-minute-long record of the transition period and seizure. B, Thirty-second-long record at the beginning of the transition period. B1, Spike-triggered average of 151 field potentials. B2, Autocorrellogram of multiunit discharges. C, A field potential record during the last 30 s of the transition period before the seizure onset. C1, Spike-triggered average of 163 field potentials. C2, Autocorrellogram of multiunit discharges.
Discussion
The experiments presented in this study illustrate that the same area of the brain can trigger different electrographic ictal onset patterns depending on specific disruptions to the existing balance between excitatory and inhibitory components of the neuronal network. These data are important because they show that the disturbance that determines the epileptiform electrographic pattern is functional, not structural.
Both bicuculline and kainic acid are widely used as convulsants to mimic seizure activity in in vitro and in vivo experiments. These compounds bind to completely different types of receptors in the brain. The action of bicuculline is primarily on the ionotropic GABAA receptors, which are ligand-gated ion channels. It only blocks the early component of IPSPs (Edwards et al., 1990; De Koninck and Mody, 1994). The late component of IPSP is bicuculline resistant and determined by the activity of GABAB receptors via a calcium-dependent potassium current (Newberry and Nicoll, 1984). Kainic acid is a specific agonist for non-NMDA receptors which mimics the effect of glutamate. In addition to its excitation, a major effect of kainic acid is a depression of inhibitory synaptic potentials. Kainic acid reduces both fast GABA-mediated IPSPs and slow, non-GABA-mediated (GABAB) late hyperpolarizing potentials. IPSP depression correlates closely with the onset of burst potential firing in response to synaptic stimulation (Scharfman, 1994a). According to Fisher and Alger (1984), epileptiform activity in hippocampus evoked by kainic acid is caused, in part, by presynaptic depolarization blockage of IPSP pathways.
Interictal epileptiform patterns induced by other GABAA antagonists such as penicillin have been studied in vivo and in vitro (Dichter and Spencer, 1969a; Traub and Wong, 1981; Schneiderman et al., 1990). At the cellular level, these interictal events consist of an initial depolarization shift with superimposed action potentials (Dichter and Spencer, 1969b; Schwartzkroin and Prince, 1977; Dingledine and Gjerstad, 1980; Swann et al., 1986; Scharfman, 1994b; de Curtis and Avanzini, 2001). At the network level, epileptiform EEG spikes evoked by bicuculline are similar in recordings from different brain areas. They consist of initial population EPSPs with superimposed bursts of population spikes followed by powerful hyperpolarization. This pattern becomes transformed into a regular sinusoidal 5–20 Hz rhythm, before the occurrence of the clinical seizure. This transformation occurs because of a gradual decrease of the afterhyperpolarization and appearance of afterdepolarization because of accumulation of extracellular potassium (Matsumoto and Marsan, 1964a,b).
In in vitro slice preparations during the first few minutes of perfusion with bicuculline, IPSPs transiently and paradoxically increase in amplitude and as IPSPs increase, the reversal potential and latency to onset remain the same (Scharfman, 1994a). The pattern of epileptiform events which was observed in our experiments in freely moving rats was similar to that observed earlier in in vitro conditions in hippocampus (Scharfman, 1994a) and piriform cortex (De Curtis et al., 1994; Forti et al., 1997).
The weakening of early GABAA inhibition “unleashes” excitation via local excitatory collaterals and generation of hypersynchronous neuronal discharges (Miles et al., 1984). The burst events in CA3 after blockage of GABAA receptors occur because of an increase in firing of pyramidal cells via local excitatory connections (Traub and Miles, 1991; de la Prida et al., 2006).
These hypersynchronous bursts of action potentials rapidly spread from the area of generation to remote areas of the brain, leading to the occurrence of a clinical seizure. A remarkable feature of epileptiform events that occur as a result of blockade of GABAA receptors (in our case by bicuculline) is that they quickly spread from the area of generation to other adjacent and remote brain areas. This suggests that the synchrony of neuronal discharges during the initial phase of bicuculline induced epileptiform events is so high that existing feedforward inhibition (Buzsáki, 1984; Trevelyan et al., 2006, 2007), which controls the level of synchrony of the incoming signal, is not strong enough to prevent their propagation from the area of injection to other brain areas. A similar situation is frequently observed during strong electrical stimulation, when an initial burst of action potentials spreads from the area of stimulation through many brain areas causing reverberation of electrical activity.
Remaining GABAB inhibition is not fast enough to interrupt the initial synchronization of electrical activity triggered by local excitatory connections, but it is crucial for termination of neuronal firing within the epileptiform burst (de la Prida et al., 2006). GABAB inhibition then serves as an additional synchronizing mechanism. Its later inhibition promotes rebound excitation resulting in hypersynchronous discharges which progressively increase in amplitude after each event. A similar mechanism was proposed by McCormick and Contreras (2001) for generation of epileptiform events in the thalamus.
In contrast to bicuculline, kainic acid effects both principal cells and interneuronal networks. In low doses (10−8 m), it evokes a small depolarization of the pyramidal cells with an increase in the frequency of discharges, and at concentrations of 10−5 m, it causes depolarization block (Robinson and Deadwyler, 1981). At the same time, kainic acid triggers an increase in the frequency of interneuron discharges and, as a result, increases both the frequency and amplitude of IPSCs on interneurons and decreases the threshold for antidromic action potentials (Semyanov and Kullmann, 2001).
In most previous publications, the epileptiform activity evoked by kainic acid was analyzed under steady conditions after the transition period was over. Inhibition remains strong during the steady epileptiform events evoked by kainic acid application. Population activity in the frequency range 30–40 Hz, which was observed during seizures evoked by kainic acid, consisted of epileptic population spikes where pyramidal cells fired exclusively during rebound from rhythmic GABAA-mediated inhibitory postsynaptic events (Khazipov and Holmes, 2003), which was confirmed in our experiments where discharges of units were phase locked with local gamma activity (Fig. 10).
In our experiments, we focused on the network patterns which occurred preceding the clinical seizure. Basically, we mimicked a situation, for example, when the level of glutamate in the extracellular space increases at the site of spontaneous seizure generation, because of impairment of glia buffering functions or other mechanisms.
The overall electrographic pattern of the transition period before the clinical seizure was recorded in our experiments was similar to what was described by Medvedev et al. (2000) after systemic kainic acid injection and by Akaike et al. (2001) after intrahippocampal kainic acid injection. A simultaneous effect on the excitatory and inhibitory networks leads to an increase in the power of beta–gamma frequencies of field activity representing firing of population spikes at these frequencies (Fig. 8) during the transition period.
The process of propagation of epileptiform activity after kainic acid injection could be a function of the initial increase in the volume of tissue involving in spike discharges, at the area of injection, as a result of increased discharges of principal cells and interneurons, which evoke a similar process in target areas. This process increases gradually and breaks down into generalized activity, which triggers the occurrence of the behavioral abnormalities causing the clinical seizure.
The latency of occurrence of epileptiform EEG events is longer after kainic acid injection than after bicuculline, which correspond to earlier data on differences in the latency of seizure occurrence after systemic and intraventricular injection of these compounds (Ben-Ari et al., 1981; Gruenthal et al., 1986). The longer latent period after kainic acid injection may indicate that feedforward inhibition is more effective in prevention of the spread of pathological activity from one area to another, than in case of the sharp epileptiform events which occur with bicuculline injection. This suggests ways in which disturbances in the excitatory–inhibitory balance can be more or less modulated by intrinsic seizure suppressing mechanisms. However, additional studies are required to better understand the means by which the brain prevents the spread of epileptiform activity from one area to another.
Relevance of observed patterns of seizure activity to clinical practice
This manuscript is one of many studies on seizures induction by pharmacological manipulation with the long-term goal of application of results to clinical practice. At present, it is premature to assume that the clinical reality is so simple as to be completely explained by the results from the experiments described in this study. However, if systematic studies that include analysis of electrographic seizure onset patterns evoked by different receptor agonists and antagonists acting on ligands of different ion channels are carefully classified, such data might produce a basis for clinical trials to determine if electrographic seizure onset patterns in human could be a principal factor for prescribing specific antiepileptic drugs (AEDs). Given that different types of epileptic seizures have different electrographic onset patterns, differential AED responses related to these patterns could inform specific selection of appropriate AED treatment.
To date, except for the classical generalized 3 per second spike and wave, electrographic seizure onset patterns are not considered useful for prescribing AEDs, because these patterns are believed to contain little information about the mechanisms triggering the seizure activity. It is reasonable to assume, however, that different electrographic patterns reflect different triggering mechanisms. Elucidation of the glia–neuronal mechanisms responsible for the generation of unique seizure onset patterns could lead to more precise therapy targeting specific functional components of the epileptogenic network.
Footnotes
This work was supported by National Institutes of Health Grants NS 02808 and NS 33310. We thank Michel Le van Quyen and Richard Staba for help with data analysis and discussion and Tony Fields and Josephine Ruidera for their excellent assistance with the experiments described in this manuscript.
References
- Akaike K, Tanaka S, Tojo H, Fukumoto S, Imamura S, Takigawa M. Kainic acid-induced dorsal and ventral hippocampal seizures in rats. Brain Res. 2001;900:65–71. doi: 10.1016/s0006-8993(01)02252-1. [DOI] [PubMed] [Google Scholar]
- Ben-Ari Y, Tremblay E, Riche D, Ghilini G, Naquet R. Electrographic, clinical and pathological alterations following systemic administration of kainic acid, bicuculline or pentetrazole: metabolic mapping using the deoxyglucose method with special reference to the pathology of epilepsy. Neuroscience. 1981;6:1361–1391. doi: 10.1016/0306-4522(81)90193-7. [DOI] [PubMed] [Google Scholar]
- Bragin A, Jandó G, Nádasdy Z, van Landeghem M, Buzsáki G. Dentate EEG spikes and associated interneuronal population bursts in the hippocampal hilar region of the rat. J Neurophysiol. 1995;73:1691–1705. doi: 10.1152/jn.1995.73.4.1691. [DOI] [PubMed] [Google Scholar]
- Bragin A, Penttonen M, Buzsáki G. Termination of epileptic afterdischarge in the hippocampus. J Neurosci. 1997;17:2567–2579. doi: 10.1523/JNEUROSCI.17-07-02567.1997. [DOI] [PMC free article] [PubMed] [Google Scholar]
- Bragin A, Engel J, Jr, Wilson CL, Vizentin E, Mathern GW. Electrophysiologic analysis of a chronic seizure model after unilateral hippocampal KA injection. Epilepsia. 1999;40:1210–1221. doi: 10.1111/j.1528-1157.1999.tb00849.x. [DOI] [PubMed] [Google Scholar]
- Bragin A, Hetke J, Wilson CL, Anderson DJ, Engel J, Jr, Buzsáki G. Multiple site silicon-based probes for chronic recordings in freely moving rats: implantation, recording and histological verification. J Neurosci Methods. 2000;98:77–82. doi: 10.1016/s0165-0270(00)00193-x. [DOI] [PubMed] [Google Scholar]
- Bragin A, Wilson C, Fields T, Fried I, Engel JJ. Analysis of seizure onset on the basis of wideband EEG recordings. Epilepsia. 2005;46:59–63. doi: 10.1111/j.1528-1167.2005.01010.x. [DOI] [PubMed] [Google Scholar]
- Buzsáki G. Feed-forward inhibition in the hippocampal formation. Prog Neurobiol. 1984;22:131–153. doi: 10.1016/0301-0082(84)90023-6. [DOI] [PubMed] [Google Scholar]
- de Curtis M, Avanzini G. Interictal spikes in focal epileptogenesis. Prog Neurobiol. 2001;63:541–567. doi: 10.1016/s0301-0082(00)00026-5. [DOI] [PubMed] [Google Scholar]
- De Curtis M, Biella G, Forti M, Panzica F. Multifocal spontaneous epileptic activity induced by restricted bicuculline ejection in the piriform cortex of the isolated guinea pig brain. J Neurophysiol. 1994;71:2463–2476. doi: 10.1152/jn.1994.71.6.2463. [DOI] [PubMed] [Google Scholar]
- De Koninck Y, Mody I. Noise analysis of miniature IPSCs in adult rat brain slices: properties and modulation of synaptic GABAA receptor channels. J Neurophysiol. 1994;71:1318–1335. doi: 10.1152/jn.1994.71.4.1318. [DOI] [PubMed] [Google Scholar]
- de la Prida LM, Huberfeld G, Cohen I, Miles R. Threshold behavior in the initiation of hippocampal population bursts. Neuron. 2006;49:131–142. doi: 10.1016/j.neuron.2005.10.034. [DOI] [PubMed] [Google Scholar]
- Dichter M, Spencer WA. Penicillin-induced interictal discharges from the cat hippocampus. I. Characteristics and topographical features. J Neurophysiol. 1969a;32:649–662. doi: 10.1152/jn.1969.32.5.649. [DOI] [PubMed] [Google Scholar]
- Dichter M, Spencer WA. Penicillin-induced interictal discharges from the cat hippocampus. II. Mechanisms underlying origin and restriction. J Neurophysiol. 1969b;32:663–687. doi: 10.1152/jn.1969.32.5.663. [DOI] [PubMed] [Google Scholar]
- Dingledine R, Gjerstad L. Reduced inhibition during epileptiform activity in the in vitro hippocampal slice. J Physiol. 1980;305:297–313. doi: 10.1113/jphysiol.1980.sp013364. [DOI] [PMC free article] [PubMed] [Google Scholar]
- Edwards FA, Konnerth A, Sakmann B. Quantal analysis of inhibitory synaptic transmission in the dentate gyrus of rat hippocampal slices: a patch-clamp study. J Physiol. 1990;430:213–249. doi: 10.1113/jphysiol.1990.sp018289. [DOI] [PMC free article] [PubMed] [Google Scholar]
- Engel J., Jr . Seizures and epilepsy. Philadelphia: Davis; 1989. [Google Scholar]
- Fisher RS, Alger BE. Electrophysiological mechanisms of kainic acid-induced epileptiform activity in the rat hippocampal slice. J Neurosci. 1984;4:1312–1323. doi: 10.1523/JNEUROSCI.04-05-01312.1984. [DOI] [PMC free article] [PubMed] [Google Scholar]
- Forti M, Biella G, Caccia S, de Curtis M. Persistent excitability changes in the piriform cortex of the isolated guinea-pig brain after transient exposure to bicuculline. Eur J Neurosci. 1997;9:435–451. doi: 10.1111/j.1460-9568.1997.tb01621.x. [DOI] [PubMed] [Google Scholar]
- Gruenthal M, Armstrong DR, Ault B, Nadler JV. Comparison of seizures and brain lesions produced by intracerebroventricular kainic acid and bicuculline methiodide. Exp Neurol. 1986;93:621–630. doi: 10.1016/0014-4886(86)90181-0. [DOI] [PubMed] [Google Scholar]
- Khazipov R, Holmes GL. Synchronization of kainate-induced epileptic activity via GABAergic inhibition in the superfused rat hippocampus in vivo. J Neurosci. 2003;23:5337–5341. doi: 10.1523/JNEUROSCI.23-12-05337.2003. [DOI] [PMC free article] [PubMed] [Google Scholar]
- Matsumoto H, Marsan CA. Cortical interictal phenomena in experimental epilepsy: interictal manifestations. Exp Neurol. 1964a;9:286–304. doi: 10.1016/0014-4886(64)90025-1. [DOI] [PubMed] [Google Scholar]
- Matsumoto H, Marsan CA. Cortical cellular phenomena in experimental epilepsy: ictal manifestations. Exp Neurol. 1964b;25:305–326. doi: 10.1016/0014-4886(64)90026-3. [DOI] [PubMed] [Google Scholar]
- McCormick DA, Contreras D. On the cellular and network bases of epileptic seizures. Annu Rev Physiol. 2001;63:815–846. doi: 10.1146/annurev.physiol.63.1.815. [DOI] [PubMed] [Google Scholar]
- Medvedev A, Mackenzie L, Hiscock JJ, Willoughby JO. Kainic acid induces distinct types of epileptiform discharge with differential involvement of hippocampus and neocortex. Brain Res Bull. 2000;52:89–98. doi: 10.1016/s0361-9230(00)00239-2. [DOI] [PubMed] [Google Scholar]
- Miles R, Wong RK, Traub RD. Synchronized afterdischarges in the hippocampus: contribution of local synaptic interactions. Neuroscience. 1984;12:1179–1189. doi: 10.1016/0306-4522(84)90012-5. [DOI] [PubMed] [Google Scholar]
- Newberry NR, Nicoll RA. A bicuculline-resistant inhibitory post-synaptic potential in rat hippocampal pyramidal cells in vitro. J Physiol. 1984;348:239–254. doi: 10.1113/jphysiol.1984.sp015107. [DOI] [PMC free article] [PubMed] [Google Scholar]
- Paxinos G, Watson C. The rat brain in stereotaxic coordinates. New York: Academic; 1997. [DOI] [PubMed] [Google Scholar]
- Racine RJ. Modification of seizure activity by electrical stimulation. II. Motor seizure. Electroencephalogr Clin Neurophysiol. 1972;32:281–294. doi: 10.1016/0013-4694(72)90177-0. [DOI] [PubMed] [Google Scholar]
- Robinson JH, Deadwyler SA. Kainic acid produces depolarization of CA3 pyramidal cells in the vitro hippocampal slice. Brain Res. 1981;221:117–127. doi: 10.1016/0006-8993(81)91067-2. [DOI] [PubMed] [Google Scholar]
- Scharfman HE. Paradoxical enhancement by bicuculline of dentate granule cell IPSPs evoked by fimbria stimulation in rat hippocampal slices. Neurosci Lett. 1994a;168:29–33. doi: 10.1016/0304-3940(94)90408-1. [DOI] [PMC free article] [PubMed] [Google Scholar]
- Scharfman HE. EPSPs of dentate gyrus granule cells during epileptiform bursts of dentate hilar “mossy” cells and area CA3 pyramidal cells in disinhibited rat hippocampal slices. J Neurosci. 1994b;14:6041–6057. doi: 10.1523/JNEUROSCI.14-10-06041.1994. [DOI] [PMC free article] [PubMed] [Google Scholar]
- Schneiderman JH, Arnold D, Advani A. Different changes in spontaneous field potential oscillations precede epileptiform bursting in hippocampal slices perfused with penicillin or reduced magnesium. Brain Res. 1990;533:275–285. doi: 10.1016/0006-8993(90)91350-p. [DOI] [PubMed] [Google Scholar]
- Schwartzkroin PA, Prince DA. Penicillin-induced epileptiform activity in the hippocampal in vitro prepatation. Ann Neurol. 1977;1:463–469. doi: 10.1002/ana.410010510. [DOI] [PubMed] [Google Scholar]
- Semyanov A, Kullmann DM. Kainate receptor-dependent axonal depolarization and action potential initiation in interneurons. Nat Neurosci. 2001;4:718–723. doi: 10.1038/89506. [DOI] [PubMed] [Google Scholar]
- Spencer SS, Guimaraes P, Katz A, Kim J, Spencer D. Morphological patterns of seizures recorded intracranially. Epilepsia. 1992;33:537–545. doi: 10.1111/j.1528-1157.1992.tb01706.x. [DOI] [PubMed] [Google Scholar]
- Swann JW, Brady RJ, Friedman RJ, Smith EJ. The dendritic origins of penicillin-induced epileptogenesis in CA3 hippocampal pyramidal cells. J Neurophysiol. 1986;56:1718–1738. doi: 10.1152/jn.1986.56.6.1718. [DOI] [PubMed] [Google Scholar]
- Traub RD, Miles R. Neuronal networks of the hippocampus. Cambridge, UK: Cambridge UP; 1991. Collective behaviors of the CA3 network: spontaneous oscillations and synchronized synaptic potentials; pp. 157–203. [Google Scholar]
- Traub RD, Wong RK. Penicillin-induced epileptiform activity in the hippocampal slice: a model of synchronization of CA3 pyramidal cell bursting. Neuroscience. 1981;6:223–230. doi: 10.1016/0306-4522(81)90058-0. [DOI] [PubMed] [Google Scholar]
- Trevelyan AJ, Sussillo D, Watson BO, Yuste R. Modular propagation of epileptiform activity: evidence for an inhibitory veto in neocortex. J Neurosci. 2006;26:12447–12455. doi: 10.1523/JNEUROSCI.2787-06.2006. [DOI] [PMC free article] [PubMed] [Google Scholar]
- Trevelyan AJ, Sussillo D, Yuste R. Feedforward inhibition contributes to the control of epileptiform propagation speed. J Neurosci. 2007;27:3383–3387. doi: 10.1523/JNEUROSCI.0145-07.2007. [DOI] [PMC free article] [PubMed] [Google Scholar]
- Velasco AL, Wilson CL, Babb TL, Engel J., Jr Functional and anatomic correlates of two frequently observed temporal lobe seizure-onset patterns. Neural Plast. 2000;7:49–63. doi: 10.1155/NP.2000.49. [DOI] [PMC free article] [PubMed] [Google Scholar]
- Ylinen A, Bragin A, Nádasdy Z, Jandó G, Szabó I, Sik A, Buzsáki G. Sharp wave-associated high-frequency oscillation (200 Hz) in the intact hippocampus: network and intracellular mechanisms. J Neurosci. 1995;15:30–46. doi: 10.1523/JNEUROSCI.15-01-00030.1995. [DOI] [PMC free article] [PubMed] [Google Scholar]


