

Abstract
Purified γδ T cells are primed directly in response to pathogen associated molecular patterns (PAMPs) to better respond to secondary signals and increase expression of chemokine and activation-related genes. Transcripts encoding the innate receptor Nod2 were detected in bovine and human γδ T cells. Nod2 is the intracellular receptor for muramyl dipeptide (MDP), functions in regulating innate activities, and was thought to be expressed primarily in APCs. The response of γδ T cells to MDP was analyzed by microarray, Q- PCR, proteome array and functional priming assays. MDP had a consistent priming effect on γδ T cells, characterized by changes in transcripts and enhanced proliferation response to secondary signaling. Knockdown experiments implicated Nod2 as the receptor for MDP in γδ T cell enriched bovine PBLs. The results indicate priming of γδ T cells by MDP, and offer definitive evidence of the expression of functional Nod2 in γδ T cells.
Keywords: Nod2, muramyl dipeptide, γδ T cells, priming
Introduction
Nucleotide-binding oligomerization domain (Nod) proteins are related to plant disease resistance genes and were recognized as cytoplasmic receptors for bacterial products [1]. Nod1 and Nod2 are receptors for peptidoglycan (PGN)-derived peptides g-D-glutamyl-meso-diaminopimelic acid from gram negative bacterial peptidoglycan [2;3], and muramyl dipeptide (MDP) [4;5], respectively. While Nod1 is more widely expressed in epithelial cells and APCs, Nod2 was primarily detected in APCs, such as monocytes and dentritic cells, in intestinal epithelial cells and only at very low levels in CD3+ T cells [6-8]. Nod2 mutations are associated with Crohn's disease, an inflammatory bowel disease in humans [9;10], suggesting that this gene has a critical function in immune regulation in the gut.
γδ T cells recognize unprocessed or non-peptide antigens, respond rapidly to infection, and localize to mucosal surfaces [11]. These characteristics suggest that although γδ T cells are lymphocytes, they express a myriad of innate phenotypic characteristics. We analyzed the transcriptional profiles of purified in vitro-expanded human γδ T cells after exposure to LPS [12] as well as differences in human γδ T cell subsets [13] using microarrays. Transcripts encoding the innate receptor Nod 2 were detected in purified human and bovine γδ T cells in these analyses. Peripheral blood of adult humans contains very few γδ T cells that require expansion in culture before microarray analysis, whereas in neonatal calves up to 70% of the circulating lymphocytes are γδ T cells. mRNAs encoding numerous innate receptors, including Nod2, were more readily detected in γδ T cells isolated directly from peripheral blood of neonatal calves, suggesting that expansion in culture, or the adult source of human γδ T cells may diminish their expression. Furthermore, a similar, yet more robust, response to pathogen associated molecular patterns (PAMPs), was detected using freshly isolated neonatal bovine γδ T cells [12]. Lacking the reagents to detect Nod2 protein in bovine γδ T cells, we sought to characterize their response to the Nod2 agonist MDP.
We have recently defined γδ T cell priming as the subtle activation response of γδ T cells to these and other non-TCR agonists. Briefly, γδ T cell priming is characterized by increases in specific proteins, primarily GM-CSF, IL-8, and IL-2Rα, in a response that is not overt activation, but enables more rapid responses to secondary signals[14-17]. To gain an unbiased view of the effect of MDP on bovine γδ T cells, we analyzed changes in global transcription in response to MDP stimulation. Results suggested a consistent change in gene expression, and that γδ T cells were also primed by MDP to better respond to secondary signals, such as IL-2. Results using human cells also supported a direct response of human γδ T cells to MDP. In vitro priming assays demonstrated the functional significance of this priming response, and its specificity to γδ T cells. Using RNAi silencing in primary bovine PBLs, the expression of the Nod2 transcripts was reduced, which resulted in diminished responses to MDP by γδ T cell enriched populations. These data indicated a distinct priming response of γδ T cells to MDP that was dependent on expression of Nod2.
Materials and Methods
Cell isolation
All use of animals was in accordance with National Institute of Health guidelines and approved by the MSU Institutional Animal Care Institutional Review Board of Montana State University. Bovine blood was collected from young calves and PBLs separated using Histopaque 1077 (Sigma) as previously described [18]. PBLs were monocyte depleted by adherence to plastic flasks for 1 hour in cRPMI media (10% fetal bovine serum in RPMI supplemented with 1% each essential amino acids, penicillin/streptomycin, L-glutamine and 10mM HEPES). γδ T cells from 2 calves (150 and 151) were sorted with MACS magnetic bead system (Miltenyi Biotec) as previously described [12] to a purity of >98%. Cells from several additional calves, including calf 129, were not monocyte depleted and were sorted using a VANTAGE SE cell sorter (BD Immunocytometry Systems) to >98% purity, as previously described [18] after labeling with a pan γδ antibody (GD3.8) conjugated to FITC. Cells were rested overnight before stimulation. Human γδ T cells were expanded in culture and sorted as we have previously described [12].
Bovine oligonucleotide microarray
Sorted bovine γδ T cells from 3 different calves (Calf numbers 150, 151, and 129) were stimulated with either PBS or MDP (BioChemika, ≥99.0% pure by thin layer chromatography, 10 µg/ml) for 4 hours. The cells were lysed and genomic DNA was homogenized using QIAshredder spin columns (Qiagen). RNA was extracted using the RNeasy mini columns (Qiagen) according to the manufacturer's protocol for use in either microarray or real time RT-PCR analysis. Prior to amplification for microarrays, RNA quality was confirmed using an Agilent 2100 bioanalyzer (Palo Alto, CA). RNA was extracted, amplified and used to probe (six different Affymetrix GeneChip® Bovine Genome Arrays (Affymetrix, Santa Clara, CA) that represents approximately 23,000 transcripts based on Unigene build 57 (April 2004) and Genbank sequences. cDNA amplification and synthesis of biotin-labeled cRNA was performed with the One-cycle target labeling protocol with 1.7 µg total RNA as described in the GeneChip® Expression Analysis Technical Manual (March 2004). Hybridization was performed with 15 µg cRNA. Washing and staining was performed in the GeneChip® Fluidics Station 450 using the Midi_euk2v3 protocol. Chip scans were performed on the Affymetrix GeneChip® Scanner 3000. GeneChip® Operating Software (GCOS v.1.1, Affymetrix) [19;20] was used for data collection. Further analysis was done using GeneSpring (Silicon Genetics) with RMA preprocessing and Microsoft Excel. All data was normalized to the median and filtered on expression levels (>100 raw) and fold change (>2 fold change).
Real time RT-PCR was performed as previously described [18]. Primers were designed with Primer Express, primer design software from Applied Biosystems. The reverse transcription reactions were performed with Superscript III (Invitrogen) and approximately 700ng of RNA according to the manufacturer's protocol. Relative specific mRNA in the γδ T cells was quantified by measuring SYBR green incorporation during real time quantitative RT-PCR using the relative standard curve method. Primers specific for 18S RNA were used as the endogenous control. The PCR was set up in triplicate, cycled and data collected on the MyiQ Real Time PCR Detection System (Biorad).
Supernatant protein measurement
In vitro expanded as previously described [12], VANTAGE-purified γδ T cells from seven different human subjects were densely plated (5×10⁶ cells per ml) and stimulated for 22-24 hours. The supernatant fluids from these cultures were collected, frozen at -80° C, and sent to Pierce for Searchlight Proteome array analysis to measure representative protein concentrations as suggested by the microarray data.
Priming Assay
Cells used in the priming assay were either histopaque purified bovine PBMCs that were monocyte depleted using either MACS human CD14 microbeads (Miltenyi Biotec) and LD depletion columns as described by the manufacturer, or by adherence to plastic flasks, or VANTAGE sorted bovine peripheral blood γδ T cells. Cells were washed with HANKS buffer and loaded with 0.25 µM carboxyfluorescein diacetate succinimidyl ester (CFSE) in the dark for 5 minutes. Cells were assayed in duplicate or triplicate wells, depending on the sort yield and primed with PBS or MDP (10µg/ml) in XVIVO (serum free media, Cambrex, Walkersville, MD) media for 48 hours at 37°C. Priming with LPS was used as a positive control (data not shown, [14]). Priming media was removed and replaced with media containing IL-2 (1 ng/ml) then cells were cultured another 72 hours at 37°C. Cells were then stained with GD3.8 (anti-pan-γδ TCR), or GD3.8 and GD3.5 (specific for WC1, a bovine γδ T cell subset specific marker) for subset specific staining [18] using standard flow cytometry techniques and read on a FACS Calibur HTS using high-throughput settings. Gates were placed on lymphocyte populations in scatter plots, GD3.8+ cells, and GD3.5+ and GD3.5- cells as appropriate for analysis of CFSE staining.
RNAi knockdown of Nod2
Three different dicer substrate RNAi Duplexes specific for bovine Nod2 were designed and synthesized commercially (Integrated DNA Technologies). The duplexes were electroporated into monocyte depleted (by adherence to plastic) bovine PBLs using the Nucleofector Device and Human T Cell Kit (Amaxa, Program T-23) according to the manufacturer's protocols. Standard flow cytometric evaluation following Nucelofector electroporation with an Alexa 488 labeled control siRNA (Qiagen), suggested transfection was very efficient, but lethal to most cells. To achieve sufficient live transfected cells and to eliminate variation between cuvettes, 4 cuvettes each with 5×10⁶ cells were used for each siRNA transfection. Electroporated cells were incubated for 18 hours in XVIVO (serum-free) media, then underlaid with approximately 5ml Histopaque 1077, and centrifuged at 1600 rpm for 20 minutes to separate live and dead cells. Live cells (as determined by forward and side scatter using flow cytometry) were aspirated from Histopaque, and either suspended in XVIVO at 1×10⁶ cells per ml and stimulated with PBS, LPS or MDP for 4 hours for Nod2 functional assessment, or immediately lysed in Buffer RLT (Qiagen) for knockdown assessment, both were determined in cells from at least 3 different calves. RNA extraction and real time RT-PCR were then performed as described above. Fold change in GM-CSF expression after stimulation with MDP relative to PBS in cells transfected with siRNAs specific for either TLR4 or Nod2 was used as the indicator of Nod2 function.
Statistical analyses
Statistical analyses were performed with a two-tailed paired t test. The proteome array was run in duplicate and the average protein concentrations for cells stimulated with PBS or MDP from the 7 different subjects were compared using the paired t test. In the Priming assay, mean values of percent of gated cells were calculated with 1 to 3 experimental replicates (sample wells) from at least 3 individual calves (biological replicates). Extensive experience with this assay indicates that the percent of gated cells follows an approximately normal distribution. Percentages of gated proliferating (IL-2 supplemented) purified total γδ T cells and γδ T cell subsets treated with PBS were compared to those treated with MDP. For assessment of functional Nod2 after knockdown with siRNA in independent assays using cells from 3 different calves, fold change in GM-CSF after stimulation with MDP relative to PBS in cells transfected with siRNAs specific for TLR4 or Nod2 were also compared using a two-tailed paired t test.
Microarray Data
The microarray data discussed in this publication have been deposited in NCBIs Gene Expression Omnibus (GEO, http://www.ncbi.nlm.nih.gov/geo/) and are accessible through GEO Series accession number GSE6918.
Results
Transcripts encoding Nod2 are expressed in bovine and human γδ T cells
Following the initial detection of Nod2 by microarray in purified human γδ T cells [12], we confirmed the expression of Nod2 message in both human and bovine γδ T cells by real time PCR. Multiple different primer sets specific for the Nod2 mRNA, and with no homology to any other NLR- or NOD family member, from each species were designed. Each primer set resulted in a specific dissociation peak, generated by ramping from 60° to 90° after the PCR cycling, indicating that the PCR fluorescent signal was from a specific product (data not shown). Despite a very subtle differential expression of Nod2 following LPS stimulation in expanded, purified human γδ T cells, and similar to transcripts encoding other innate receptors in bovine γδ T cells [12], Nod2 was not differentially expressed following treatment with its agonist, MDP (data not shown).
Microarrays comparing PBS and MDP-stimulated sorted bovine γδ T cells demonstrate consistent changes
Given that purified bovine and human γδ T cells consistently expressed transcripts encoding Nod2, and lacking the reagents to detect the protein in bovine cells, we sought to elucidate the transcriptional response of γδ T cells to MDP. Microarray experiments were performed with RNA extracted from purified bovine γδ T cells treated with either PBS or MDP. Three separate microarray experiments with two treatments each (6 chips) were performed with cells from three different calves (129, 150 and 151). As expected with genetically dissimilar animals, gene expression varied between individuals. However, a few genes demonstrated similar changes in all individuals tested (Table 1). Thus, a distinct response to MDP by purified γδ T cells was apparent.
Table 1.
The same set of genes was upregulated in MDP-stimulated γδ T cells from 3 different calves. Affymetrix GeneChip Bovine Genome microarray data were normalized to the median and filtered by average of >2 fold change in the Genespring software package.
| Gene Name | Average Fold Change | Description |
|---|---|---|
| NFκB Inhibitors | ||
| Bt.8227.1.S1_at | 2.386 | molecule possessing ankyrin repeats induced by lipopolysaccharide (MAIL) |
| Bt.9027.1.S1_at | 2.005 | nuclear factor of kappa light polypeptide gene enhancer in B-cells inhibitor, alpha |
| Bt.10867.1.S1_at | 2.000 | molecule possessing ankyrin repeats induced by lipopolysaccharide (MAIL) |
| Activation | ||
| Bt.509.1.S1_at | 2.934 | colony stimulating factor 2 (CSF2) (GM_CSF) |
| Bt.5605.3.S1_at | 2.682 | myristylated alanine-rich protein kinase C substrate (MARCKS) |
| Bt.4310.1.A1_at | 2.618 | B cell activation protein BL34 – human |
| Bt.5605.2.S1_at | 2.389 | myristylated alanine-rich protein kinase C substrate (MARCKS) |
| Bt.3941.1.S1_at | 2.306 | interleukin 2 receptor, alpha (IL2RA) |
| Bt.5605.1.S1_at | 2.293 | myristylated alanine-rich protein kinase C substrate (MARCKS) |
| Bt.20012.1.S1_at | 2.184 | Tumor necrosis factor receptor superfamily member 18 precursor |
| Bt.9083.1.S1_at | 2.153 | TNFR-associated protein EBI6 – human |
| Bt.8544.1.S1_at | 2.076 | CD69 antigen (p60, early T-cell activation antigen) (CD69) |
| Bt.19745.1.S1_at | 2.010 | polymerase II elongation factor ELL2 |
| Transcription Factors/Signalling molecules | ||
| Bt.18057.1.A1_at | 2.732 | Zinc finger protein 40 (PRDII-BF1) |
| Bt.16123.2.S1_a_at | 2.172 | Serinethreonine-protein kinase Sgk |
| Bt.19517.1.S1_at | 3.153 | ERB3_HUMAN Receptor protein-tyrosine kinase erbB-3 precursor |
| Unknown Function | ||
| Bt.23123.1.S1_at | 2.410 | Class B basic helix-loop-helix protein 2 (bHLHB2) (DEC1) (SHARP-2) |
| Bt.3339.1.S1_at | 2.355 | Semaphorin 4G precursor |
| Bt.142.1.S1_at | 2.341 | neutrophil cytosolic factor 1 (chronic granulomatous disease, autosomal 1) |
| Bt.8676.1.S1_at | 2.244 | MLN 62 protein |
The change in gene expression in γδ T cells in response to MDP was not overt activation, consistent with γδ T cell priming, and was clearly distinct from that described for APCs [21]. Several interesting transcripts were differentially expressed in γδ T cells derived from all three calves (Table 1). Several T cell activation genes such as the IL-2 receptor α (IL-2Rα), and CD69 had increased expression after MDP stimulation of γδ T cells. Increased expression of GM-CSF and MARCKS, a substrate for protein kinase C [22] represented multiple times, were also indicative of priming. The primary outcome of MDP sensing in APCs is expression of inflammatory proteins downstream of the transcription factor NFκB [8]. Similarly, increased transcript expression of two genes responsible for inhibition of NFκB-induced transcription, namely molecule possessing ankyrin repeats induced by lipopolysaccharide (MAIL or IκBζ; [23] and nuclear factor of kappa light polypeptide gene enhancer in B-cells inhibitor, alpha (NFKBIA or IκBα; [24] were also indicative of NFκB activity.
Confirmation of microarray experiments
Due to the variation between individuals and species, we were compelled to measure transcript and protein changes in bovine and human γδ T cells from multiple individuals. Differential expression of bovine GM-CSF after MDP treatment of purified bovine γδ T cells from six different calves was measured by real time RT-PCR (Table 2). Consistent with the microarray data, there was a statistically significant increase in bovine GM-CSF transcripts following MDP stimulation. We also analyzed supernatant fluids collected from 24 hour stimulation of purified human γδ T cells derived from 7 different individuals using Searchlight Proteome array analysis (Table 2). These cells had been expanded in vitro for 2 to 3 weeks in the presence of IL-2 and γδ TCR agonist IPP, then sorted to near purity using direct antibody staining. Even though these cells were already heavily activated, we required an enriched/expanded and sorted source of human γδ T cells to detect direct responses to MDP, even if only by a subset of the population. Presence of contaminating cells was expected to confound measurement of a direct response of γδ T cells to MDP. There was no significant change in the supernatant fluid concentration of several cytokine proteins (GM-CSF, Mip1α, Mip1β, lymphotactin, RANTES, TNFα, IFNγ). Although a change in at least GM-CSF was expected, as supported by the bovine data, likely the already activated state human cells rendered them unable to further alter these genes in response to MDP. However, statistically significant increases in supernatant protein concentration of two protein markers of activation in human γδ T cells was detected; the soluble form of the IL-2α receptor [25] and shed L-selectin [26]. These results indicated a direct effect of MDP on sorted human γδ T cells, albeit different from the effect on bovine cells sorted from peripheral blood, likely because of the difference in prior culture conditions. Nonetheless, independent assays measuring both transcripts and protein confirmed direct activation of γδ T cells by MDP. In vitro priming.
Table 2.
Results of real time PCR analysis of bovine γδ T cells and Proteome array analysis of supernatant fluids from expanded purified human γδ T cells confirm a direct effect of MDP on γδ T cells.
| Bovine Real time PCR (average of triplicate) | Human supernatant protein analysis (average of duplicate) | |||||
|---|---|---|---|---|---|---|
| Relative signal (GM-CSF/18S) Stimulation with: | IL2R (pg/ml) | L-Selectin (pg/ml) | ||||
| Donor #: | PBS | MDP | PBS | MDP | PBS | MDP |
| 1 | 162.57 | 218.53 | 68.27 | 73.85 | 398.09 | 711.39 |
| 2 | 12.04 | 96.29 | 192.38 | 201.99 | 1949.01 | 2325.88 |
| 3 | 17.53 | 37.65 | 530.30 | 571.75 | 1895.68 | 1693.33 |
| 4 | 7.60 | 26.28 | 213.27 | 240.30 | 3201.63 | 3480.85 |
| 5 | 19.20 | 68.28 | 241.35 | 239.61 | 4151.10 | 4610.95 |
| 6 | 40.82 | 67.96 | 342.55 | 383.44 | 1159.18 | 1654.14 |
| 7 | 498.10 | 542.38 | 2251.94 | 2695.20 | ||
| Two tailed paired t test p value | 0.0096 | 0.0169 | 0.0140 | |||
The increase in IL-2Rα expression in both bovine and human γδ T cells suggested that MDP stimulation rendered γδ T cells more sensitive to further activation by IL-2. To measure this functional response, monocyte-depleted bovine PBLs were pre-treated with PBS or MDP and then stimulated with IL-2 alone and allowed to proliferate. MDP alone had no impact on γδ T cell proliferation (data not shown). However, as shown in Figure 1, MDP was effective in priming a proportion of the γδ T cells to proliferate in response to IL-2. This initial experiment suggested that the proliferation response was specific to γδ T cells, and did not occur in non-γδ lymphocytes. To determine if this response could be due to a direct response of γδ T cells to MDP, the assay was repeated using purified (>97% pure) bovine γδ T cells (Figure 1, lower panel). Multiple replicates using sorted cells from three different calves indicated statistically significant priming by MDP of purified γδ T cells as indicated by subsequent proliferation after addition of IL-2. Proliferation after addition of IL-2 to MDP pretreated cells was similar in priming assays using either and PBLs or purified γδ T cells, suggesting a minimal effect of the sorting procedure on the capacity of cells to proliferate in this assay. This result underscores the functional relevance of the increase in IL-2Rα responsiveness following MDP stimulation and indicates that γδ T cells are primed by MDP to better respond to the secondary signal, IL-2.
Figure 1.
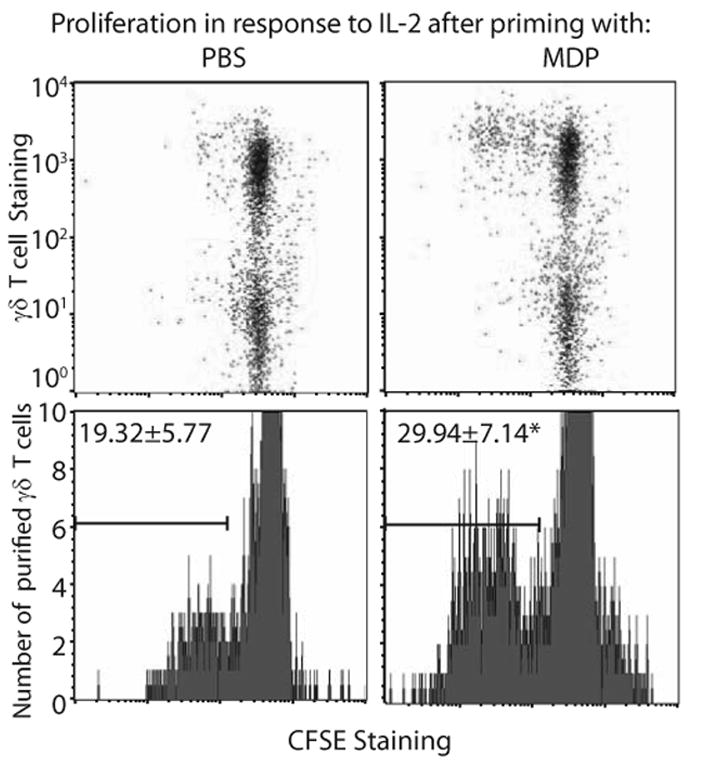
Bovine γδ T cells are primed with MDP to proliferate after addition of IL-2. Top panel. Dot blot staining of monocyte-depleted bovine lymphocytes suggests that the proliferative response to MDP is specific to γδ T cells. Lower panel. Representative CSFE staining of purified γδ T cells primed with PBS or MDP proliferating in the presence of IL-2 is shown. Mean values of percent of gated cells for multiple experimental replicates (PBS n=8, MDP n=7) with cells from at least 3 individual calves are shown. Statistical analyses of priming assay data were performed with a two-tailed paired t test, and determined a significant difference between PBS and MDP treated cells (*p=0.0093).
Since only a fraction of the γδ T cell population expanded in the priming assay, it was of interest to attempt to determine if the defined bovine γδ T cell subsets exhibited differential responses to MDP. Bovine γδ T cells are frequently divided into 2 subsets, a primarily GD3.5-, CD8+ subset that is characteristic of those that localize to the gut mucosa, and is found in smaller fractions in peripheral blood, and a GD3.5+, CD8- γδ T cell subset that is found primarily in circulation, and has inflammatory characteristics [18;27-29]. Thus, a similar priming assay was utilized to determine the proliferation of the GD3.5- (largely CD8+) and GD3.5+ γδ T cell subsets after treatment with MDP. Using cells isolated from 3 different calves, there was significant proliferation of both subsets of γδ T cells after priming with MDP (compared to PBS) and addition of IL-2 (p values of less than 0.0001 in each case, data not shown). There was a very small but significantly greater proliferation response for GD3.5- γδ T cells than there was for GD3.5+ γδ T cells (p=0.0018). However, because the difference was very minor, and both subsets effectively responded to MDP, this approach clearly did not define the specific subset of bovine γδ T cells that was responsible for the majority of the response to MDP.
Knockdown of Nod2 disrupts GM-CSF expression after MDP stimulation
To demonstrate expression of Nod2 in bovine γδ T cells, we utilized RNAi in primary bovine lymphocytes to knockdown Nod2 and observe a decrease in its function, increase in GM-CSF transcripts after stimulation with MDP. Change in GM-CSF was selected as a consistent indicator of Nod2 function in bovine γδ T cells because it had one of the highest fold changes by microarray and was confirmed by PCR with cells from multiple calves. Efforts were made for low toxicity delivery of siRNAs to bovine cells, but other than electroporation, other delivery methods were highly inefficient and would require extensive downstream manipulation. Initially an Alexa 488-labeled control siRNA was used to assess the efficiency of Nucleofector protocols (Amaxa) to electroporate resting primary bovine lymphocytes. The resulting delivery was highly efficient, with 85-95% of gated lymphocytes fluorescent, but also highly lethal. Thus, to obtain sufficient cells for RNA isolation, several cuvettes were used for each treatment, electroporated cells were pooled, and the live cells isolated by centrifugation through histopaque (data not shown). The resulting cells were 75-85% γδ T cells, with no evidence of monocyte contamination as detected by FACS, but we have no explanation for this enrichment. These healthy (based on forward and side scatter profiles) and efficiently transfected cells were used for RNA isolation to assess knockdown of Nod2 and decrease of its function.
Initial experiments focused on specificity of Nod2 knockdown, following the recommendations for specificity in RNAi experiments [30]. To closely monitor off target RNAi effects, and because introduction of any ssRNA would be expected to change gene expression in cells, we used a similar dicer substrate siRNA specific for TLR4 as a negative control, and measured changes in TLR4 transcript expression compared to Nod2 transcripts. Three different dicer substrate siRNAs were designed and used to knock down Nod2 transcript expression relative to TLR4 transcript expression in the same cells. Each siRNA tested reduced Nod2 transcripts relative to TLR4 transcripts, and suggested specificity of the siRNAs to Nod2 knockdown without perturbation of TLR4 expression (data not shown). A further indication of specificity is the ability to titrate out the effect of the siRNA. This was performed using cells from 3 different calves, and, despite variation between individuals, the knockdown effect was reduced by titration in each case relative to using the same amount of siRNA specific for TLR4 (data not shown).
A decreased functional response was observed in Nod2 siRNA transfected cells compared to those transfected with siRNAs specific for TLR4. Cells were isolated and electroporated then treated with either PBS or MDP for 4 hours, followed by RNA extraction and analysis by real time RT-PCR. Using cells from 3 different calves, those transfected with siRNAs specific for Nod2 had an expected, but variable reduction in Nod2 transcript expression, and a consistently diminished increase in expression of GM-CSF in response to MDP treatment, compared to cells transfected with TLR4-specific siRNAs (Figure 2). Despite variation between individual calves, the functional difference between cells transfected with Nod2 and TLR4 siRNA was statistically significant. Enriched γδ T cells transfected with TLR4 had an average increase in GM-CSF in response to MDP of 5.7 fold whereas in those transfected with Nod2 siRNAs the fold change in GM-CSF was 3.7 (p=0.0121). These results suggest that the increase in GM-CSF expression in response to MDP is dependent on the level of the Nod2 transcript, implicating the function of Nod2 in sensing MDP in γδ T cells.
Figure 2.

Functional effect of Nod2 knockdown. Data from a representative experiment shows the Nod2 and GM-CSF transcript levels in live cells isolated after Nucleofector electroporation and stimulation with either PBS or MDP. When Nod2 was effectively knocked down (53.95 knock down) in enriched bovine γδ T cells, the change in GM-CSF transcript expression was decreased (average fold change after MDP stimulation of 3.5) compared to cells transfected with TLR4 (average fold change 5.7, p=0.0121).
Discussion
We have provided evidence for direct MDP detection by bovine and human γδ T cells and for the function of Nod2 in sensing MDP in γδ T cell-enriched bovine lymphocytes. The detection of Nod 2 transcripts in γδ T cells is consistent with and may delineate the minor subset contributing to the weak Nod2 transcript signal detected in CD3+ T cells [7]. Members of the NALP family of proteins, structurally similar to the Nods, have also been described as MDP detectors that do not involve the NFκB pathway [31]. Although not an aim of this study, the implications of expression of these Nod-related proteins in γδ T cells may warrant additional investigation. Nonetheless, the capacity to sense MDP further defines γδ T cells, or at least subsets of these cells, as innate cells capable of direct pathogen detection.
The change in gene expression in γδ T cells in response to stimulation with MDP was consistent between individual calves, despite differences in genetic and experiential backgrounds, which are obstacles not encountered with inbred mouse populations. Thus, the genes differentially expressed following MDP stimulation are likely to be biologically relevant in the general cattle population. Interestingly, increases in GM-CSF transcript expression were consistently detected in cells isolated from numerous additional animals and we now consider increases in GM-CSF transcripts our most consistent marker of an important transitional step in γδ T cell activation referred to as priming [14-16].
Bovine γδ T cells become somewhat activated, or primed with the potential to become activated as evidenced by the increased activity of IL-2Rα, and expression of MARCKS, the substrate for PKC, after MDP stimulation. In addition, bovine γδ T cells increased expression of transcripts encoding several inhibitors of NFκB upon stimulation with MDP, but not other NFκB dependent genes indicative of an overt inflammatory response, typical of monocytes stimulated with MDP [6]. These results suggest that a distinct pathway is involved in the regulation of transcription in γδ T cells following MDP stimulation. Although membrane recruitment of Nod2 has been described [32], the relatively minor response of γδ T cells compared to macrophages to MDP may be related to their differences in phagocytosis/pinocytosis function that limits delivery of the agonist to its internal receptor.
Using RNAi to reduce the expression of Nod2 transcripts in γδ T cell-enriched bovine lymphocytes, we demonstrated a relationship between Nod2 transcript levels and the MDP-induced increase in GM-CSF expression. We utilized every reasonable effort to ensure specificity of the RNAi experiments, short of rescuing the expression of Nod2, which was not practical in these primary lymphocytes [30]. The siRNA was titrated to its lowest active level, and 3 unrelated siRNAs specific for bovine Nod2 were effective in decreasing Nod2 transcript expression. We chose to use siRNAs specific for TLR4, with similar expression patterns as Nod2 [12], but unrelated function, as a negative control to facilitate measurement of the differential effects of the two siRNAs on their specific targets. The significantly reduced MDP-induced GM-CSF production in γδ T cell-enriched PBLs transfected with siRNAs specific for Nod2, and not TLR4, suggested that γδ T cells likely utilize Nod2 to sense MDP.
Mutations to Nod2 confer an increased susceptibility to Crohn's disease, an inflammatory bowel disease, suggesting a critical regulatory role for Nod2 in the gut mucosa. The assumption that Nod2 is primarily expressed in APCs [8] may overlook the response of γδ T cells, a key population in mucosal inflammation in multiple disease models [11]. We have demonstrated that a subset of γδ T cells are directly stimulated by MDP resulting in a primed state characterized by enhanced responses to secondary signals likely to be encountered in vivo. As large numbers of γδ T cells localize to mucosal surfaces of the body, their expression of Nod2 and response to MDP may have a role in pathogen sensing, mucosal homeostasis and inflammation.
Acknowledgments
Jill Graff is acknowledged for technical assistance. This investigation was funded by NIH COBRE grant P20 RR020185 NIH NIAID, Contract No. HHSN266200400009/N01-AI40009 and support from the Murdock Charitable Trust.
abbreviations
- Nod
Nucleotide-binding oligomerization domain
- PAMPs
pathogen associated molecular patterns
- MDP
muramyl dipeptide
- PGN
peptidoglycan
- IL-2Rα
IL-2 receptor α
Footnotes
Conflict of Interest M.A. Jutila holds shares in LigoCyte Pharmaceuticals, which together with Montana State University, holds a National Institutes of Health contract that funded, in part, the work presented in this article.
Publisher's Disclaimer: This is a PDF file of an unedited manuscript that has been accepted for publication. As a service to our customers we are providing this early version of the manuscript. The manuscript will undergo copyediting, typesetting, and review of the resulting proof before it is published in its final citable form. Please note that during the production process errors may be discovered which could affect the content, and all legal disclaimers that apply to the journal pertain.
References
- 1.Inohara N, Ogura Y, Nunez G. Nods: a family of cytosolic proteins that regulate the host response to pathogens. Curr Opin Microbiol. 2002;5:76–80. doi: 10.1016/s1369-5274(02)00289-8. [DOI] [PubMed] [Google Scholar]
- 2.Chamaillard M, Hashimoto M, Horie Y, Masumoto J, Qiu S, Saab L, Ogura Y, Kawasaki A, Fukase K, Kusumoto S, Valvano MA, Foster SJ, Mak TW, Nunez G, Inohara N. An essential role for NOD1 in host recognition of bacterial peptidoglycan containing diaminopimelic acid. Nat Immunol. 2003;4:702–707. doi: 10.1038/ni945. [DOI] [PubMed] [Google Scholar]
- 3.Girardin SE, Boneca IG, Carneiro LAM, Antignac A, Jehanno M, Viala J, Tedin K, Taha MK, Labigne A, Zahringer U, Coyle AJ, Bertin J, Sansonetti PJ, Philpott DJ. Nod1 detects a unique muropeptide from Gram-negative bacterial peptidoglycan. Science. 2003;300:1584–1587. doi: 10.1126/science.1084677. [DOI] [PubMed] [Google Scholar]
- 4.Girardin SE, Boneca IG, Viala J, Chamaillard M, Labigne A, Thomas G, Philpott DJ, Sansonetti PJ. Nod2 is a general sensor of peptidoglycan through muramyl dipeptide (MDP) detection. J Biol Chem. 2003;278:8869–8872. doi: 10.1074/jbc.C200651200. [DOI] [PubMed] [Google Scholar]
- 5.Inohara N, Ogura Y, Fontalba A, Gutierrez O, Pons F, Crespo J, Fukase K, Inamura S, Kusumoto S, Hashimoto M, Foster SJ, Moran AP, Fernandez-Luna JL, Nunez G. Host recognition of bacterial muramyl dipeptide mediated through NOD2. J Biol Chem. 2003;278:5509–5512. doi: 10.1074/jbc.C200673200. [DOI] [PubMed] [Google Scholar]
- 6.Ogura Y, Inohara N, Benito A, Chen FF, Yamaoka S, Nunez G. Nod2, a Nod1/Apaf-1 family member that is restricted to monocytes and activates NF-kappa B. J Biol Chem. 2001;276:4812–4818. doi: 10.1074/jbc.M008072200. [DOI] [PubMed] [Google Scholar]
- 7.Gutierrez O, Pipaon C, Inohara N, Fontalba A, Ogura Y, Prosper F, Nunez G, Fernandez-Luna JL. Induction of Nod2 in Myelomonocytic and Intestinal Epithelial Cells via Nuclear Factor-kappa B Activation. J Biol Chem. 2002;277:41701–41705. doi: 10.1074/jbc.M206473200. [DOI] [PubMed] [Google Scholar]
- 8.Strober W, Murray PJ, Kitani A, Watanabe T. Signalling pathways and molecular interactions of NOD1 and NOD2. Nat Rev Immunol. 2006;6:9–20. doi: 10.1038/nri1747. [DOI] [PubMed] [Google Scholar]
- 9.Ogura Y, Bonen DK, Inohara N, Nicolae DL, Chen FF, Ramos R, Britton H, Moran T, Karaliuskas R, Duerr RH, Achkar JP, Brant SR, Bayless TM, Kirschner BS, Hanauer SB, Nunez G, Cho JH. A frameshift mutation in NOD2 associated with susceptibility to Crohn's disease. Nature. 2001;411:603–606. doi: 10.1038/35079114. [DOI] [PubMed] [Google Scholar]
- 10.Hugot JP, Chamaillard M, Zouali H, Lesage S, Cezard JP, Belaiche J, Almer S, Tysk C, O'Morain CA, Gassull M, Binder V, Finkel Y, Cortot A, Modigliani R, Laurent-Puig P, Gower-Rousseau C, Macry J, Colombel JF, Sahbatou M, Thomas G. Association of NOD2 leucine-rich repeat variants with susceptibility to Crohn's disease. Nature. 2001;411:599–603. doi: 10.1038/35079107. [DOI] [PubMed] [Google Scholar]
- 11.Hayday AC. [gamma][delta] cells: a right time and a right place for a conserved third way of protection. Ann Rev Immunol. 2000;18:975–1026. doi: 10.1146/annurev.immunol.18.1.975. [DOI] [PubMed] [Google Scholar]
- 12.Hedges JF, Lubick KJ, Jutila MA. γδ T cells respond directly to pathogen associated molecular patterns. J Immunol. 2005;174:6045–6053. doi: 10.4049/jimmunol.174.10.6045. [DOI] [PubMed] [Google Scholar]
- 13.Kress E, Hedges JF, Jutila MA. Distinct gene expression in human V[delta]1 and V[delta]2 [gamma][delta] T cells following non-TCR agonist stimulation. Mol Immunol. 2006;43:2002–2011. doi: 10.1016/j.molimm.2005.11.011. [DOI] [PubMed] [Google Scholar]
- 14.Hedges JF, Buckner DL, Rask KM, Kerns HMM, Jackiw LO, Trunkle TC, Pascual DW, Jutila MA. Mucosal lymphatic-derived γδ T cells respond early to experimental Salmonella enterocolits by increasing expression of IL-2Rα. Cell Immunol. 2007;246:8–16. doi: 10.1016/j.cellimm.2007.04.006. [DOI] [PMC free article] [PubMed] [Google Scholar]
- 15.Holderness J, Jackiw L, Kimmel E, Kerns HMM, Radke M, Hedges JF, Petrie C, McCurley P, Glee PM, Palecanda A, Jutila MA. Select plant tannins induce IL-2Rα up-regulation and augment cell division in γδ T cells. J Immunol. 2007;179:6468–6478. doi: 10.4049/jimmunol.179.10.6468. [DOI] [PubMed] [Google Scholar]
- 16.Jutila MA, Holderness J, Graff JC, Hedges JF. Antigen Independent priming: A transitional response of bovine γδ T cells to infection. Anim Health Res Rev. 2007;9:47–57. doi: 10.1017/S1466252307001363. [DOI] [PubMed] [Google Scholar]
- 17.Holderness J, Hedges JF, Daughenbaugh KF, Kimmel E, Graff JC, Freedman B, Jutila MA. Response of γδ T cells to plant-derived tannins. Crit Rev Immunol. 2008;28:377–402. doi: 10.1615/critrevimmunol.v28.i5.20. [DOI] [PMC free article] [PubMed] [Google Scholar]
- 18.Hedges JF, Cockrell D, Jackiw L, Meissner N, Jutila MA. Differential mRNA expression in circulating γδ T lymphocyte subsets defines unique tissue-specific functions. J Leukoc Biol. 2003;73:306–314. doi: 10.1189/jlb.0902453. [DOI] [PubMed] [Google Scholar]
- 19.Liu WM, Mei R, Di X, Ryder TB, Hubbell E, Dee S, Webster TA, Harrington CA, Ho MH, Baid J, Smeekens SP. Analysis of high density expression microarrays with signed-rank call algorithms. Bioinformatics. 2002;18:1593–1599. doi: 10.1093/bioinformatics/18.12.1593. [DOI] [PubMed] [Google Scholar]
- 20.Hubbell E, Liu WM, Mei R. Robust estimators for expression analysis. Bioinformatics. 2002;18:1585–1592. doi: 10.1093/bioinformatics/18.12.1585. [DOI] [PubMed] [Google Scholar]
- 21.Kobayashi KS, Chamaillard M, Ogura Y, Henegariu O, Inohara N, Nunez G, Flavell RA. Nod2-dependent regulation of innate and adaptive immunity in the intestinal tract. Science. 2005;307:731–734. doi: 10.1126/science.1104911. [DOI] [PubMed] [Google Scholar]
- 22.Hartwig JH, Thelen M, Resen A, Janmey PA, Nairn AC, Aderem A. MARCKS is an actin filament crosslinking protein regulated by protein kinase C and calcium-calmodulin. Nature. 1992;356:618–622. doi: 10.1038/356618a0. [DOI] [PubMed] [Google Scholar]
- 23.Kitamura H, Kanehira K, Okita K, Morimatsu M, Saito M. MAIL, a novel nuclear I[kappa]B protein that potentiates LPS-induced IL-6 production. FEBS Letters. 2000;485:53–56. doi: 10.1016/s0014-5793(00)02185-2. [DOI] [PubMed] [Google Scholar]
- 24.Ito CY, Adey N, Bautch VL, Baldwin AS. Structure and Evolution of the HumanIKBAGene. Genomics. 1995;29:490–495. doi: 10.1006/geno.1995.9977. [DOI] [PubMed] [Google Scholar]
- 25.Morris JC, Waldmann TA. Advances in interleukin 2 receptor targeted treatment. Ann Rheum Dis. 2000;59:i109–i114. doi: 10.1136/ard.59.suppl_1.i109. [DOI] [PMC free article] [PubMed] [Google Scholar]
- 26.Sanchez-Garcia J, Atkins C, Pasvol G, Wilkinon RJ, Colston MJ. Antigen-driven shedding of L-selectin from human gammadelta T cells. Immunology. 1996;89:213–219. doi: 10.1046/j.1365-2567.1996.d01-729.x. [DOI] [PMC free article] [PubMed] [Google Scholar]
- 27.MacHugh ND, Mburu JK, Carol MJ, Wyatt CR, Orden JA, Davis WC. Identification of two distinct subsets of bovine gamma delta T cells with unique cell surface phenotype and tissue distribution. Immunology. 1997;92:340–345. doi: 10.1046/j.1365-2567.1997.00350.x. [DOI] [PMC free article] [PubMed] [Google Scholar]
- 28.Wijngaard P, MacHugh ND, Metzelaar M, Romberg S, Bensaid A, Pepin L, Davis WC, Cleavers H. Members of the novel WC1 gene family are differentially expressed on subsets of bovine CD4-CD8- gamma delta T lymphocytes. J Immunol. 1994;152:3476–3482. [PubMed] [Google Scholar]
- 29.Meissner N, Radke J, Hedges JF, White M, Behnke M, Bertolino S, Abrahamsen MS, Jutila MA. Comparative gene expression analysis in circulating γδ T-cell subsets defines distinct immunoregulatory phenotypes and reveals their relationship to myeloid cells. J Immunol. 2003;170:356–364. doi: 10.4049/jimmunol.170.1.356. [DOI] [PubMed] [Google Scholar]
- 30.Cullen BR. Enhancing and confirming the specificity of RNAi experiments. Nat Methods. 2006;3:677–681. doi: 10.1038/nmeth913. [DOI] [PubMed] [Google Scholar]
- 31.Martinon F, Agostini L, Meylan E, Tschopp J. Identification of bacterial muramyl dipeptide as activator of the NALP3/cryopyrin inflammasome. Current Biology. 2004;14:1929–1934. doi: 10.1016/j.cub.2004.10.027. [DOI] [PubMed] [Google Scholar]
- 32.Barnich N, Aguirre JE, Reinecker HC, Xavier R, Podolsky DK. Membrane recruitment of NOD2 in intestinal epithelial cells is essential for nuclear factor-{kappa}B activation in muramyl dipeptide recognition. J Cell Biol. 2005;170:21–26. doi: 10.1083/jcb.200502153. [DOI] [PMC free article] [PubMed] [Google Scholar]