

Abstract
The objective of this study was to compare population pharmacokinetic (PPK) models of escitalopram developed from dosage times recorded by a medication event monitoring system (MEMS) versus the reported times from patients with diagnosed depression. 73 patients were prescribed doses of 10,15 or 20 mg of escitalopram daily. Sparse blood samples were collected at weeks 4, 12, 24 and 36 with 185 blood samples obtained from the 73 patients. NONMEM was used to develop a PPK model based on dosing records obtained from MEMS prior to each blood sample time. A separate PPK analysis using NONMEM was performed for the same population using the patient reported last dosing time and assuming a steady state condition as the model input. Objective function values (OFV) and goodness of fit plots were used as model selection criteria. The absolute mean difference in the last dosing time between MEMS and patient reported times was 4.48 ± 10.12 hrs. A one compartment model with first-order absorption and elimination was sufficient for describing the data. Estimated oral clearance (CL/F) to escitalopram was statistically insensitive to reported dosing methods, (MEMS vs. patient reported: 25.5 (7.0%) vs. 26.9 (6.6%) L/hr). However, different dosing report methods resulted in significantly different estimates on the volume of distribution (V/F) (MEMS vs. Patient reported: 1000 (17.3%) vs. 767 (17.5%) L) and the absorption rate constant Ka (MEMS vs. Patient reported: 0.74 (45.7%) vs. 0.51 (35.4%) hr−1) for escitalopram. Furthermore, the parameters estimated from the MEMS method were similar to literature reported values for V/F (∼1100L) and Ka (∼ 0.8−0.9 hr−1) arising from traditional PK approaches.
Keywords: medication event monitoring system (MEMS), population pharmacokinetics, escitalopram, selective serotonin reuptake inhibitors (SSRI), antidepressant
INTRODUCTION
Population pharmacokinetic (PPK) analysis is a robust tool for obtaining valuable pharmacokinetic information from large clinical trials, where protocols may be limited to sparse drug concentration sampling 1. However, it is difficult to obtain accurate dosing times from these clinical trials, as most dosages are not taken under direct observation. This is especially true for outpatients with chronic disease 2-4. Population PK model input comprised of the patient reported last dosing time and a steady state assumption is the most commonly used approach in PPK analysis with sparse sampling 2-5. Unfortunately, a significant drawback to this approach is the steady state assumption which neglects partial adherence of outpatients to prescribed medication regimens, dosing frequency, and the timing of doses 3, 4. In fact, only an average of 43−78% adherence has been reported for outpatients with chronic treatment 6. As such, the assumption of a steady state condition during PPK modeling may not be appropriate for data sets containing patients with partial adherence.
One method for obtaining accurate outpatient dosing records is the medication event monitoring system (MEMS), an electronic system which has been commercially available since 1989 6. MEMS detects medication bottle opening and closing over time and records these events 2. It is one of the most effective indirect methods for accurately determining the patient adherence 2, 4, 6, 7. MEMS generated information provides an alternative method for model development, providing detailed dosing records and allowing the assumption of a steady state condition to be avoided 2, 5. This approach has been successfully employed for PPK analysis with a lopinavir study providing for the recreation of the entire concentration versus time profile over the entire treatment duration 5.
Escitalopram, the S-enantiomer of antidepressant citalopram, is a commonly prescribed selective serotonin reuptake inhibitors (SSRI) 8, 9. It selectively binds to the primary reuptake inhibitory site of the serotonin transporter to produce its antidepressant effects 10, 11. Escitalopram has activity against both depression 8, 11-14 and anxiety disorders 8, 15, 16. After oral administration, maximum plasma concentrations of escitalopram are reached in about 4 hours 9, 17, 18 with a half-life of 27−32 hours 9, 17, 18. Therefore, it is commonly given as a once daily dose 17, 18.
The goal of this study was to compare the PPK parameter estimates using input profiles based on dosage history times recorded by the MEMS versus input profiles based on the last patient reported dosage time and assuming a steady state condition. Two separate PPK models for escitalopram were developed based on these separate sets of recorded dosing times with a subsequent comparison of PPK model parameters. In addition, due to difficulties commonly encountered during model development for orally administered drug, two separate model parameterizations were evaluated involving either a fixed or estimated oral compartment absorption rate (Ka).
SUBJECTS AND METHODS
Subjects and Sampling
Escitalopram PK data was obtained from the Pittsburgh patients in a large randomized clinical trial (Clinical Trials Gov Identifier: NCT00073697) conducted at two international treatment sites, including the University of Pittsburgh and the University of Pisa, Italy (http://clinicaltrials.gov/ct/show/NCT00073697). In summary, 73 patients, aged 18−66 years old were recruited. The patients were in an episode of non-psychotic major depression defined by the DSM-IV diagnosis and were not receiving any other anti-depressant treatments. A daily dose of 10, 15, or 20 mg of escitalopram was prescribed to patients over 69−441 days. Blood samples (10 ml) for the determination of escitalopram drug concentrations were collected at weeks 4, 12, 24 and 36, and a total of 185 samples were available for the data analysis. The actual sample times and dates of all blood draws were recorded along with the date and time of the patient reported time for the last dose. Concurrently, the entire dosing history was monitored using the MEMS system.
Determination of escitalopram Concentrations
Blood samples (10 ml) were collected by venipuncture using a tourniquet and a 21g needle into lavender top Vacutainer tubes containing 15 % EDTA. The blood was placed in a refrigerated tabletop centrifuge (5°C) and processed for 10 minutes at 1500g. The plasma layer was transferred into 5 ml polypropylene tubes and frozen at −70°C until analyzed.
Escitalopram was measured by reverse-phase high performance liquid chromatography (HPLC) using ultraviolet detection at a wavelength of 210 nm. This method was developed by the Geriatric Psychopharmacology Laboratory at the University of Pittsburgh. Plasma is extracted using liquid-liquid extraction (ethyl acetate in heptane; 2:8, v/v) and back-extracted into 0.025 M potassium phosphate, pH 2.4. Separation is completed using a Nucleosil-100 C18 5 um HPLC column, 120mm × 4.6 mm i.d. with a flow rate of 1.0 ml/minute. The assay is linear in the range of 2.5−500 ng/ml with an inter-assay variability (C.V.) of 2.9−3.93% and accuracy (C.V.) of 1.8−3.9%. The limit of quantitation for escitalopram 2.5 ng/ml for this assay.
Data Analysis
Dosing discrepancies between MEMS recorded and patient reported last dosing time were calculated as the MEMS recorded time minus the patient reported time as shown in the Equation 1:
| Equation 1 |
Positive values indicate the MEMS recorded times were later than patient reported times, while a negative value reflects that the patient reported times were later. The absolute time interval between the two recording methods was also calculated by taking the absolute value of Equation 1.
Nonlinear mixed-effects modeling was used to develop PPK models in NONMEM® (version 5.1.1). The PPK models consisted of a PK structure model and a statistical model where between subject and within subject variability were described. To consider multiple dosing effects on each observed escitalopram concentration, the PPK model was developed based on the ten day dosing history recorded by MEMS prior to each observed concentration. The ten day dosing records involved in the analysis were longer than five times the literature reported half-life (27−32 hr) of escitalopram, and doses given before these dosing records should not affect the measured escitalopram concentration 17, 18. A PPK analysis using NONMEM was also evaluated in the same population using the patient reported last dosing time with the assumption of a steady state condition. One and two-compartment linear mammillary PK models with first-order absorption and elimination were evaluated during model development. Model parameters were estimated using the first-order conditional estimation (FOCE) with interaction method. Objective function values and goodness of fit plots were used as model selection criteria. Diagnostic plots and post-processing of NONMEM® outputs were performed using R® (version 2.6.2) and SPSS® (version 14.0).
RESULTS
Population reported last dosing time
185 blood samples from 73 patients were available for data analysis with study statistics summarized in Table 1. A discrepancy in the last dosing time between the two reported dosing methods was observed. The mean and standard deviation of the absolute time intervals in the last dosing time between the two different reported dosing methods was 4.48 ± 10.12 hrs. However, the time intervals (MEMS reported last dosing time minus the patient reported) were almost symmetrically distributed with a median value and standard deviation of 0.133 ± 11.073 hrs. A histogram plot of time intervals calculated from the clinical trial is shown in Figure 1.
Table 1.
Patient democratic information
| Demographics | Mean ± SD |
|---|---|
| Number of Subjects | 73 |
| Number of Observations | 185 |
| Age (years) | 39.47 ± 11.35 |
| Weight (lb) | 81.83 ± 43.81 |
| Sex | Male: 32 |
| Female: 41 | |
| Caucasian: 67 | |
| African american: 2 | |
| Asian: 1 | |
| Race | American Indian & African |
| American: 1 | |
| American Indian & Caucasian: 1 | |
| Unknown :1 |
Figure 1.
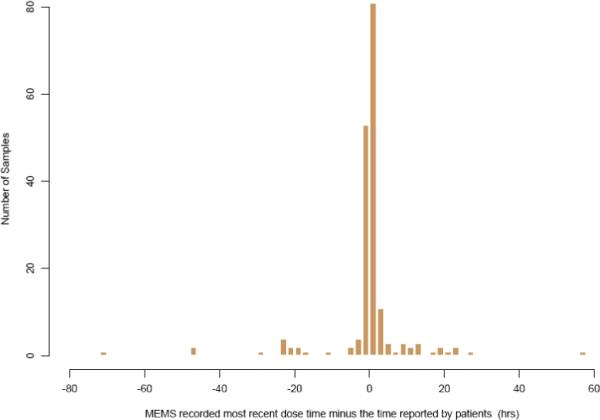
Time interval (hrs) between the last dose time recorded by MEMS and the patients (median ± SD: 0.133 ± 11.073hrs).
Population pharmacokinetics analysis
The proportion of blood samples collected during selected time intervals based on MEMS or patient reported last dosing times are shown in Table 2. Within the first four hours after the most recent dose, a total of 36.76% (68 observations) and 29.19% (54 observations) of the blood samples were collected based on the MEMS and patients reported dosing times, respectively. A frequency histogram further illustrates this sampling distribution for escitalopram concentration measurements after the most recent dose for MEMS (Figure 2a) and patient self reported dosage times (Figure 2b), respectively.
Table 2.
Sampling time distribution following the last dosing time based on either MEMS records or patient reported times.
| Sampling time after the most recent dose (hr) | Cumulative percent samplings during the elapsed time | |
|---|---|---|
| MEMS | Patient reported | |
| 4 | 36.76% | 29.19% |
| 8 | 48.65% | 43.24% |
| 12 | 60.00% | 57.84% |
| 16 | 74.59% | 72.43% |
| 20 | 84.86% | 85.95% |
| 28 | 91.89% | 94.05% |
| 100 | 100.00% | 100.00% |
Figure 2.
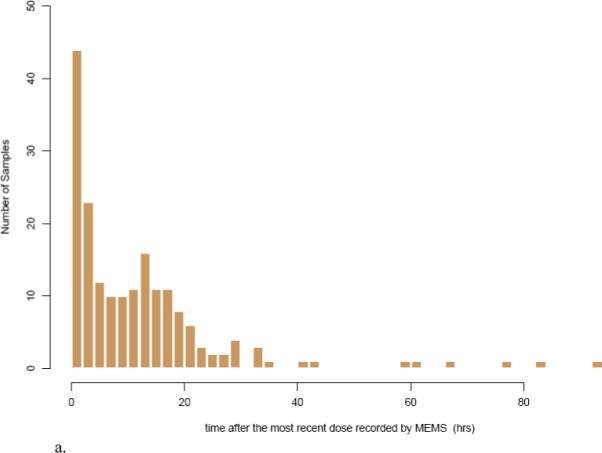
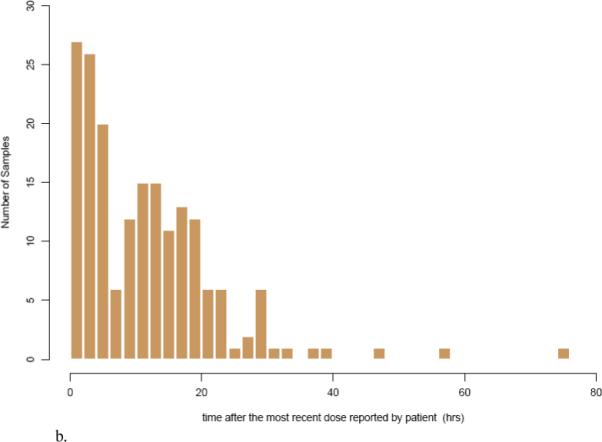
Frequency histogram showing the sampling distribution for escitalopram sampling measurements based on a) MEMS records and b) patient reported dosing times. The x-axis is broken into 4-hour bins, and the y-axis is the number of blood samplings during that time range.
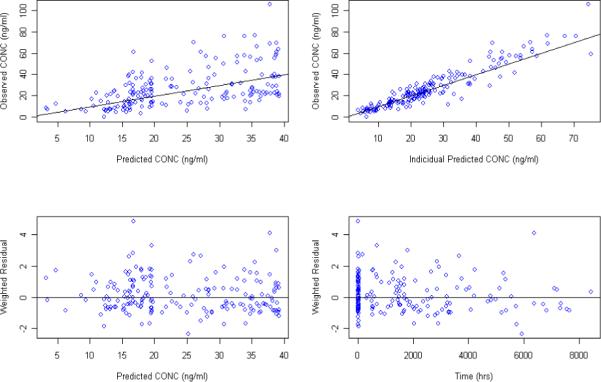
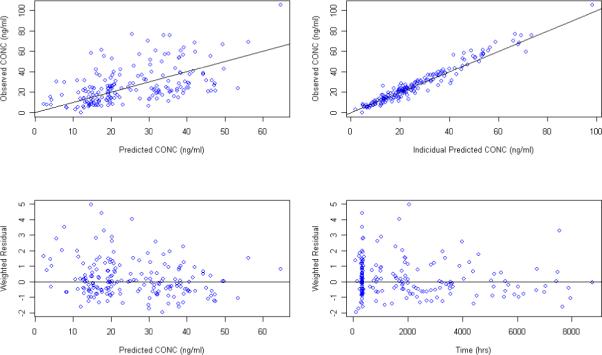
Although PPK with sparse sampling are typically modeled with a fixed Ka value, initial modeling attempts focused on estimating Ka in addition to the other PK parameters. Numerical convergence was achieved when modeling concentration data based on either patient reported last dosing time as the model input with a steady state condition assumption or MEMS dosing history as the model input. A one compartment model with first order absorption and elimination accurately described the data. Goodness of fit plots for models developed from the MEMS records (Figure 3) and from patient reported last dosing time (figure 4) demonstrate that the models adequately described the data. The scatter plots of the observed versus predicted population concentrations and observed versus predicted individual concentrations were distributed symmetrically around the line of unity. The weighted residuals were also distributed symmetrically around zero with certain variance. Estimates for the full set of population PK parameters along with the standard errors from both models are listed in Table 2. Estimated oral clearance, volume of distribution, and absorption rate for escitalopram were 25.5L/hr (SE: 7.0%), 1000 L (SE: 17.3%), and 0.74 hr−1(SE: 45.7%), respectively, for the model developed from MEMS records, and 26.9 L/hr (SE: 6.6%) , 767 L (SE: 17.5%) , and 0.511 hr−1 (SE: 35.4%) for the model developed from the patient reported last dose times. Population clearance, volume of distribution and absorption differed by 5%, 23.3%, and 31% using the MEMS dosage inputs versus the patient reported last dosing time and a steady state assumption. Parameters estimated from MEMS methods were similar to the literature reported volume of distribution (∼1100 L) and absorption rate (∼0.8 − 0.9 hr−1) following oral administration 17, 18.
Figure 3.
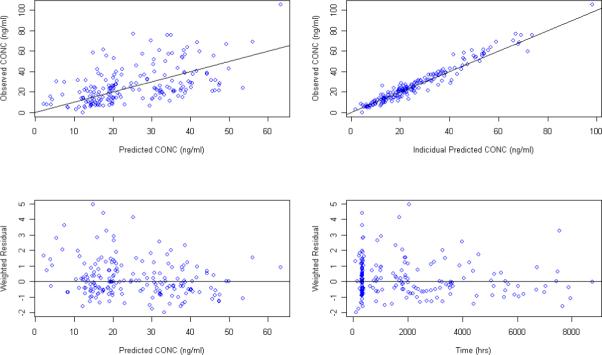
Goodness of fit plots for the PPK model using MEMS recorded dosing time as the model input and estimating Ka in addition to the other PK parameters
Figure 4.
Goodness of fit plots for the PPK model using the patient reported last dosing time as the model input and estimating Ka in addition to the other PK parameters
Post-processing results for individual parameter estimates are listed in Table 3. A paired t-test showed that there was no significant difference in the estimated oral clearance of escitalopram between models in these 73 patients for the empirical Bayes estimates of the clearance parameter. However, different reported dosing methods resulted in significantly different model estimates for the volume of distribution (P<0.001) and absorption rate (P<0.001) for escitalopram at the level of the individual empirical Bayes estimates.
Table 3.
PPK model parameters without fixing Ka using either MEMS or patient reported dosing records as the input.
| Parameters | MEMS records | Patient reported dosing time |
|---|---|---|
| OFV | 1029.148 | 1031.989 |
| CL (L/hr) (SE %) | 25.5 (7.0%) | 26.9 (6.6%) |
| V (L) (SE %) | 1000 (17.3%) | 767 (17.5%) |
| Ka (hr−1) (SE %) | 0.74 (45.7%) | 0.511 (35.4%) |
| ωcl % (SE %) | 53.5% (14.7%) | 48.3% (26.7%) |
| ωv % (SE %) | 64.3% (43.7%) | 18.7% (517.1%) |
| ωKa % (SE %) | 88.9% (106.8%) | 62.6% (225.8%) |
| σ1 % (SE %) | 15.2% (105.2%) | 23.7% (19.9%) |
| σ2 (SE %) | 3.61 (108.5%) | 2.92 (72.0%) |
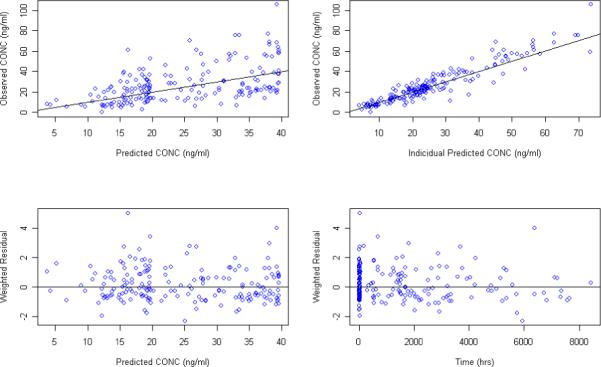
The population PK model was also assessed by fixing Ka to the literature reported value of 0.8 hr−1 17, 18. Goodness of fit plots for models developed from the MEMS records and patient reported dose time are presented in Figure 5 and Figure 6, respectively. PPK parameters estimates along with their standard errors are listed in Table 4. Post-processing of individual parameter estimates from NONMEM output is shown in the Table 5. As before, there was no significant difference in estimated clearance using different dosing reporting methods during model development. However, estimates on volume of distribution were still sensitive (P<0.001) to the reported dosing methods even with the Ka value fixed to the literature value in both models.
Figure 5.
Goodness of fit plots for the PPK model using MEMS recorded dosing time as the model input and Ka fixed to 0.8 hr−1
Figure 6.
Goodness of fit plots for the PPK model using the patient reported last dosing time as the model input and Ka fixed to 0.8 hr−1
Table 4.
Post-processed individual empirical Bayes estimates on PK parameters without fixing Ka value using either MEMS or patient reported dosing records as the input.
| Estimated Parameters |
N |
MEMS records mean ± SD |
Patients reported dosing time mean ± SD |
P value |
|---|---|---|---|---|
| CL (L/hr) | 73 | 27.84 ± 12.42 | 29.18 ± 12.38 | 0.080 |
| V (L) | 73 | 1005.31 ± 348.53 | 764.98 ± 24.12 | < 0.001 |
| Ka (hr−1) | 73 | 0.76 ± 0.23 | 0.51 ± 0.08 | < 0.001 |
Table 5.
PPK model parameters with a fixed Ka using either MEMS or patient reported dosing records as the input.
| Parameters | MEMS records | Patient reported dosing time |
|---|---|---|
| OFV | 1029.190 | 1033.881 |
| CL (L/hr) (SE %) | 25.5 (7.1%) | 27 (6.4%) |
| V (L) (SE %) | 1020 (15.5%) | 855 (15.3%) |
| Ka (hr−1) (SE %) | 0.8 (0.0%) | 0.8 (0.0%) |
| ωcl % (SE %) | 53.6% (14.7%) | 47.4% (26.2%) |
| ωv % (SE %) | 64.5% (44.7%) | 0% (fixed) |
| ωKa % (SE %) | 93.1% (64.8%) | 97.5 % (153.7%) |
| σ1 % (SE %) | 15.5% (115.8%) | 23.9% (19.7%) |
| σ2 (SE %) | 3.55 (118.3%) | 3.02 (65.7%) |
DISCUSSION
In this study, we successfully performed a PPK analysis for orally administered escitalopram using two different reported dosing methods as the input to the model. The inputs considered were either the MEMS generated dosing histories or the patient reported last dosing time. This approach is analogous to that described by Vrijens et al. during a PPK analysis of the drug lopinavir 5.
It is well known that accurately estimating the Ka value is a challenge in PPK analysis, especially when data sampling is sparse19, 20. In this study, however, 36.76% (68 observations) and 29.19% (54 observations) of the blood samples were collected before the maximal concentration following the most recent MEMS recorded and patient reported dose, respectively. Hence, initial modeling attempts included the estimation of a Ka value in addition to the other PK parameters. Numerical convergence was achieved for both models. There were 5%, 23.3%, and 31% differences in the estimated population clearance, volume of distribution, and absorption rate, respectively, between the two models. Also, the estimated oral clearance of escitalopram was statistically insensitive to model inputs based on either the MEMS (25.5 L/hr) or patient reported dosing times (26.9 L/hr). Different reported dosing methods resulted in significantly different estimates for the volume of distribution and absorption rate constant for escitalopram both at the population level (MEMS vs. patient reported: V/F 1000 L vs. 767 L; Ka 0.74 vs. 0.51 hr−1) and at post-processed individual level (MEMS vs. patient reported: V/F 1005.31 L vs. 764.98 L; Ka 0.76 vs. 0.51 hr−1). Furthermore, estimates from the MEMS model were closer to the literature reported V/F (∼1100L) and Ka (∼0.8−0.9 hr−1) 17, 18. Knowing the dosing history from the MEMS, Ka was more accurately predicted even when concentration data were sparse, and the estimated Ka population value from MEMS model was almost equivalent to that reported in the literature 17, 18. Hence, it is likely that inaccurate patient reported dosing times in addition to sparse sampling are the primary difficulties for obtaining accurate Ka values from study data. A study conducted by Vrijens et al. 5 attempted to model liponavir concentration data using these two reported dosing report methods. These results showed that model convergence was not achieved using patient reported last dosing time assuming steady state conditions for the model input. In contrast, numerical convergence was achieved when the MEMS dosing history was used as the model input. In our study, numerical convergence was achieved for both reported dosing history and model structures, and clearance could be reasonably estimated in all cases This was likely due to the longer half life of the escitalopram (27 ∼ 32 hours) compared to shorter half life of lopinavir (5 ∼ 6 hours).21 As a few hour deviation in recorded dosing time may have a relatively small effect on clearance estimation for a drug with a longer half-life. PPK parameters were correctly predicted previously for a longer half-life drug, citalopram (t1/2: 30hr), using patient reported last dosing time with a steady state assumption modeling approach 20. In contrast, both a higher bias and imprecision in predicted clearance were reported when utilizing a similar analysis for the shorter half-life drug, risperidone (t1/2: 6−7 hrs) 19. In this study, the absolute time interval in the reported last dosing time between the two patient dosing histories was 4.48 hrs, which only accounted for 13∼16% of half-life of the escitalopram.
The investigators anticipated that the findings would be consistent with Vrijens et al5 with respect to convergence problems and biased PK parameter estimates. It was surprising that the results contradicted their findings with adequate convergence of the model and little bias in the clearance estimation at both the individual and population level for escitalopram given the patient reported time of last dose. This may be accounted for in differences in study design, patient population or the long half-life of escitalopram. In particular, it may be that the patients, knowing they were being monitored, provided more accurate times of last dose information than otherwise would have been collected. 22
In this study, the use of MEMS dosage histories versus the patient reported time of last dose, helped with the determination of absorption (Ka) and distribution (Vd), but clearance determination was virtually unaffected. Despite this, patterns of drug exposure may be critical in evaluating response, non-response, and toxicity. These patterns cannot be generated or recreated using the time of last dose information. Exposures calculated in this manner may not only have incorrect PK parameter values but only provide an average exposure over a period of time. This pattern of exposure and response issue is not addressed in this study._ The necessity of MEMS monitoring may be determined by the drug half-life and the nature of the concentration effect relationship and the sensitivity of this relationship to patterns of exposure that are not captured in the PPK analysis using reported time of last dose.
Table 6.
Post-processed individual empirical Bayes estimates on PK parameters with a fixed Ka value using either MEMS or patient reported dosing records as the input.
| Estimated Parameters | N | MEMS records Mean ± SD | Patients reported dosing time Mean ± SD | P value |
|---|---|---|---|---|
| CL (L/hr) | 73 | 27.88 ± 12.42 | 29.15 ± 12.00 | 0.095 |
| V (L) | 73 | 1017.45 ± 353.63 | 855.28 ± 0.00 | < 0.0001 |
| Ka (hr−1) | 73 | 0.81 ± 0.26 | 0.78 ± 0.20 | 0.227 |
REFERENCES
- 1.Sheiner LB, Rosenberg B, Marathe VV. Estimation of population characteristics of pharmacokinetic parameters from routine clinical data. J Pharmacokinet Biopharm. 1977;5:445–479. doi: 10.1007/BF01061728. [DOI] [PubMed] [Google Scholar]
- 2.Vrijens B, Goetghebeur E. Electronic monitoring of variation in drug intakes can reduce bias and improve precision in pharmacokinetic/pharmacodynamic population studies. Stat Med. 2004;23:531–544. doi: 10.1002/sim.1619. [DOI] [PubMed] [Google Scholar]
- 3.Vrijens B, Goetghebeur E. The impact of compliance in pharmacokinetic studies. Stat Methods Med Res. 1999;8:247–262. doi: 10.1177/096228029900800305. [DOI] [PubMed] [Google Scholar]
- 4.Vrijens B, Gross R, Urquhart J. The odds that clinically unrecognized poor or partial adherence confuses population pharmacokinetic/pharmacodynamic analyses. Basic Clin Pharmacol Toxicol. 2005;96:225–227. doi: 10.1111/j.1742-7843.2005.pto960312.x. [DOI] [PubMed] [Google Scholar]
- 5.Vrijens B, Tousset E, Rode R, et al. Successful projection of the time course of drug concentration in plasma during a 1-year period from electronically compiled dosing-time data used as input to individually parameterized pharmacokinetic models. J Clin Pharmacol. 2005;45:461–467. doi: 10.1177/0091270004274433. [DOI] [PubMed] [Google Scholar]
- 6.Osterberg L, Blaschke T. Adherence to medication. N Engl J Med. 2005;353:487–497. doi: 10.1056/NEJMra050100. [DOI] [PubMed] [Google Scholar]
- 7.Liu H, Golin CE, Miller LG, et al. A comparison study of multiple measures of adherence to HIV protease inhibitors. Ann Intern Med. 2001;134:968–977. doi: 10.7326/0003-4819-134-10-200105150-00011. [DOI] [PubMed] [Google Scholar]
- 8.Waugh J, Goa KL. Escitalopram : a review of its use in the management of major depressive and anxiety disorders. CNS Drugs. 2003;17:343–362. doi: 10.2165/00023210-200317050-00004. [DOI] [PubMed] [Google Scholar]
- 9.Crone CC, Gabriel GM. Treatment of anxiety and depression in transplant patients: pharmacokinetic considerations. Clin Pharmacokinet. 2004;43:361–394. doi: 10.2165/00003088-200443060-00002. [DOI] [PubMed] [Google Scholar]
- 10.Owens MJ, Knight DL, Nemeroff CB. Second-generation SSRIs: human monoamine transporter binding profile of escitalopram and R-fluoxetine. Biol Psychiatry. 2001;50:345–350. doi: 10.1016/s0006-3223(01)01145-3. [DOI] [PubMed] [Google Scholar]
- 11.Wade A, Michael Lemming O, Bang Hedegaard K. Escitalopram 10 mg/day is effective and well tolerated in a placebo-controlled study in depression in primary care. Int Clin Psychopharmacol. 2002;17:95–102. doi: 10.1097/00004850-200205000-00001. [DOI] [PubMed] [Google Scholar]
- 12.Gorman JM, Korotzer A, Su G. Efficacy comparison of escitalopram and citalopram in the treatment of major depressive disorder: pooled analysis of placebo-controlled trials. CNS Spectr. 2002;7:40–44. doi: 10.1017/s1092852900028595. [DOI] [PubMed] [Google Scholar]
- 13.Rapaport MH, Bose A, Zheng H. Escitalopram continuation treatment prevents relapse of depressive episodes. J Clin Psychiatry. 2004;65:44–49. doi: 10.4088/jcp.v65n0107. [DOI] [PubMed] [Google Scholar]
- 14.Burke WJ, Gergel I, Bose A. Fixed-dose trial of the single isomer SSRI escitalopram in depressed outpatients. J Clin Psychiatry. 2002;63:331–336. doi: 10.4088/jcp.v63n0410. [DOI] [PubMed] [Google Scholar]
- 15.Davidson JR, Bose A, Korotzer A, Zheng H. Escitalopram in the treatment of generalized anxiety disorder: double-blind, placebo controlled, flexible-dose study. Depress Anxiety. 2004;19:234–240. doi: 10.1002/da.10146. [DOI] [PubMed] [Google Scholar]
- 16.Stahl SM, Gergel I, Li D. Escitalopram in the treatment of panic disorder: a randomized, double-blind, placebo-controlled trial. J Clin Psychiatry. 2003;64:1322–1327. doi: 10.4088/jcp.v64n1107. [DOI] [PubMed] [Google Scholar]
- 17.Rao N. The clinical pharmacokinetics of escitalopram. Clin Pharmacokinet. 2007;46:281–290. doi: 10.2165/00003088-200746040-00002. [DOI] [PubMed] [Google Scholar]
- 18.Sogaard B, Mengel H, Rao N, Larsen F. The pharmacokinetics of escitalopram after oral and intravenous administration of single and multiple doses to healthy subjects. J Clin Pharmacol. 2005;45:1400–1406. doi: 10.1177/0091270005280860. [DOI] [PubMed] [Google Scholar]
- 19.Bies RR, Mulsant BH, Rosen J, et al. Population pharmacokinetics as a method to detect variable risperidone exposure in patients suffering from dementia with behavioral disturbances. Am J Geriatr Pharmacother. 2005;3:87–91. doi: 10.1016/j.amjopharm.2005.07.002. [DOI] [PubMed] [Google Scholar]
- 20.Bies RR, Feng Y, Lotrich FE, et al. Utility of sparse concentration sampling for citalopram in elderly clinical trial subjects. J Clin Pharmacol. 2004;44:1352–1359. doi: 10.1177/0091270004269647. [DOI] [PubMed] [Google Scholar]
- 21.Saez-Llorens X, Violari A, Deetz CO, et al. Forty-eight-week evaluation of lopinavir/ritonavir, a new protease inhibitor, in human immunodeficiency virus-infected children. Pediatr Infect Dis J. 2003;22:216–224. doi: 10.1097/01.inf.0000055061.97567.34. [DOI] [PubMed] [Google Scholar]
- 22.Urquhart J. Role of patient compliance in clinical pharmacokinetics. A review of recent research. Clin Pharmacokinet. 1994;27:202–215. doi: 10.2165/00003088-199427030-00004. [DOI] [PubMed] [Google Scholar]