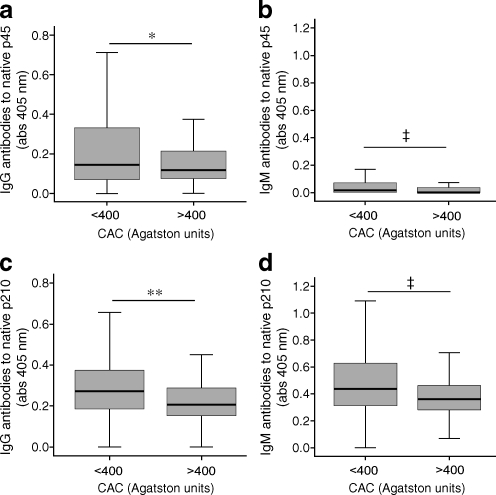
Fig. 3.
Box plots showing plasma levels of a IgG against (absorbance [abs] units measured at 405 nm) native p45, b IgM against native p45, c IgG against native p210 and d IgM against native p210 in diabetic individuals with low to moderate (≤400 Agatston units) and severe to extensive (>400 Agatston units) coronary calcification. *p < 0.05, **p < 0.01, ‡p = 0.005

