

Abstract
We develop a mechanochemical model for the dynamics of cellulase, a two-domain enzyme connected by a peptide linker, as it extracts and hydrolyzes a cellulose polymer from a crystalline substrate. We consider two random walkers, representing the catalytic domain (CD) and the carbohydrate binding module (CBM), whose rates for stepping are biased by the coupling through the linker and the energy required to lift the cellulose polymer from the crystalline surface. Our results show that the linker length and stiffness play a critical role in the cooperative action of the CD and CBM domains and that, for a given linker length, the steady state hydrolysis shows a maximum at some intermediate linker stiffness. The maximum hydrolysis rate corresponds to a transition of the linker from a compressed to an extended conformation, where the system exhibits maximum fluctuation, as measured by the variance of the separation distance between the two domains and the dispersion around the mean hydrolysis speed. In the range of experimentally known values of the parameters of our model, improving the intrinsic hydrolytic activity of the CD leads to a proportional increase in the overall hydrolysis rate.
I. Introduction
Cellulosic ethanol is a renewable, carbon neutral source of energy with the added benefit of possessing excellent liquid fuel properties. Economic production of ethanol from cellulosic biomass on commercial scales will help reduce our dependence on fossil fuels. Towards this aim, research efforts made to commercialize the process include, but are not limited to, the following areas1: (1) developing improved feedstocks, (2) overcoming biomass recalcitrance—through enhanced pretreatment options and more efficient enzymes, (3) improving ethanol fermentation and recovery methods, and (4) minimizing enzyme production costs. Although a concerted approach involving all aspects in the biomass to ethanol conversion will be necessary in surmounting the economic challenges, perhaps the greatest leverage arises from (2) above1, for which efforts are being made to develop better enzymes using, for example, directed evolution and rational engineering2. In this respect, a molecular, mechanistic understanding of how cellulase hydrolyzes the recalcitrant biomass will be valuable to the knowledge-based design of more efficient enzymes.
Cellulase consists of two domains—a carbohydrate binding module (CBM) and a catalytic domain (CD)—connected by a linker region, see Fig. 1C. How these two domains work together to extract a single polysaccharide chain from the crystalline cellulose and achieve the desired hydrolysis is a key question of considerable controversy. In particular, the role of the linker between the two domains is not known. Experimental efforts to reveal the structure of the linker remain inconclusive3–5, while molecular dynamics simulations are limited by the inordinately long computation time necessary to model both the large size of the enzyme/substrate complex and the long timescale for the motion of the enzyme. For example, recently reported preliminary results from 1.5 ns of simulation time, predicting the peptide linker is too flexible to store energy in a manner similar to spring6, were subsequently contradicted by free energy calculations from the same group7. Developing a fully atomistic model is clearly a nontrivial task with current computation power.
Fig. 1.
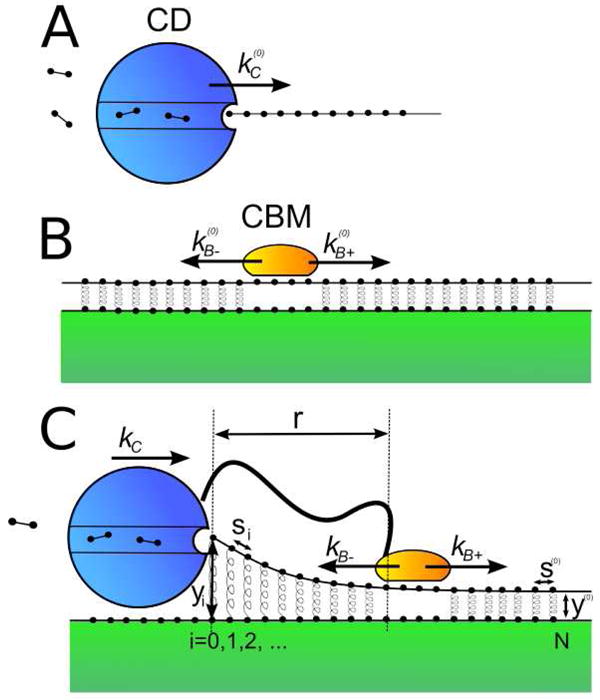
Cellulase cartoons: A) Depicts the hydrolytic activity of the isolated catalytic domain (CD) on a soluble cellulose polymer. B) Depicts the lateral diffusion of the isolated carbohydrate binding module (CBM) on an unperturbed crystalline surface, where the springs represent noncovalent interaction. C) Depicts the hydrolytic activity of the intact cellulase, consisting of a CD and CBM coupled by a peptide linker.
In this paper, we develop a mechanochemical model, whereby the free energy gain from the cellulose hydrolysis provides the driving force for the motion of the CD, which is then coupled to the motion of the CBM through the linker. Rather than attempting to accurately model the atomistic details of the system, we seek to develop a stochastic model that can capture the kinetic rates of the processive CD and the random CBM, coupled by the mechanical deformation of the peptide linker joining the two domains and the energetics of the hydrogen bond disruption of the cellulose crystal. Our results reveal that a symbiotic relationship between the two domains drives the processive motion of the hydrolysis. In particular, as the CD hydrolyzes the cellulose polymer and advances forward, it must simultaneously extract the polysaccharide chain from the crystalline surface. This lifting, which is energetically unfavorable, significantly slows down the motion of the CD, rendering it effectively inactive without the assistance of the CBM, which binds and disrupts the hydrogen bonds between the cellulose polymer and the crystalline surface8–10. At the same time, the CBM also depends on the CD’s ability to lift the polymer in order to prevent the disrupted polymer chain from re-associating with the crystalline surface. We find that the ability for the two domains to cooperate synergistically depends in a nontrivial way on their separation r, which depends on the linker length and flexibility, and that there exists an optimum enzymatic rate. This observation suggests that the maximum hydrolytic activity is achieved by optimizing the cooperative action between the catalytic domain and the carbohydrate binding module in processing down the length of a cellulose chain.
II. The Model
In this section, we will develop the model from the relevant details of the biology. The goal is not to fill the model with undue molecular details, but to capture the average dynamics such that conclusions may be gleaned about the optimal linker parameters, which will allow for an efficient hydrolysis of the cellulose. Since binding to the substrate is an effectively irreversible, yet dynamic process11, we will not study the binding/unbinding of the enzyme. Instead, the model will seek to capture the stochastic dynamics of the two domains—represented by coupled random walkers—as they take discrete steps along the length of the cellulose polymer. Such discrete stochastic models of molecular motor/enzyme dynamics have recently gained considerable popularity12–18, as they require less microscopic information and can often be solved analytically.
A. Kinetic Scheme
We describe the state of the enzyme by the discrete position x of the CD and the distance r separating the two domains, see Fig. 1. We nondimensionalize these quantities using the length of a step δ, representing the distance between two neighboring monomers of the cellulose polymer. Generally speaking, for any state, three moves are allowed in the model: (1) the CD may step forward, (2) the CBM may step forward, and (3) the CBM may step backward. We denote P(x,r,t) as the probability for the enzyme to be in a state described by position x and separation r at time t. Assuming a Markovian process, the master equation governing the time evolution of P(x,r,t) is given by
| (1) |
where the positive and negative terms in the sum are the joint probabilities of transitioning into and out of, respectively, the state whose trajectory we are tracking. Note that the rates depend only on the relative separation of the two domains and not on the actual position, assuming translation invariance of the cellulose crystal surface. The argument in the rate refers to the separation of the initial state. Thus, kC (r) is the transition rate per unit time for the CD to move to the right from a separation distance r to r−1, while kB+ (r) is the rate for the CBM to move to the right from a separation r to r + 1, since moving the CD to the right decreases the separation while moving the CBM to the right increases the separation. Eq. (1) describes a standard one-step process for a sufficiently small time step, where only one of the moves can take place19.
In order to obtain a meaningful result to Eq. (1), we need to invoke an explicit description of the rate constants. In what follows, we seek to capture the necessary components of the enzyme/substrate complex, which determine the rate constants of the model.
B. Two Random Walkers
Crystal structures of the catalytic domain reveal a long tunnel for the active site, containing many nonspecific and solvent-mediated interactions, which suggests a forward processive motion of the CD along the length of the cellulose polymer20–22 (Fig. 1A). Thus, we choose to model the catalytic domain as a one dimensional stochastic walker that may only step in the forward direction, as governed by an intrinsic rate constant . Although the motion is a non-equilibrium process that likely involves complex mechanochemical dynamics, such as the conformational change of the enzyme and its grabbing and pulling of the polysaccharide chain, in the limit that the motion is tightly coupled to the hydrolysis, the intrinsic rate constant may be expressed as
| (2) |
where ν is some transition frequency and ΔU(g) is the activation energy, in units of kBT, of the intrinsic potential U(x) at position g in Fig. 2. Since nothing is known a priori about the shape of the potential, we can only say that g is some value between zero and the discrete step size δ of the model, which we nondimensionalize such that 0 < g <1. The assumption that the CD only steps in the forward direction is justified by imagining what must occur in order for the CD to take a reverse step: the hydrolyzed monomer must reattach to the polymer such that the CD has a “track” to step back on. Thus, in the absence of the CD detaching from the polymer—an unlikely event for the time scale of interest, considering that the enzyme binds strongly to the polymer through several hydrogen bonds22—the rate constant for a back step is effectively zero.
Fig. 2.
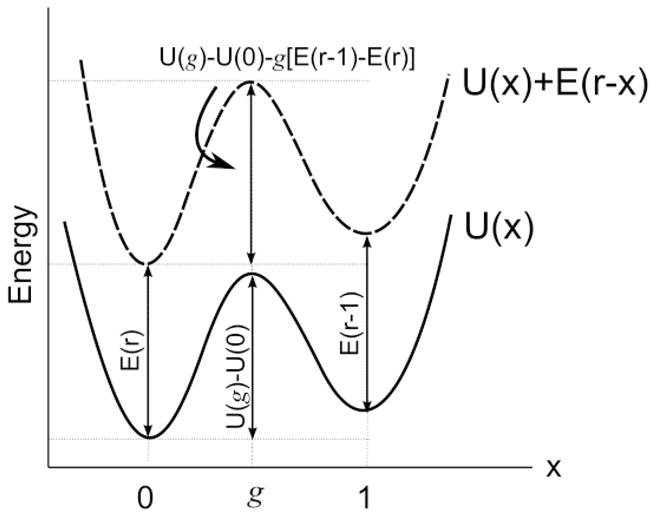
The intrinsic potential (solid line) and the total potential (dashed line).
In all cases of practical interest, the substrate is also bound to a crystalline surface. The presence of an active site enclosed within a tunnel requires that the CD disrupt and lift the substrate—a single cellulose polymer—from the crystalline network as it advances along the chain. Furthermore, there will be a compression energy for the linker, which couples the CD to the CBM. The total energy at a given r must therefore account for the coupling E(r−x) and is given by
| (3) |
In general, the coordinates of the minima and the maxima of Ũ(x) will not coincide with those of U(x). However, in the limit where E(r−x) is a weak perturbation, we make the assumption that this is the case. Then the activation barrier of the total energy is
| (4) |
and the rate constant for the forward motion of the catalytic domain, as biased by the lifting of the cellulose profile and the compression of the linker, becomes
| (5) |
where is the intrinsic rate constant given by Eq. (2). A similar strategy has been used by Kolomeisky and Fisher in their description of protein motors under various loading conditions15,17 and by Betterton and Julicher in their work on helicase unwinding of DNA13,23. Notice that the rate is independent of the position x of the enzyme and is obtained for discrete values of r. Because the continuous form of the total potential is not known, in particular the linker potential is uncertain and may depend on complex interactions with the substrate7, we use a linear expansion for Eq. (4), which assumes that E(r) varies slowly over the length scale δ.
The carbohydrate binding module similarly follows a one dimensional random walk along the length of the cellulose chain, only its motion can be in both the forward (+) and backward (−) directions. For the diffusion of an isolated CBM on an unperturbed cellulose surface (Fig. 1B), the intrinsic rate constants are given by for the forward step, and for the backward step. As before, ω is some transition frequency (ω≠ν) and f is the position of the activation barrier. Because the intrinsic dynamics of the CBM is unbiased, we set U(0) = U(1) and f =1/2, corresponding to a symmetric periodic potential, such that . In the case where the CBM is coupled to the CD, the cellulose surface will have some profile from being lifted by the CD (Fig. 1C). This perturbation biases the diffusion of the CBM. Furthermore, as the CBM disrupts the local hydrogen bond interactions, it additionally alters the profile. To capture these effects, as well as the effect of the linker compression/extension, we follow the same procedure as for the CD and obtain
| (6) |
for the forward rate constant, and
| (7) |
for the reverse rate constant. Note that kB+ (r)/kB− (r + 1) satisfies the detailed balance requirement and is independent of the parameter f.
The master equation, together with the rate constants in Eqs. (5–7), completely describes the kinetics of our system. Before we proceed with obtaining explicit expressions for the rate constants, we point out two additional features of the model. Firstly, the CBM is always to the right of the CD and the two cannot cross, so that if r = 0, only the CBM may step forward. To account for this blockage effect, we set kC (0) = kB− (0) = 0. Secondly, in the limit where the coupling, E(r), includes an infinitely stiff spring, the CD and the CBM are forced to move as one unit. In the weak coupling case assumed here, the activation barrier for such a concerted move is roughly the sum of the activation barriers for the CD and the CBM. Therefore, the rate constant for such a process is much smaller than the rate constants for the individual moves allowed in the master equation. Together with the fact that Eq. (1) only allows for one-step processes, we ignore the higher order event of joint moves by the CD and CBM.
In the next section, we obtain expressions for the coupling potential E(r), consisting of the energy of the peptide linker L(r) and the energy of the cellulose profile H(r), which will allow us to express the rate constants in terms of r.
C. Coupling Potential
Because no satisfactory end-to-end probability distribution of the linker may be obtained from the literature3,4,7,24, we choose to model the linker as a simple Hookean spring. This assumption is justified by the glycosylation and the high fraction of proline-threonine residues, both of which impart a high rigidity to the linker, leading to extended conformations in solution4. The energy of the linker as a function of the separation r is the familiar
| (8) |
where κ is the spring constant representing the stiffness of the linker and r0 is some equilibrium length in units of δ. In what follows, we only consider cases where r0 ≠ 0. The structure of the linker region varies widely among cellulases, anywhere from 5 to 100 residues in length25 and an average of 3.0 - 0.7 Å/residue3, depending on flexibility. In our model, we take the length r0 and the flexibility κ of the linker as control parameters and examine their effects on the hydrolysis kinetics.
To obtain H(r)for the energy of the substrate, we will need to invoke a description of the cellulose profile. Lignocellulose is a complex substrate composed primarily of cellulose microfibrils in association with hemicellulose and surrounded by a lignin seal. This makes modeling the enzymatic hydrolysis difficult without first noting that several pretreatment options exist, which can break the lignin seal and solubilize the amorphous hemicellulose, thus releasing the cellulose microfibril26. Furthermore, electron microscopy results indicate worn edges of the cellulose microfibril, suggesting that the enzyme preferentially binds to and processively hydrolyzes the most exposed chain on the surface, i.e. that with the fewest interactions to the underlying crystal27. Thus it is reasonable to simplify the substrate into a one-dimensional homopolymer that is bound to a surface through several non-covalent interactions.
We choose to represent the cellulose polymer using a bead and spring model, where the beads represent glucose monomers and the springs represent covalent bonds. To capture the noncovalent interactions of the polymer with the crystalline substrate, we adopt the Pyrard-Bishop potential28 used for the unzipping of two DNA strands, given by
| (9) |
where the summation is over the monomers of the cellulose chain, see Fig. 1C. We keep track of i = 0, 1,… N monomers, where 0 is always the monomer at the entrance of the tunnel, and N is taken to be sufficiently large as to be in the unperturbed region of the cellulose crystal, far away from the cellulase. The first term represents the penalty for stretching the covalent bonds between the monomers, where λ is the effective spring constant of the covalent bond, s(0) =δ is the equilibrium bond length, and si is the bond length between monomers i and i+1, defined by . Here, yi is the height of the ith monomer from the surface. For small yi − yi+1, the first term in Eq. (9) can be approximated such that the sum becomes
| (10) |
where γ≡λ/(s(0))2. The second term is the Morse potential for the hydrogen bond interactions between the monomers of the chain to be extracted and the surface. In this expression, y(0) is the equilibrium bond length, D is the bond dissociation energy, and a determines the width of the potential well. Because each monomer is actually involved in several hydrogen bonds and we only model a single interaction, each term of the Morse potential actually represents an approximation of all the noncovalent interactions. In what follows, we refer to this as a single hydrogen bond for simplicity. The local disruptive effect of the CBM on the crystal is captured by rewriting the second sum such that the interaction energy for the monomers directly below the binding module, i = {r,…,r + nB}, are not included. nB reflects both the size of the binding module and the number of monomers disrupted. For example, nB = 4 in Fig. 1C. Thus, we can rewrite Eq. (10) as
| (11) |
where the dependence on r enters the function through the second sum and the position of the CD is taken to be the origin. Minimizing the energy in the above expression with respect to {yi}, subject to the boundary conditions that yi=0 = yh (the height the chain must be lifted to enter the catalytic domain tunnel) and yi=N =y(0) (the equilibrium bond length in the unperturbed region of the crystal), we obtain, for each discrete value of r, the profile and its corresponding energy H(r). We note that models of molecular motors elastically coupled to a “free” bead have been previously studied29,30. The novelty of our model lies in the coupling potential, which features an interesting interplay between the linker energy and the cellulose profile energy. Furthermore, the previous work concerns a passive bead whose principal role is slowing down the motor. Here, both the CBM and the CD work cooperatively in the hydrolysis.
In Fig. 3, we plot the total coupling energy, E(r) = H(r) + L(r), between the catalytic domain and the carbohydrate binding module. The dashed line depicts the cellulose profile potential H(r) determined by minimizing Eq. (11). The zero of energy is set relative to the unperturbed state of the cellulose crystal such that disrupting the surface by lifting the chain and/or breaking hydrogen bonds results in a positive energy. Because the monomers near the CD are lifted from the crystalline surface, their hydrogen bonds are highly stretched, perhaps even broken, according to the description given by the Morse potential. Thus, when the separation r is small, the bond disruption property of the CBM has little or no effect on the total energy of the cellulose profile. As r increases, the CBM is forced to break bonds that are increasingly more favorable to be intact, and eventually bonds that are in the unperturbed region of the crystal. For our parameters, this is achieved when r = 4, which we call r*. For r > r*, H(r) is independent of r. As shown in Fig. 3 for two different initial linker lengths, r0 =6 and r0 =10, E (r) has a nontrivial dependence on both the linker length r0 and the linker stiffness κ. In particular, E(r) is bistable in a certain range of r0 and κ. In the results section, we will discuss the implications of this observation.
Fig. 3.
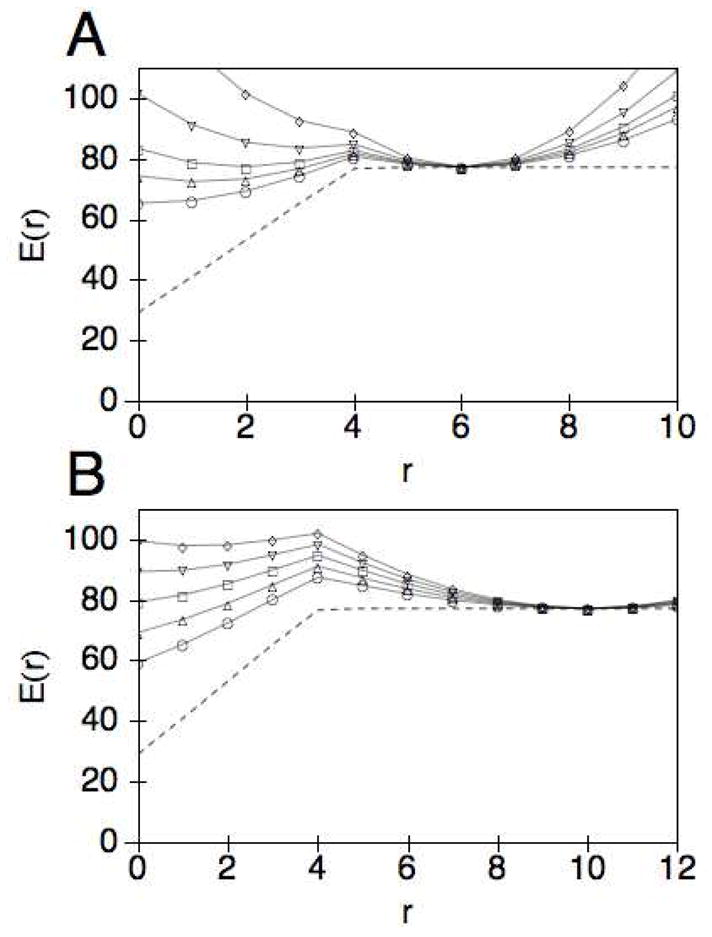
The coupling potential E(r) = H(r) + L(r) plotted as a function of the separation r for two different linker lengths. H(r) is obtained using Eq. (11) after minimizing over the height profile, with the following choice of parameters: y(0) = 0.4, =1.0, yh = 1.0, D = 12.89, a = 9.0, and γ = 33843.4 A) The coupling potential E(r) = H(r) + L(r) plotted as a function of the separation r for the linker length r0 = 6 and stiffness κ = 2(○), 2.5(△), 3(□), 4(▽), 6(◇). The profile potential H(r) alone is shown as a dashed line. B) E(r) plotted as a function of r for r0 = 10 and κ = 0.6(○), 0.8(△), 1.0(□), 1.2(▽), 1.4(◇). The profile potential is shown as a dashed line.
III. Results
The key quantity of interest in developing more efficient enzymes is the net hydrolysis rate toward the crystalline cellulose, which in our model is given by the mean velocity at steady state. To better understand the structure/function relationship of the linker, it is further useful to consider the mean separation between the CD and the CBM. We begin by discussing these two quantities, and their dependence on the properties of the linker. We follow this with a description of the fluctuation, which is informative in understanding the transition between the compressed and the extended conformations of the linker, which will also be described below.
The mean separation of the two domains is given by the probability-weighted sum
| (12) |
where Pss(r) is the steady state probability of finding the enzyme in a state defined by the separation r. The mean velocity of the cellulase is similarly given by
| (13) |
where we have used the fact that the mean velocity of the CD equals that of the enzyme and the velocity is related to the rate constant by vC (r)= kC (r) when the velocity is given in number of steps, δ, per unit time. The dispersion around the mean velocity defines the effective diffusion coefficient, given by23
| (14) |
To obtain the steady state probabilities, we note that the stationary distribution corresponds to a constant probability flux, i.e. , where we have dropped the x and t dependence from Eq. (1). Beginning from r = 0, we can write
| (15) |
from which, generalizing for any r, we obtain the following recursion relation23
| (16) |
Following the proper normalization, Eq. (16) is used to generate the steady state probability distribution of the enzyme during the hydrolysis.
Having obtained expressions for the steady state behavior of the hydrolysis, we begin by determining the mean separation 〈r〉 and the mean velocity 〈v〉 for a cellulase with an equilibrium linker length r0 = 6. From the experiments, which show that the diffusion of the CBM does not appear to hinder the hydrolysis31, we set and based on the simple requirement that the intrinsic rate constants satisfy . The persistence length lp of a polyproline peptide sequence32 has been estimated to be ~44 Å, which is on the order of the contour length of the peptide linker. Therefore, the linker can be viewed as an elastic rod of length r0. Relating the bending energy to the spring energy, taking the step length δ to be 5 Å, we estimate κmax ~ 7. In what follows, we only consider the cases for 0 ≤κ ≤κmax.
As shown in Fig. 4A, the mean separation increases monotonically with κ and is insensitive to the parameter g of the activation barrier for the CD (the curves for 5 different values of g coincide with each other). However, the mean velocity depends strongly on g, through the rate constant kC (r)in Eq. (13), as shown in Fig. 4B. In particular, as g increases, the maximum attainable 〈v〉 decreases. Furthermore, the mean velocity depends non-monotonically on the stiffness of the linker, as shown more clearly on the linear scale plot in Fig. 4C for g = 0.5. In all cases, the peak in velocity occurs during the transition from the compressed to the extended conformation of the cellulase as depicted by the corresponding plot in Fig. 4A of the average separation. The origin of the transition can be understood if one considers the two components of the coupling potential E(r). In Fig. 3A, we show that as the stiffness is increased the linker begins to dominate the coupling potential such that the minimum in energy shifts from r = 0 (for κ < 2) to r = r0 (for κ> 4), with a double well potential occurring for κ~3. This corresponds to a doubly peaked steady state probability distribution Pss(r), as shown in Fig. 5. We note that a dynamic transition in the separation distance between two domains has also been observed for two motor proteins coupled by a linear potential33. However, in that case the transition is a result of the balance between energetic and rate effects, whereas here the transition is driven primarily by the energetics of the coupling potential.
Fig. 4.

r0 = 6, A) 〈r〉 is plotted as a function of the spring stiffness κ for a range of values of the parameter g, where all plots coincide. B) A logarithmic plot of as a function of κ for g = 0.05 (long-dashed), 0.25 (solid), 0.50 (dot-dashed), 0.75 (dashed), and 0.95 (dotted), C) A linear plot of as a function of κ for g = 0.50.
Fig. 5.

Probability distribution of the separation r obtained from Eq. 21 for r0 = 6 and κ = 2.5(△), κ=3(□), and κ=4(▽). The solid lines connecting the data points correspond to and the dashed lines correspond to .
The double well feature of the energy function and the shift of the (global) energy minimum from one value of the separation r to another as the stiffness changes are reminiscent of first-order phase transitions in thermodynamics. However, because of the small number of degrees of freedom in the current problem, no true discontinuous transitions take place; only the relative weights of the two peaks change. The maximum mean velocity is obtained when the two peaks are of roughly equal weights. Because of the finite barrier that separates the two energy minima, the dynamics of the system is one where the system fluctuates between the two values of the separation, with some characteristic lifetime around each. To directly observe this feature, we have performed Kinetic Monte Carlo simulations, which produce the time evolution of a process when the rates are known34–36. Fig. 6C shows that the system jumps between r = 2 and r = 6 for the transition at κ = 3.0, which also corresponds to the peak of the mean velocity. If we compare the trajectory for κ = 3.0 to κ = 1.0 (Fig. 6D), we see that the fluctuation of the system is considerably greater at the transition. As another measure of the fluctuation, we plot the variance of the separation, defined by
Fig. 6.

A) The variance of 〈r〉 as a function of the linker stiffness κ. B) The effective diffusion constant as a function of the linker stiffness. C) and D) Separation r as a function of time (in seconds) generated using the Kinetic Monte Carlo algorithm for κ = 3.0 and κ = 1.0, respectively.
| (17) |
from which we see a strong peak at the transition (Fig. 6A). The large fluctuation is also manifested in a maximum for the diffusion coefficient (Fig. 6B). Together, these results suggest that the fluctuation is sufficiently large—and is at a maximum—during the transition from a compressed to a more extended conformation for the linker length, where the maximum mean procession rate is obtained. This ability to adopt different separations between the two domains is what gives rise to the positive synergy between the two domains, i.e., the CD helps lift the polysaccharide chain from the crystalline surface as it hydrolyzes the polymer (which is more easily accomplished at the shorter separation) while the CBM disrupts the hydrogen bonds between the polymer and the crystalline surface (which is more effectively achieved at a larger separation).
We next consider how the system behavior depends upon the intrinsic rate constants, and , as these are the parameters that protein engineering aims to alter. Using the rate constants obtained in Eqs. (5–7), Eq. (16) can be rewritten in the form
| (18) |
As before, if we assume , then
| (19) |
Setting f = g =1/2, Eq. (19) can be further simplified to the form
| (20) |
This recursion equation can be easily solved to yield
| (21) |
where Q is a normalization factor given by
| (22) |
For an immobile enzyme in which , Eq. (21) produces the Boltzmann distribution. For nonvanishing , Pss(r) remains close to the equilibrium distribution as long as , as shown in Fig. 5, for the parameters and . In fact, the energy dominance of the distribution persists for . As this ratio increases, the probability distribution begins to favor smaller values of r (dashed line)— as compared with the equilibrium distribution (filled markers)— because the CD advances faster than the CBM can diffuse back to equilibrium, forcing the linker into a more compressed conformation. In the limit where , the two domains are adjacent to each other and the CBM blocks the hydrolysis of the CD (recall kC (0) = 0).
To better understand the dependence of the average velocity on the ratio of the intrinsic rate constants, we plot the nondimensionalized velocity, , as a function of . As depicted in Fig. 7, remains essentially constant up to , implying the velocity is linearly proportional to the intrinsic rate in this regime. Note that the plateau value for the different values of the stiffness shows the same non-monotonic dependence on κ. We also see that the blockage effect at large is greater for flexible linkers, κ = 2 (○), where the decay to occurs more rapidly than for rigid linkers κ = 6 (⋄). We note that the un-scaled velocity does not decay to zero, but reaches a plateau in the limit of large . In the biological regime31, . This suggests that engineering more efficient catalytic domains, without having to consider the binding module, can already provide significant gains in improving the overall efficiency of the enzymatic hydrolysis. In this regime, increasing leads to a linear increase in 〈v〉 through Eq. (13).
Fig. 7.
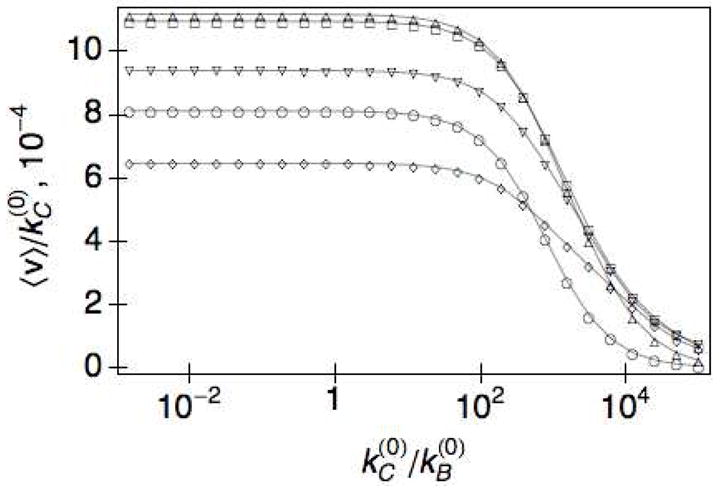
The nondimensionalized velocity, as a function of for r0 = 6 and κ = 2(○), 2.5(△), 3(□), 4(▽), 6(◇),
Lastly, we consider the case for longer linkers, e.g. r0 = 10, to examine the effects of the linker length on the hydrolysis. As can be seen in Fig. 3, the coupling potential, E(r), of the longer linker shows a marked difference from that of the shorter linker (compare Fig. 3A and B). Rather than a double well potential arising as κ is increased, the position of the minimum jumps from r = 0 to r = r0, which is analogous to a phase transition from the compact to extended conformation. As shown in Fig. 8A, this corresponds to a sharp turn of the slope at the peak of 〈v〉 (dotted line) rather than a smooth slope (dot-dashed line). We note that because of the finite number of degrees of freedom, there is no singularity in the system, but rather what appears to be a cusp in the scale of the figure. Secondly, there is a clear trend that larger values for r0 are able to reach higher 〈v〉max, as a function of κ. To understand this, recall that the maximum velocity is obtained when the separation between the CD and the CBM is free to fluctuate. This requires that the force be small, or equivalently, the slope of the composite potential be relatively flat (Fig. 8B). The spring constant should be just enough such that L(r) can counterbalance the effect of the fairly deep minimum at r = 0 in H(r). Too soft of a linker, and the enzyme will get stuck in the compact conformation; too stiff of a linker, and the enzyme will be trapped at r = r0. The linker functions to provide the separation necessary to get the CBM out of the range of influence of H(r), where larger values of r0 will need smaller values of κ. However, for r0 ≫ r*, where r* is the range of influence of the potential H(r), additional increase in the linker length r0 will not provide more gains in increasing the efficiency of the hydrolysis. As shown in Fig. 8A, the maximum in 〈v〉 approaches a limit of roughly 0.0016 . This limit is nearly attained with the linker length r0 = 20 so that there is little benefit for increasing the linker length beyond 20.
Fig. 8.

A) The average velocity as a function of the linker stiffness κ, for r0 = 60 (dashed), 20 (long-dashed), 10 (dotted), 8 (solid), 6 (dot-dashed). B) The coupling potential E(r) = H(r) + L(r), corresponding to the κ, which maximizes for the same values of r0 given above: κ = 0.025 (dashed), 0.25 (long-dashed), 1.0 (dotted), 1.5 (solid), 3.0 (dot-dashed).
IV. Conclusion
We have developed a kinetic, mesoscopic model for cellulase, using two random walkers whose dynamics are coupled by the peptide linker and the cellulose polymer. The role of the linker in the hydrolysis has been a topic of considerable controversy. Our results show that the composite potential due to the peptide linker and the cellulose polymer can give rise to a bimodal distribution for the separation of the CD and CBM, and that the optimal hydrolysis rate is obtained at the transition from a compressed to an extended conformation. At this transition, the system exhibits maximum fluctuation as measured by the variance of the separation distance between the two domains and the dispersion around the mean procession velocity. For a given linker length, the mean velocity shows a non-monotonic dependence on the stiffness of the linker, with a peak at some intermediate stiffness value. We also find that the optimal stiffness value decreases and that the maximum hydrolysis rate increases with increasing linker length.
Our study provides useful mechanistic insight to the action of the cellulase complex, as the CD and CBM domains cooperate to extract and hydrolyze a single cellulose polymer from the recalcitrant biomass. The results of this work can be useful for the design and engineering of more efficient enzymes. For example, within the range of experimentally known values of the parameters of our model, improving the intrinsic hydrolytic activity of the CD can serve to make significant gains in the overall efficiency of the enzyme, without having to alter the CBM. However, our results also suggest the importance of optimizing the linker length and stiffness, an insight that would not be obvious without the help of a model.
Acknowledgments
We thank Bradley Olsen, Frances Arnold, and Pete Heinzelman for helpful discussions. CLT thanks financial support from an NIH training grant. DEM acknowledges financial support from the Robert A. Welch Foundation (Grant F-1514) and the National Science Foundation (Grant CHE 0347862).
References
- 1.Wyman CE. Trends in Biotechnology. 2007;25:153. doi: 10.1016/j.tibtech.2007.02.009. [DOI] [PubMed] [Google Scholar]
- 2.Himmel ME, Ding SY, Johnson DK, Adney WS, Nimlos MR, Brady JW, Foust TD. Science. 2007;315:804. doi: 10.1126/science.1137016. [DOI] [PubMed] [Google Scholar]
- 3.Poon DKY, Withers SG, McIntosh LP. Journal of Biological Chemistry. 2007;282:2091. doi: 10.1074/jbc.M609670200. [DOI] [PubMed] [Google Scholar]
- 4.Receveur V, Czjzek M, Schulein M, Panine P, Henrissat B. Journal of Biological Chemistry. 2002;277:40887. doi: 10.1074/jbc.M205404200. [DOI] [PubMed] [Google Scholar]
- 5.von Ossowski I, Eaton JT, Czjzek M, Perkins SJ, Frandsen TP, Schulein M, Panine P, Henrissat B, Receveur-Brechot V. Biophysical Journal. 2005;88:2823. doi: 10.1529/biophysj.104.050146. [DOI] [PMC free article] [PubMed] [Google Scholar]
- 6.Zhong L, Matthews JF, Crowley MF, Rignall T, Talon C, Cleary JM, Walker RC, Chukkapalli G, McCabe C, Nimlos MR, Brooks CL, Himmel ME, Brady JW. Cellulose. 2008;15:261. [Google Scholar]
- 7.Zhao C, Rignall TR, McCabe C, Adney WS, Himmel ME. Chemical Physics Letters. 2008;460:284. [Google Scholar]
- 8.Din N, Damude HG, Gilkes NR, Miller RC, Warren RAJ, Kilburn DG. Proceedings of the National Academy of Sciences of the United States of America. 1994;91:11383. doi: 10.1073/pnas.91.24.11383. [DOI] [PMC free article] [PubMed] [Google Scholar]
- 9.Linder M, Teeri TT. Journal of Biotechnology. 1997;57:15. doi: 10.1016/s0168-1656(97)00088-6. [DOI] [PubMed] [Google Scholar]
- 10.Boraston AB, Bolam DN, Gilbert HJ, Davies GJ. Biochemical Journal. 2004;382:769. doi: 10.1042/BJ20040892. [DOI] [PMC free article] [PubMed] [Google Scholar]
- 11.McLean BW, Bray MR, Boraston AB, Gilkes NR, Haynes CA, Kilburn DG. Protein Engineering. 2000;13:801. doi: 10.1093/protein/13.11.801. [DOI] [PubMed] [Google Scholar]
- 12.Artyomov MN, Morozov AY, Kolomeisky AB. Physical Review E. 2008;77:040901. doi: 10.1103/PhysRevE.77.040901. [DOI] [PubMed] [Google Scholar]
- 13.Betterton MD, Julicher F. Phys Rev Lett. 2003;91:258103. doi: 10.1103/PhysRevLett.91.258103. [DOI] [PubMed] [Google Scholar]
- 14.Chou T. Physical Review Letters. 2007;99:058105. doi: 10.1103/PhysRevLett.99.058105. [DOI] [PubMed] [Google Scholar]
- 15.Fisher ME, Kolomeisky AB. Proc Natl Acad Sci U S A. 1999;96:6597. doi: 10.1073/pnas.96.12.6597. [DOI] [PMC free article] [PubMed] [Google Scholar]
- 16.Julicher F, Prost J. Phys Rev Lett. 1995;75:2618. doi: 10.1103/PhysRevLett.75.2618. [DOI] [PubMed] [Google Scholar]
- 17.Kolomeisky AB, Fisher ME. Annu Rev Phys Chem. 2007;58:675. doi: 10.1146/annurev.physchem.58.032806.104532. [DOI] [PubMed] [Google Scholar]
- 18.Qian H. Biophysical Chemistry. 2000;83:35. doi: 10.1016/s0301-4622(99)00121-0. [DOI] [PubMed] [Google Scholar]
- 19.Van Kampen NG. Stochastic Processes in Physics and Chemistry. 3. North Holland: 2007. [Google Scholar]
- 20.Divne C, Stahlberg J, Teeri TT, Jones TA. Journal of Molecular Biology. 1998;275:309. doi: 10.1006/jmbi.1997.1437. [DOI] [PubMed] [Google Scholar]
- 21.Divne C, Stahlberg J, Reinikainen T, Ruohonen L, Pettersson G, Knowles JKC, Teeri TT, Jones TA. Science. 1994;265:524. doi: 10.1126/science.8036495. [DOI] [PubMed] [Google Scholar]
- 22.Varrot A, Frandsen TP, von Ossowski I, Boyer V, Cottaz S, Driguez H, Schulein M, Davies GJ. Structure. 2003;11:855. doi: 10.1016/s0969-2126(03)00124-2. [DOI] [PubMed] [Google Scholar]
- 23.Betterton MD, Julicher F. Physical Review E. 2005:72. [Google Scholar]
- 24.Srisodsuk M, Reinikainen T, Penttila M, Teeri TT. Journal of Biological Chemistry. 1993;268:20756. [PubMed] [Google Scholar]
- 25.Rabinovich ML, Melnick MS, Bolobova AV. Biochemistry (Moscow) 2002;67:850. doi: 10.1023/a:1019958419032. [DOI] [PubMed] [Google Scholar]
- 26.Mosier N, Wyman C, Dale B, Elander R, Lee YY, Holtzapple M, Ladisch M. Bioresource Technology. 2005;96:673. doi: 10.1016/j.biortech.2004.06.025. [DOI] [PubMed] [Google Scholar]
- 27.Lehtio J, Sugiyama J, Gustavsson M, Fransson L, Linder M, Teeri TT. Proceedings of the National Academy of Sciences of the United States of America. 2003;100:484. doi: 10.1073/pnas.212651999. [DOI] [PMC free article] [PubMed] [Google Scholar]
- 28.Peyrard M, Bishop AR. Physical Review Letters. 1989;62:2755. doi: 10.1103/PhysRevLett.62.2755. [DOI] [PubMed] [Google Scholar]
- 29.Chen YD, Yan B, Rubin RJ. Biophysical Journal. 2002;83:2360. doi: 10.1016/S0006-3495(02)75250-8. [DOI] [PMC free article] [PubMed] [Google Scholar]
- 30.Elston TC, Peskin CS. Siam Journal on Applied Mathematics. 2000;60:842. [Google Scholar]
- 31.Jervis EJ, Haynes CA, Kilburn DG. Journal of Biological Chemistry. 1997;272:24016. doi: 10.1074/jbc.272.38.24016. [DOI] [PubMed] [Google Scholar]
- 32.Schuler B, Lipman EA, Steinbach PJ, Kumke M, Eaton WA. Proceedings of the National Academy of Sciences of the United States of America. 2005;102:2754. doi: 10.1073/pnas.0408164102. [DOI] [PMC free article] [PubMed] [Google Scholar]
- 33.Stukalin EB, Kolomeisky AB. Physical Review E. 2006:73. doi: 10.1103/PhysRevE.73.031922. [DOI] [PubMed] [Google Scholar]
- 34.Gillespie DT. Journal of Computational Physics. 1976;22:403. [Google Scholar]
- 35.Voter AF. Physical Review B. 1986;34:6819. doi: 10.1103/physrevb.34.6819. [DOI] [PubMed] [Google Scholar]
- 36.Metiu H, Lu YT, Zhang Z. Science. 1992;255:1088. doi: 10.1126/science.255.5048.1088. [DOI] [PubMed] [Google Scholar]