

Abstract
The Listeria monocytogenes genome contains more than 20 genes that encode cell surface–associated internalins. To determine the contributions of the alternative sigma factor σB and the virulence gene regulator PrfA to internalin gene expression, a subgenomic microarray was designed to contain two probes for each of 24 internalin-like genes identified in the L. monocytogenes 10403S genome. Competitive microarray hybridization was performed on RNA extracted from (i) the 10403S parent strain and an isogenic ΔsigB strain; (ii) 10403S and an isogenic ΔprfA strain; (iii) a (G155S) 10403S derivative that expresses the constitutively active PrfA (PrfA*) and the ΔprfA strain; and (iv) 10403S and an isogenic ΔsigBΔprfA strain. σB- and PrfA-dependent transcription of selected genes was further confirmed by quantitative reverse-transcriptase polymerase chain reaction. For the 24 internalin-like genes examined, (i) both σB and PrfA contributed to transcription of inlA and inlB, (ii) only σB contributed to transcription of inlC2, inlD, lmo0331, and lmo0610; (iii) only PrfA contributed to transcription of inlC and lmo2445; and (iv) neither σB nor PrfA contributed to transcription of the remaining 16 internalin-like genes under the conditions tested.
Introduction
Listeria monocytogenes is a gram-positive, facultative intracellular pathogen responsible for severe foodborne infections in mammals and a variety of other vertebrates (reviewed in Low and Donachie, 1997; Vazquez-Boland et al., 2001). Internalin proteins play a critical role in the ability of this pathogen to promote its internalization into a number of different nonphagocytic mammalian cells (Cabanes et al., 2002; Bonazzi and Cossart, 2006). L. monocytogenes strains differ in the number of internalin genes encoded in their genomes; the four strains sequenced to date have between 24 and 29 internalin genes (Nelson et al., 2004). A total of 11 internalins (InlA, InlB, InlC, InlC2, InlD, InlE, InlF, InlG, InlH, InlI, and InlJ) have been characterized through phenotypic analyses of strains bearing appropriate null mutations. Of these, null mutations in four internalin genes (inlA, inlB, inlC, and inlJ) resulted in reduced invasion or virulence in tissue culture or animal models (Engelbrecht et al., 1996; Dramsi et al., 1997; Raffelsbauer et al., 1998; Sabet et al., 2005). While the specific functions of the majority of L. monocytogenes internalins are currently undefined, this family of proteins appears to have diverse roles in the physiology and virulence of this pathogen (Popowska and Markiewicz, 2006).
Many L. monocytogenes genes involved in virulence are at least partially controlled by the pleiotropic transcriptional activator PrfA (Chakraborty et al., 1992). Among the internalins, both InlA and InlB are partially controlled by PrfA (Lingnau et al., 1995), while the inlC gene contains overlapping PrfA-dependent and -independent promoters (Luo et al., 2004). The stress responsive alternative sigma factor σB also regulates transcription of a number of genes with confirmed or suspected roles in L. monocytogenes virulence (Kazmierczak et al., 2003, 2006; Garner et al., 2006), including, but not limited to, internalin genes such as inlA and inlB (Kim et al., 2004; Kazmierczak et al., 2006; McGann et al., 2007b). Mounting evidence supports the existence of an adaptive transcriptional regulatory network between L. monocytogenes PrfA and σB that includes σB-dependent regulation of prfA transcription as well as coregulation of selected virulence genes (e.g., bsh) by both PrfA and σB (Chakraborty et al., 1992; Bohne et al., 1996; Wiedmann et al., 1998; Nadon et al., 2002; Kazmierczak et al., 2003, 2006; Kim et al., 2005; Rauch et al., 2005; Gray et al., 2006). Interestingly, as a ΔsigB null mutant is attenuated after intragastric, but not after intravenous, infection of guinea pigs (Garner et al., 2006), σB appears to be particularly important for regulating transcription during the gastrointestinal stages of L. monocytogenes infection, while PrfA appears to be more important during the systemic and intracellular stages of infection (Kazmierczak et al., 2006). We thus hypothesized that identification and characterization of L. monocytogenes internalin-like genes as PrfA- and/or σB-dependent could provide insight into whether specific internalins are likely to be expressed during gastrointestinal or systemic stages of infection, thus contributing to our understanding of the various, and still undefined, roles of the different L. monocytogenes internalins.
To determine relative contributions of σB and PrfA to internalin gene expression, we used a subgenomic microarray containing the 24 internalin-like genes identified in L. monocytogenes strain 10403S, including those encoding the 11 currently characterized internalins. Transcriptional contributions of σB and PrfA were also confirmed by quantitative reverse-transcriptase polymerase chain reaction (qRT-PCR) for selected genes.
Materials and Methods
Bacterial strains and growth
L. monocytogenes 10403S (serotype 1/2a [Bishop and Hinrichs, 1987]) and three isogenic, nonpolar null mutants, including ΔsigB (FSL A1-254 [Wiedmann et al., 1998]), ΔprfA (FSL B2-046 [Wong and Freitag, 2004]), and ΔsigB ΔprfA (FSL B2-068 [McGann et al., 2007b]) were used in this study. Strain NF-L753, an otherwise isogenic 10403S strain that contains the (G155S) prfA* allele, which encodes a constitutively active PrfA protein referred to as PrfA*, was kindly provided by Nancy Freitag (University of Washington, Seattle).
To enhance the relative proportion of cells in log phase, for all experiments, each strain was grown in brain heart infusion (BHI) broth at 37°C with shaking (200 rpm) to OD600 = 0.4, then diluted 1:100 into fresh BHI and grown to OD600 = 0.4. Cells were then exposed to conditions previously reported to activate PrfA or σB (0.2% charcoal or 0.3 M NaCl, respectively [Ripio et al., 1996; Sue et al., 2003]). Specifically, to collect RNA for identification of PrfA-dependent genes, 0.2% charcoal was added to early-log phase (OD600 = 0.4) 10403S and ΔprfA cells, which were subsequently incubated with shaking for 120 minutes at 37°C. To collect RNA for identification of PrfA- and σB-dependent genes, early-log phase 10403S and ΔsigBΔprfA cells were incubated with shaking for 120 minutes at 37°C in BHI with 0.2% charcoal with NaCl added (0.3 M final concentration) for the final 10 minutes. To collect RNA for identification of σB-dependent genes, early-log phase 10403S and ΔsigB cells were incubated for 120 minutes in BHI with NaCl added (0.3 M final concentration) for the final 10 minutes. To collect RNA for identification of PrfA-dependent genes in the prfA* strain, early-log phase prfA* and ΔprfA cells were subsequently incubated for 120 minutes in BHI. Following each treatment, RNA was stabilized by the addition of two volumes of RNAprotect™ (Qiagen, Valencia, CA). Bacterial cells were then harvested by centrifugation and stored at −80°C for no longer than 24 hours before RNA isolation. A total of three independent replicates were completed on three different days for each experiment.
RNA collection and purification
Total RNA was extracted as previously described (Kazmierczak et al., 2006) except that contaminating DNA was removed using Turbo DNase according to the manufacturer's instructions (Ambion Inc., Austin, TX). Purified RNA was precipitated and stored at −80°C.
Identification of internalin and internalin-like genes in L. monocytogenes 10403S
A total of 11 internalin genes were previously identified in the L. monocytogenes 10403S genome (inlA, inlB, inlC, inlC2, inlD, inlE, inlF, and inlG [Tsai et al., 2006] and lmo0171, lmo0801, and lmo2026 [S. Milillo and M. Wiedmann, unpublished results]). To determine if additional internalin genes might be present in the 10403S genome, we designed primers (see Suppl. Table S1; all supplementary materials are available at www.liebertpub.com/fpd) for the 15 internalin-like genes that are present in L. monocytogenes EGD-e (Nelson et al., 2004), but that had not previously been reported in 10403S. We reasoned that the EGD-e genome was an appropriate template as both EGD-e and 10403S are serotype 1/2a (Glaser et al., 2001; Zhang et al., 2003) and both belong to the L. monocytogenes phylogenetic lineage II (Piffaretti et al., 1989; Zhang et al., 2003). While 13 of the 15 targeted internalin genes were successfully amplified in strain 10403S (see Suppl. Table S1), no PCR products were obtained with the primers for lmo0549 and lmo1289. PCR for lmo0549 and lmo1289 was repeated with three additional primer sets designed to target different regions of both genes, but no products were generated with any of the four primer sets. Therefore, PCR products from 13 internalin genes were sequenced to enable design of the 70-mer oligonucleotide probes for use in the microarray; PCR product purification and sequencing was performed using standard procedures previously described by our group (Tsai et al., 2006).
When the genome sequence for L. monocytogenes 10403S (Anonymous, 2007), the parent strain used here, became available (after completion of the experiments described here), nucleotide and Protein BLAST searches using the internalin and internalin-like gene sequences from EGD-e (Glaser et al., 2001), as well as the sequences for the seven internalin genes found in L. monocytogenes F2365 and F6854 (Nelson et al., 2004) were performed as an additional strategy to identify internalin-like genes in 10403S. None of the internalin genes unique to F2365 and F6854 were identified in 10403S. While the BLAST searches confirmed the absence of lmo1289 from the 10403S genome (as predicted by our PCR results), a 10403S gene with ∼75% identity with EGD-e lmo0549 was identified. The genome of 10403S was further examined for the presence of leucine-rich repeats, a feature conserved among currently recognized internalin proteins (Kobe and Deisenhofer, 1995). This approach confirmed the existence of the 25 internalins and internalin-like genes identified through the strategies described above; no additional, novel internalin-like genes were identified. In summary, L. monocytogenes 10403S contains 25 internalin and internalin-like genes, including inlC2 and inlD rather than inlH, which is present in EGD-e, and lmo0549. Consequently, with the exception of lmo0549, the microarray used in the study described here is an appropriate tool for monitoring transcript levels for the 24 remaining internalin and internalin-like genes present in 10403S.
Design and validation of 70-mer oligonucleotides for microarray
ArrayOligoSelector (http://arrayoligosel.sourceforge.net/) was used to design two 70-mer oligonucleotides for each target gene included in the subgenomic microarray (see Suppl. Table S2, which also shows the primers positions in each gene). A concatenated sequence containing the 24 internalin genes determined to be present in the 10403S genome (including the inlC2 and inlD sequences from strain 10430S and excluding inlH, which is present in EGD-e, but not in 10403S), 25 housekeeping genes, and four control genes (prfA, sigB, the PrfA-dependent plcA, and the σB-dependent opuCA) was used as input for ArrayOligoSelector. As both PrfA and σB are auto-regulated (Mengaud et al., 1991; Becker et al., 1998), the genes encoding each protein (i.e., prfA and sigB) as well as genes that are regulated by each protein (i.e., plcA and opuCA) were included to allowed us to determine if increased transcript levels for genes regulated by each protein occurred in parallel with (i) increased transcription of the genes encoding the regulators; (ii) increased activity of regulators; or (iii) both. To ensure homology between each oligonucleotide and the targeted L. monocytogenes 10403S sequence, a region comprising 100 nt upstream and downstream of each 70-mer oligonucleotide was sequenced; all oligonucleotides showed greater than 95% homology with the L. monocytogenes 10403S sequences (Suppl. Table S2).
Microarray preparation and printing
Microarray preparation and printing were performed as described by McGann et al. (2007a). Briefly, oligonucleotides (Suppl. Table S2)were synthesized by Operon Biotechnologies Inc. (Huntsville, AL). Prior to use, oligonucleotides were suspended in 3 × SSC to a final concentration of 30 mM. To assist in background correction, 70-mer oligonucleotides targeting five yeast genes encoding the mating pheromone α-factors (mfα1, mfα2), mating-type α-factor pheromone receptor (ste3), actin (act1), and a GTP-binding protein involved in the regulation of the cyclic AMP pathway (ras1), were used for negative controls (Wu et al., 2001). To assist in signal normalization, serial dilutions of 10403S chromosomal DNA ranging in concentration from 200 ng/μL to 0.78125 ng/μL were prepared in printing buffer and spotted. All oligonucleotides and controls were spotted in duplicate on Corning Ultra-GAPS slides (Corning, NY) using a custom built XYZ microarrayer.
Probe labeling and microarray hybridization
Probe labeling and microarray hybridization were performed as described by McGann et al. (2007a). Briefly, cDNA was synthesized from 10 μg purified total RNA and labeled with Alexa Fluor® dyes using the SuperScript™ Plus Indirect cDNA labeling system (Invitrogen Inc., Carlsbad, CA). For the strains to be compared, labeled cDNA was resuspended in 50 μL of hybridization buffer (5×SSC, 0.1% SDS, 0.1mM dithiothreitol (DTT), 0.5×formamide, 600 μg/mL salmon sperm DNA), denatured at 95°C for 5 minutes, then applied to the slides using mSeries LifterSlips™ (Erie Scientific, Portsmouth, NH). Hybridization was conducted in a water bath at 42°C overnight. The slides were dried by centrifugation and scanned using a GenePix 4000b scanner (Axon Instruments Inc., Foster City, CA). Acquired images were analyzed using GenePix Pro 6.0 (Molecular Devices Corp., Sunnyvale, CA).
Microarray data analysis
Analyses of microarray data were performed in R (http://www.R-project.org) with Bioconductor (Gentleman et al., 2004) using LIMMA software (Smyth, 2005) as described by McGann et al. (2007a). For normalization within arrays, the data were weighted for the housekeeping genes and genomic DNA controls and normalized using print-tip loess (Smyth and Speed, 2003). Finally, between-array normalization was performed by application of scale-normalization to scale the log-ratios to the same median-absolute-deviation across arrays.
Due to the small number of targeted genes, two complete arrays were printed on each microarray slide. As two different probes, printed in duplicate, were used for each gene on a single array, the microarray design generated eight replicate spots for each gene per slide. Expression profiles were measured from three independent RNA extractions, resulting in 24 replicate spots per gene (12 from each probe). To provide the most comprehensive and robust analyses of these data, results from the two independent probes for each gene were analyzed and reported separately. In addition, the two arrays on each slide were treated as independent blocks for statistical examination and analyzed accordingly. A linear model was fitted to the normalized log ratios and four B-statistics, t-statistics, and p values were generated for each gene (resulting in four separate expression profiles with corresponding p values for each gene representing two different 70-mer micro-array probes in each of two separate array blocks on the same slide). Raw data and microarray files in MIAME format are available through the Gene Expression Omnibus (GEO) (Edgar et al., 2002; Barrett et al., 2005) with accession number GSE6471.
Quantitative RT-PCR using TaqMan
All TaqMan primers and probes (Suppl. Table S3)were designed using Primer Express software (Applied Biosystems, Foster City, CA). Probes with MGB quencher dye were synthesized by Applied Biosystems and probes with QSY7 quencher dye were synthesized by MegaBases Inc. (Evanston, IL). Quantitative RT-PCR was performed in 25 μL reactions as previously described (Kazmierczak et al., 2006) using iTaq Supermix with Rox (BioRad, Hercules, CA). All qRT-PCR experiments were performed in triplicate from the same three RNA isolations used to perform microarray analyses. Absolute transcript levels were normalized to the geometric mean of the two housekeeping genes rpoB and gap as described previously (Chaturongakul and Boor, 2006; Kazmierczak et al., 2006); all data were log transformed to achieve a normal distribution. To compare transcript levels from two strains or conditions, standard two-sample t tests were employed. To compare transcript levels from more than two strains or conditions, a one-way ANOVA with Tukey's multiple comparison procedure was used for data analysis. All statistical analyses were performed in S-Plus 6.2 (Insightful Corp, Seattle, WA).
Results
Competitive hybridization using a subgenomic microarray targeting 24 internalin-like genes present in L. monocytogenes 10403S as well as (i) prfA, (ii) the PrfA-dependent gene plcA, (iii) sigB, and (iv) the σB-dependent gene opuCA, was performed on RNA extracted from 10403S and three otherwise isogenic strains (ΔsigB, ΔprfA, and ΔsigBΔprfA) grown under conditions reported to maximize expression of the active state of PrfA, σB, or both (Ripio et al., 1996; Sue et al., 2003). As no differences in transcript levels for any internalin genes were found between 10403S and the ΔprfA strain under conditions reported to maximize PrfA activity (growth in BHI with activated charcoal; Ripio et al., 1996), competitive hybridization was also performed with the ΔprfA strain and a 10403S strain with the prfA* (G155S) allele, which expresses the constitutively active PrfA* protein (Shetron-Rama et al., 2003). Therefore, in total, four different competitive microarray hybridizations were performed, including (i) 10403S and ΔsigB, (ii) 10403S and ΔprfA, (iii) 10403S prfA* and ΔprfA, and (iv) 10403S and ΔsigBΔprfA. σB- and PrfA-dependent expression of selected genes was also confirmed by quantitative RT-PCR.
Validation of microarrays by qRT-PCR
Initial examination of the microarray expression profiles indicated that 21 genes, including 18 internalin-like genes, were differentially regulated by σB and/or PrfA (Table 1), as supported by significantly higher transcript levels in the parent strain for at least one probe in at least one of the four strain comparisons. Ten genes, however, only showed significantly higher transcript levels in one probe in a given strain comparison (e.g., lmo0327 in the 10403S–ΔsigB comparison; Table 1)or only for the probe(s) in one of the two blocks printed on a given glass slide (e.g., lmo0262 in the 10403S–ΔsigB comparison; Table 1).Overall, eight internalin genes and three control genes (plcA, prfA, and opuCA) showed significant differential regulation for both probes and for both array blocks in at least one of the four comparisons (Table 1, genes marked with **). To confirm the microarray data, we performed qRT-PCR to validate differential transcription of (i) two genes (lmo0331 and lmo0610) that showed significant differences for both probes and in both blocks in each microarray comparison with a ΔsigB strain; (ii) a total of eight genes that showed inconsistent evidence for differential expression in the 10403S–ΔsigB (lmo0327), the 10403S–ΔsigBΔprfA (lmo0801, lmo1290, lmo2027), or both (lmo0514, lmo0732, lmo2026, lmo2396) comparisons, (iii) one control gene (lmo2470) that did not show evidence of differential expression in any microarray comparison; (iv) and lmo2445, which showed a consistently significant, but ≤1.5-fold, difference in transcript levels in the 10403S–ΔsigB microarray experiments. Quantitative RT-PCR on the eight selected genes that showed inconsistent evidence of differential expression (lmo0327, lmo0514, lmo0732, lmo0801, lmo1290, lmo2026, lmo2027, lmo2396) found no significant differences in transcript levels for these genes between the wildtype and the appropriate mutant (ΔsigBΔprfA or ΔsigB; Suppl. Table S4).Transcript levels for inlG and inlE, the other two genes that showed inconsistent differential expression in this study, were reported not to differ between the wildtype and ΔsigB strains by qRT-PCR analysis (McGann et al., 2007b). Quantitative RT-PCR also showed that differences in transcript levels were not significant for the one gene (i.e., lmo2445) that showed consistently significant differential expression in the 10403S–ΔsigB microarray comparison (i.e., significant differences in both probes and both blocks), although at ratios ≤1.5. Thus, a given gene was only considered to be differentially expressed if (i) both probes and both blocks showed significant differences and (ii) transcript ratios were >2.0, consistent with previous reports by others (Milohanic et al., 2003; Chatterjee et al., 2006).
Table 1.
Summary of Microarray Results
| |
Differences in transcript levels in comparisons betweenb |
|||||||
|---|---|---|---|---|---|---|---|---|
| |
10403S/ΔsigB |
10403S/ΔprfA |
prfA*/ΔprfA |
10403S/ΔsigBΔprfA |
||||
| Gene locus (common name)a | Probe 1 | Probe 2 | Probe 1 | Probe 2 | Probe 1 | Probe 2 | Probe 1 | Probe 2 |
| lmo0171 | — | — | —/— | —/— | —/— | —/— | —/— | —/— |
| lmo0262 (inlG)* | 3/— | 2.6/— | —/— | —/— | —/— | —/— | 2.8/— | —/— |
| (inlC2)** | 60/52 | 50/47 | —/— | —/— | —/— | —/— | 63/58 | 49/38 |
| (inlD)** | 12/10 | 18/19 | —/— | —/— | —/— | —/— | 22/18 | 16/15 |
| lmo0264 (inlE)* | 2/— | —/— | —/— | —/— | —/— | —/— | —/— | —/— |
| lmo0327* | 2.5/2.4 | —/— | —/— | —/— | —/— | —/— | —/— | —/— |
| lmo0331** | 2.7/2.5 | 3.3/3.2 | —/— | —/— | —/— | —/— | 2.4/3 | 2.7/3.1 |
| lmo0333 (inlI) | —/— | —/— | —/— | —/— | —/— | —/— | —/— | —/— |
| lmo0409 (inlF) | —/— | —/— | —/— | —/— | —/— | —/— | —/— | —/— |
| lmo0433 (inlA)** | 42/44 | 40/46 | —/— | —/— | 2.2/2.3 | 2.1/2.6 | 86/111 | 114/105 |
| lmo0434 (inlB)** | 39/38 | 21/20 | —/— | —/— | 2.1/2.4 | 3.2/2.9 | 108/120 | 91/92 |
| lmo0514* | 1.6/1.5 | 1.4/— | —/— | —/— | —/— | —/— | 4.6/4.4 | —/— |
| lmo0610** | 27/24 | 20/21 | —/— | —/— | —/— | —/— | 29/22 | 31/28 |
| lmo0732* | 2/— | —/— | —/— | —/— | —/— | —/— | —/— | 3.3/— |
| lmo0801* | —/— | —/— | —/— | —/— | —/— | —/— | 2/— | —/— |
| lmo1136 | —/— | —/— | —/— | —/— | —/— | —/— | —/— | —/— |
| lmol290* | —/— | —/— | —/— | —/— | —/— | —/— | 2.9/— | —/— |
| Imol 786 (inlC)** | —/— | —/— | —/— | —/— | 2.4/2.4 | 2.6/2.5 | —/— | —/— |
| lmo2026* | 1.9/1.3 | —/— | —/— | —/— | —/— | —/— | —/— | 2.5/4 |
| lmo2027* | —/— | —/— | —/— | —/— | —/— | —/— | 2.1/— | —/— |
| lmo2396* | 2.2/— | —/— | —/— | —/— | —/— | —/— | 2.9/— | —/— |
| lmn2445** | 1.4/1.3 | 1.5/1.4 | —/— | —/— | 2.8/3.1 | 2.4/2.5 | —/— | —/— |
| lmo2470 | —/— | —/— | —/— | —/— | —/— | —/— | —/— | —/— |
| lmo2821 (inlJ) | —/— | —/— | —/— | —/— | —/— | —/— | —/— | —/— |
| lmo0201 (plcA)** | —/— | —/— | 13/12 | 11/10 | 53/55 | 47/49 | 8.1/8.3 | 10.5/9.3 |
| lmo0200 (prfA)** | 2.6/2.4 | 1.9/2 | NA | NA | NA | NA | NA | NA |
| lmol428 (opuCA)** | 24/23 | 34/34 | —/— | —/— | —/— | —/— | 33/35 | 35/33 |
| lmo0895 (sigB) | NA | NA | —/— | —/— | —/— | —/— | NA | NA |
Gene locus and common name are based on the annotation of the Listeria monocytogenes EGD-e genome available at NCBI (http://www.ncbi.nlm.nih.gov), accession number AL591824. A single asterisk * indicates genes showing a significant difference in spot intensities in just one of the two probes and/or one of the two array blocks. A double asterisk ** indicates genes showing a significant difference in spot intensities with both probes and array blocks.
Differences in transcript levels expressed as fold differences were calculated using Bioconductor for R (http://www.bioconductor.org/biocLite.R) based on the microarray data, and equal the average spot intensity for the first strain listed (10403S parent strain or prfA*) divided by the average spot intensity for the second strain listed (i.e., the mutant strain). Each probe, which was reported separately, consists of two expression values corresponding to the average parent strain spot intensity divided by the average mutant spot intensity from the upper and lower arrays from three separate slides from each of three replicate RNA isolations. For example, the value 60/52 indicates a 60-fold and a 52-fold change in spot intensities for the gene between the parent and mutant strain from the upper and lower array, respectively (See Methods for further details). Dashes (—) indicate no significant difference in spot intensities. NA indicates not applicable (since the target gene for the probe was absent from the mutant strain).
To further evaluate correlations between qRT-PCR and microarray data, log transformed fold differences based on qRT-PCR and based on microarray data for probe 1 only, probe 2 only, and both probes were each plotted against each other (Fig. 1); qRT-PCR data for inlA, inlB, inlC, inlC2, inlD, inlE, inlG, and prfA transcript levels for the 10403S–ΔsigB comparison as well as for inlA, inlB, inlC2, inlD, inlG, and plcA transcript levels for the 10403S–ΔsigBΔprfA comparison have been reported elsewhere (McGann et al., 2007b). If both methods yield identical results, the slope from the comparisons would equal 1 when the data are plotted against each other, as in Fig. 1. A higher Pearson correlation coefficient (R2) was achieved if analyses were conducted using the average value obtained from both microarray probes for a given gene (Fig. 1A; R2 = 0.8454) rather than just probe 1 (Fig. 1B; R2 = 0.7358) or probe 2 (Fig. 1C; R2 = 0.7952), indicating that the use of two probes per gene rather than one, results in a better linear correlation between qRT-PCR and microarray analyses.
FIG. 1.
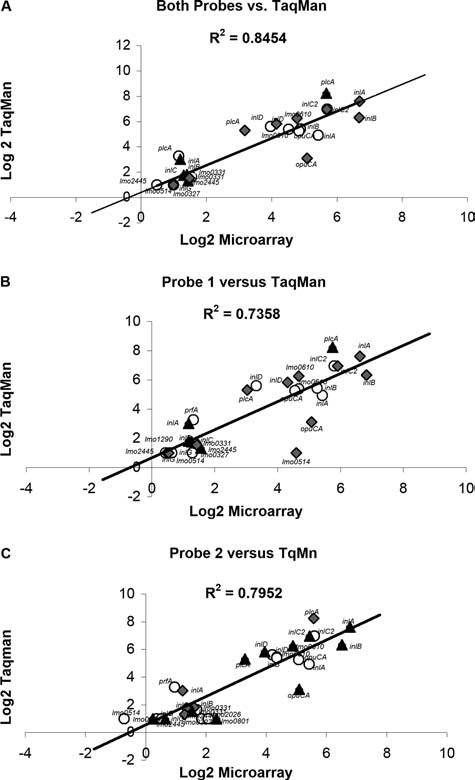
Correlation between quantitative reverse-transcriptase polymerase chain reaction (qRT-PCR) (TaqMan) results and microarray results based on (A) the average of both probes, (B) probe 1 only, and (C) probe 2 only. Fold changes in expression in the 10403S parent strain relative to the 10403S ΔsigB strain (○), the PrfA* strain relative to the 10403SΔprfA strain (♦), and the 10403S parent strain relative to the 10403SΔsigBΔprfA strain (▴) were log transformed and plotted against each other to evaluate correlations. Quantitative RT-PCR data for inlA, inlB, inlC, inlC2, inlD, inlE, inlG, and prfA transcript levels for the 10403S–ΔsigB comparison as well as inlA, inlB, inlC2, inlD, inlG, and plcA transcript levels for the 10403S–ΔsigBΔprfA comparison have been reported elsewhere (McGann et al., 2007b).
σB-dependent transcription of internalin-like genes in L. monocytogenes
As exposure of log-phase L. monocytogenes to 0.3 M NaCl in BHI for 10 minutes results in high levels of σB activity (Sue et al., 2003), competitive hybridization was performed with RNA isolated from 10403S and the ΔsigB strain cultured under these conditions. Analyses of the microarray expression profiles revealed that six internalin genes (inlA, inlB, inlC2, inlD, lmo0331, and lmo0610), and the σB-dependent gene opuCA had significantly higher transcript levels in the parent strain as compared to the ΔsigB strain in both probes and in both blocks (Table 2).Differences in transcript levels between 10403S and the ΔsigB strain were particularly high (>10-fold) for inlA, inlB, inlC2, inlD, opuCA, and lmo0610, while lmo0331 showed less than fourfold higher transcript levels in 10403S (Table 2).
Table 2.
Internalin and Internalin-Like Genes Showing Significant Changes in Transcript Levels
| |
Differences in transcript levels for comparisons betweenb |
|||||||
|---|---|---|---|---|---|---|---|---|
| |
10403S/ΔsigB |
10403S/ΔprfA |
PrfA*/ΔiprfA |
10403S/ΔsigBΔprfA |
||||
| Gene locus (common name)a | Microarray | TaqMan | Microarray | TaqMan | Microarray | TaqMan | Microarray | TaqMan |
| inlC2 | 52 | 125* | NS | NS | NS | — | 52 | 125* |
| InlD | 15 | 49* | NS | NS | NS | — | 18 | 57* |
| lmo0331 | 2.9 | 3 | NS | — | NS | NS | 3.1 | 2.9 |
| lmo0433 (inlA) | 43 | 30* | NS | NS | 2.3 | 8.1 | 104 | 197* |
| lmo0434 (inlB) | 29 | 43* | NS | NS | 2.7 | 3.5 | 103 | 80* |
| lmo0610 | 23 | 42 | NS | NA | NS | — | 28 | 76 |
| lmol786 (inlC) | NS | NS | NS | NS | 2.5 | 3.4 | NS | NS |
| lmo2445 | NS | — | NS | — | 2.7 | 2.5 | NS | NS |
| opuCA | 29 | 38* | NS | NS | NS | NS | 34 | 40* |
| plcA | NS | NS | 11.4 | 73* | 51 | 302 | 9 | 9 |
| prfA | 2.2 | NS | NA | NA | NA | NA | NA | NA |
Gene locus and common name are based on the annotation of the Listeria monocytogenes EGD-e genome available at NCBI (http://www.ncbi.nlm.nih.gov), accession number AL591824.
Differences in transcript levels are expressed as fold differences between the first strain listed (10403S parent strain or prfA*) and the second strain listed (i.e., the mutant strain). Differences in transcript levels based on the microarray data were calculated using Bioconductor for R (http://www.bioconductor.org/biocLite.R), and equal the average spot intensity for the first strain listed (10403S parent strain or prfA*) divided by the average spot intensity for the second strain listed (i.e., the mutant strain) from each of three replicate RNA isolations spotted on three separate slides containing two arrays with two probes per gene per array (see Methods for details). Differences in transcript levels based on TaqMan data represent the absolute difference in mRNA transcript levels (normalized to the geometric mean of rpoB and gap transcript levels) between the first strain listed (10403S parent strain or prfA*) and the second strain listed (i.e., the mutant strain). Fold changes are only presented where statistically significant using an α value of 0.05. Values marked with an asterisk (*) were reported elsewhere (McGann et al., 2007b). NS indicates no significant difference in mRNA transcript levels; dashes (—) indicate quantitative reverse-transcriptase polymerase chain reaction (qRT-PCR) was not performed; NA indicates not applicable (since the target gene for the probe was absent from the mutant strain).
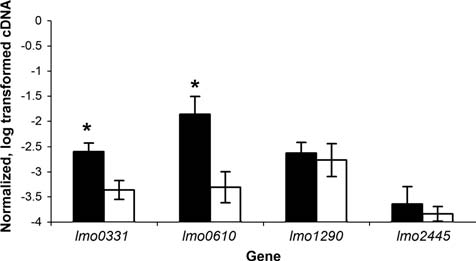
As σB-dependent transcription of inlA, inlB, inlC2, and inlD was previously confirmed by qRT-PCR (Kim et al., 2005; McGann et al., 2007b), qRT-PCR was only used to confirm σB-dependent gene transcription of five internalin genes (lmo0327, lmo0331, lmo0514, lmo0610, and lmo1290) (Fig. 2). For lmo0331 and lmo0610, qRT-PCR showed significantly higher transcript levels in 10403S compared to the ΔsigB mutant, consistent with the microarray data, which provided strong evidence for σB-dependent transcription of these genes. Consistent with these results, HMM searches (described by Raengpradub et al., 2008) identified putative σB promoter sites 55 and 84 nt upstream of lmo0331 and lmo0610, respectively (Fig. 3A). Quantitative RT-PCR found no significant differences in lmo0327, lmo0514, and lmo1290 transcript levels between 10403S and the ΔsigB mutant (Fig. 2), consistent with the observation that lmo0327 and lmo0514 showed significant differences in transcript levels only with one probe (lmo0327) or with less than a twofold change (lmo0514).
FIG. 2.
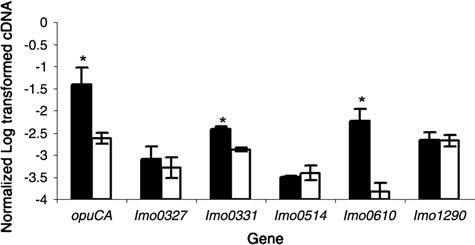
Transcript levels determined by quantitative reverse-transcriptase polymerase chain reaction (qRT-PCR) for selected genes identified as differentially expressed between the 10403S parent strain and the ΔsigB strain based on one or both probes in the microarray. lmo1290 was included as a negative control; the microarray did not reveal any differences in transcript levels between 10403S and the ΔsigB strain for this gene. Transcript levels were quantified by qRT-PCR and normalized (see Methods), and are represented on the y-axis as log10 values. Dark and light bars represent the 10403S parent strain and the ΔsigB strain, respectively. Data represent the mean of results from qRT-PCR experiments using three independent RNA isolations; error bars represent one standard deviation. An asterisk indicates that transcript levels for a given gene are significantly different between 10403S and the ΔsigB strain.
FIG. 3.
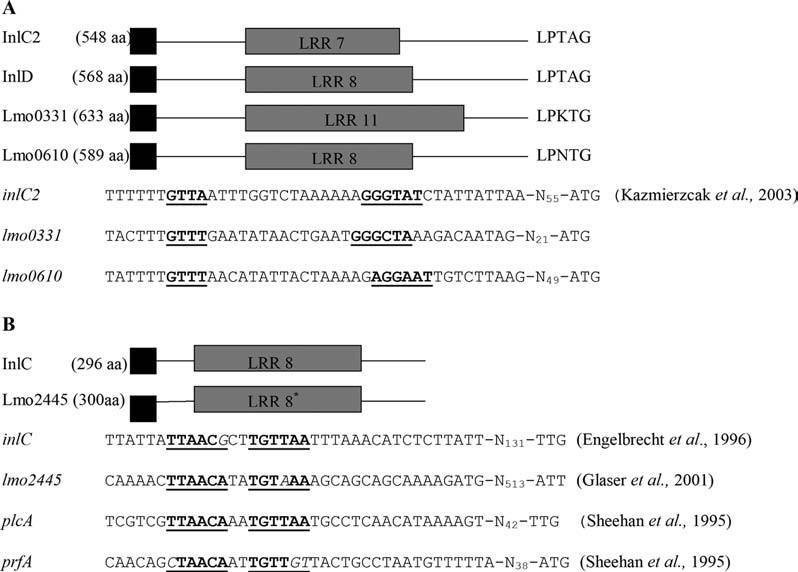
Representation of (A) the structures of the four internalins encoded by σB-dependent genes, including the promoter region DNA sequences for these genes, and (B) the structures of the two internalins encoded by PrfA-dependent genes, including the promoter region sequences for these genes. The numbers within the gray shaded areas indicate the number of leucine-rich repeat units within each coding region (Raffelsbauer et al., 1998; Hamon et al., 2006). The LPXTG motif for proteins covalently anchored to the cell wall is also indicated. The total number of amino acids in each protein is listed next to the protein name. The DNA sequences corresponding with (A) the σB promoter sequences and (B) the PrfA binding domains (PrfA-box) are underlined and in bold and their distance from each start codon for each reading frame is shown. The PrfA box upstream of plcA, which has a perfect palindromic sequence, and upstream of prfA, which differs from the perfect palindrome by three mismatches, are shown for comparison. Mismatches are underlined and in italics. No σB promoter sequence is given for inlD in panel A as the inlC2D operon appears to be transcribed from the σB promoter upstream of inlC2, which is shown here.
PrfA-dependent transcription of internalin-like genes in L. monocytogenes
The presence of activated charcoal in growth media was previously reported to result in increased PrfA activity, as evidenced by increased transcription of PrfA-dependent genes (Ripio et al., 1996; Ermolaeva et al., 1999; Milohanic et al., 2003). Therefore, to determine the contributions of PrfA to regulation of internalin gene expression, competitive hybridization was performed on RNA isolated from the 10403S parent and ΔprfA strains grown in the presence of activated charcoal. Analyses of the microarray expression profiles revealed that only the PrfA-dependent gene plcA showed higher transcript levels in the 10403S parent strain as compared to the ΔprfA strain (Table 2), which may be due to the use of a different L. monocytogenes strain in our experiments or due to a shorter exposure time to charcoal (2 hours as compared to overnight culture in BHI with charcoal by Milohanic et al. [2003]).
As PrfA-dependent transcription of inlA, inlB, and inlC has been described previously (Lingnau et al., 1995; Engelbrecht et al., 1996; Milohanic et al., 2003; McGann et al., 2007b), we speculated that PrfA activity in L. monocytogenes 10403S grown in the presence of activated charcoal was not high enough to induce transcription of these genes to a level where PrfA-dependent transcription would be detectable by the microarray methodology used. Therefore, we used a L. monocytogenes 10403S derivative strain carrying the prfA* (G155S) allele, which expresses the constitutively active PrfA* (Shetron-Rama et al., 2003), for isolation of RNA for microarray experiments. Competitive microarray hybridization using cDNA generated from RNA isolated from the prfA* and ΔprfA strains revealed higher transcript levels for four internalin genes (inlA, inlB, inlC, and lmo2445) as well as for plcA in the prfA* strain, indicating PrfA-dependent transcription of these genes. Differential expression of plcA in the prfA* strain (as compared to the ΔprfA strain) was considerably higher than differential expression of plcA between the wildtype prfA strain (10403S) and the ΔprfA strain grown in BHI with charcoal (50-fold difference in transcript levels as compared to 12-fold, respectively; Table 2), supporting high PrfA activity in the prfA* strain.
qRT-PCR confirmed that plcA, inlA, inlB, inlC, and lmo2445 transcript levels were significantly higher in the prfA* strain as compared to the ΔprfA strain (Fig. 4; Table 2).These findings are consistent with the presence of PrfA boxes (i.e., 14 bp palindromic sequences with the consensus sequence TTAACAnnTGTTAA (Mengaud et al., 1989; Freitag et al., 1993) upstream of the inlAB operon (Dramsi et al., 1993), inlC (Engelbrecht et al., 1996), plcA (Freitag et al., 1993), and lmo2445 (Glaser et al., 2001) (Fig. 3B). Quantitative RT-PCR also showed that transcript levels for lmo2470, which did not show differential expression in the microarray and which was included as a negative control, did not differ significantly between the prfA* and the ΔprfA strains, confirming that this gene is not PrfA-dependent (Table 1).Quantitative RT-PCR also showed that transcript levels for the PrfA-dependent gene hly followed patterns similar to those observed for plcA, including higher hly transcript levels in the prfA* strain as compared to the prfA wildtype strain grown in charcoal (data not shown).
FIG. 4.
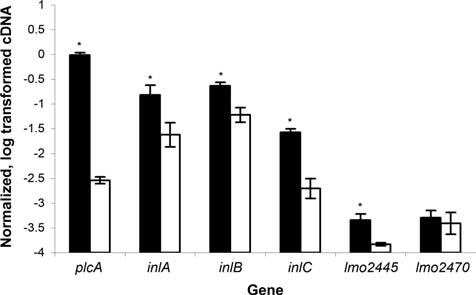
Transcript levels determined by quantitative reverse-transcriptase polymerase chain reaction (qRT-PCR) for all genes identified as differentially expressed between the prfA* (G155S) strain and the ΔprfA strain based on one or both probes in the microarray. Dark and light bars represent the prfA* (G155S) and ΔprfA strains, respectively. lmo2470 was included as a negative control; the microarray did not reveal any differences in transcript levels between the prfA* (G155S) and the ΔprfA strain for this gene. Transcript levels were quantified by qRT-PCR and normalized (see Methods), and are represented on the y-axis as log10 values. Data represent the mean of results from qRT-PCR experiments using three independent RNA isolations; error bars represent one standard deviation. An asterisk indicates that transcript levels for a given gene are significantly different between the prfA* and the ΔprfA strains.
To further compare PrfA-dependent transcription in the prfA wildtype and prfA* strains grown under different conditions, qRT-PCR data collected here were analyzed together with previously reported qRT-PCR-based transcript levels for inlA, inlB, prfA, plcA, and opuCA in bacteria exposed to activated charcoal (McGann et al., 2007b), as well as for prfA, plcA, and opuCA in bacteria present in the cytosol and vacuole of infected Caco-2 cells (Kazmierczak et al., 2006) (Fig. 5). prfA and plcA transcript levels in the prfA* strain (grown in BHI) and the 10403S parent strain present intracellularly in mammalian host cells were similar and significantly higher than prfA and plcA transcript levels for the wildtype strain grown in BHI with and without charcoal (Fig. 5B), indicating that a prfA* strain shows plcA and prfA transcription patterns similar to those in intracellular L. monocytogenes. While overall prfA transcript levels were similar for the wildtype strain grown in BHI with and without charcoal, plcA transcript levels were higher in cells grown in BHI with charcoal, suggesting that charcoal-mediated activation of PrfA sufficient to activate transcription of plcA. While inlA and inlB showed similar transcript levels in both the ΔprfA strain and the isogenic parent strain cultured in BHI as well as in the parent strain exposed to activated charcoal, transcript levels for both of these genes were significantly higher in the prfA* strain grown in BHI (Fig. 5A), consistent with the observation that the PrfA box upstream of inlAB is not a perfect palindrome and thus represents a weaker PrfA binding site, which is likely to be activated only in the presence of high levels of active PrfA or at a considerable time after initial PrfA activation (Sheehan et al., 1995; Dickneite et al., 1998). We found no significant difference in opuCA transcript levels between the ΔprfA strain and wildtype strain or prfA* strain (Fig. 5B), indicating that opuCA transcription is not PrfA-dependent, even though a previous report suggested that this gene may be regulated by PrfA (Milohanic et al., 2003).
FIG. 5.
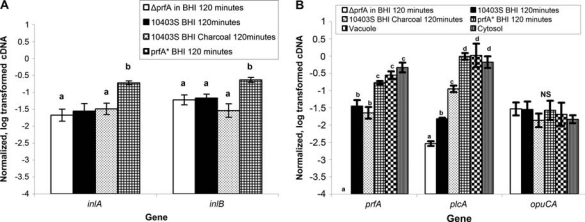
Transcript levels (based on quantitative reverse-transcriptase polymerase chain reaction [qRT-PCR] data) under different conditions and in different strains (prfA wildtype, prfA*, and ΔprfA) for (A) inlA and inlB and (B) prfA, plcA, and opuCA. Transcript levels are shown for (i) 10403S prfA wildtype in the vacuole and cytoplasm of Caco-2 cells (prfA, plcA, and opuCA only; previously reported by Kazmierczak et al., 2006); (ii) 10403S prfA wildtype (cells grown to OD = 0.4 and then exposed to brain heart infusion (BHI) with 0.2% charcoal for 2 hours) (previously reported by McGann et al., 2007b); (iii) 10403S prfA wildtype (OD = 0.4 cells grown in BHI for another 2 hours); (iv) ΔprfA (OD = 0.4 cells grown in BHI for another 2 hours); and (v) 10403S prfA* (OD = 0.4 cells grown in BHI for another 2 hours). Transcript levels were quantified using qRT-PCR, normalized (see Methods), and represented on the y-axis as log10 values. Data represent the mean of results from qRT-PCR experiments using three independent RNA isolations; error bars represent one standard deviation. Boxes labeled with different letters indicate transcript levels that differed significantly (p < 0.05), while boxes labeled with identical letters indicate transcript levels that did not differ significantly (as determined by Tukey's multiple comparison procedure).
σB and PrfA-dependent transcription of internalin-like genes in L. monocytogenes
As previous reports have suggested that σB and PrfA may interact to control expression of some virulence-related genes (Milohanic et al., 2003; Kazmierczak et al., 2006), microarray hybridizations were performed to compare transcript levels for internalin-like genes between the isogenic parent strain and a ΔsigBΔprfA strain. Six internalin-like genes (inlA, inlB, inlC2, inlD, lmo0331, and lmo0610), as well as plcA and opuCA had higher transcript levels in the 10403S parent strain than in the ΔsigBΔprfA strain (Table 1); all of these genes had been identified previously as differentially regulated in either the ΔsigB or the ΔprfA strain (as compared to the prfA* strain). inlA and inlB transcript levels were 110- and 100-fold higher, respectively, in 10403S as compared to the double mutant, substantially higher than the expression differential between the wildtype and ΔsigB strain (40- and 30-fold, respectively) or the prfA*and ΔprfA strain (2.3- and 2.6-fold, respectively). The differences in inlC2, inlD, lmo0331, and lmo0610 transcript levels between the parent strain and the ΔsigBΔprfA strain were similar to the differences observed between the parent and ΔsigB strains (Table 2), further supporting that transcription of these internalin-like genes is σB-dependent and PrfA-independent. inlC and lmo2445 transcript levels did not differ significantly between the parent and the ΔsigBΔprfA strain, consistent with the microarray-based comparisons of inlC and lmo2445 transcript levels between the parent and ΔprfA strain cultured in BHI with charcoal (Table 1).
qRT-PCR confirmed that lmo0331 and lmo0610 transcript levels were higher in the parent strain as compared to the ΔsigBΔprfA strain, while lmo1290 and lmo2445 transcript levels were similar for both strains, consistent with the microarray data (Fig. 6). Quantitative RT-PCR-based characterization of inlA, inlB, inlC, inlC2, inlD, opuCA, plcA, and opuCA transcript levels in the parent and ΔsigBΔprfA strain have been reported elsewhere (McGann et al., 2007b) and are also consistent with the microarray expression profiles presented here.
FIG. 6.
Transcript levels determined by quantitative reverse-transcriptase polymerase chain reaction (qRT-PCR) for selected genes identified as differentially expressed between 10403S and the isogenic ΔsigBΔprfA strain (based on one or both probes in the microarray; Table 1).lmo1290 and lmo2445 were included as negative controls; the microarray did not reveal any differences in transcript levels between 10403S and the ΔsigBΔprfA strain for these genes. Transcript levels were quantified by qRT-PCR and normalized (see Methods), and represented on the y-axis as log10 values. Dark and light bars represent 10403S and the ΔsigBΔprfA strain, respectively. Data represent the mean of results from qRT-PCR experiments using three independent RNA isolations; error bars represent one standard deviation. An asterisk indicates that transcript levels for a given gene are significantly different between 10403S and the ΔsigBΔprfA strain.
Discussion
Microarrays using two 70-mer probes per gene instead of one provide for improved transcriptional profiling accuracy
Microarray technology is a valuable tool for investigating gene expression in both prokaryotic and eukaryotic organisms, however, considerable concern exists about reliability and reproducibility of the data generated (Draghici et al., 2006). For example, cross-hybridization of probes, particularly among probes targeting related genes and gene families, can be of concern, as illustrated by recent studies that showed that a large proportion of microarray probes can produce significant cross-hybridization signals (Wu et al., 2005; Zhang et al., 2005). For example, Hughes et al. (2001) showed that nontarget sequences with >70% similarity to a 60-mer oligonucleotide probe can cross-hybridize. Various studies have also shown that different oligonucleotide probes for the same gene can yield different signal intensities if they bind to different regions of the gene (Lockhart et al., 1996; Selinger et al., 2000; Hughes et al., 2001). Our data show that the inclusion of two 70-mer probes per gene in a microarray improved the correlation between microarray and qRT-PCR data, with a reduced false discovery rate, as compared to use of a single probe. Use of multiple probes is likely to be particularly critical for transcriptional profiling of gene families that contain genes with highly conserved sequence features, such as the L. monocytogenes internalin gene family (Marino et al., 2000), and should provide more accurate and dependable microarray data, as also supported by others (Lockhart et al., 1996; Selinger et al., 2000; Hughes et al., 2001; Relogio et al., 2002). Although validation of microarray expression profiles by other methods such as qRT-PCR has become standard practice (Tan et al., 2003), our findings are consistent with a previous study, which showed that microarray expression profiles may be used without additional experimental verification if multiple gene-specific probes per gene are incorporated, particularly if probes are shorter than 150 nt (Chou et al., 2004).
A prfA* L. monocytogenes strain cultured in a standard bacterial medium (i.e., BHI) shows prfA transcript levels and at least some PrfA biological activity similar to that in intracellular bacteria
To study PrfA-dependent gene expression in L. monocytogenes, previous studies have used either L. monocytogenes grown in the presence of charcoal (Ripio et al., 1996; Ermolaeva et al., 1999; Milohanic et al., 2003) or L. monocytogenes strains with single amino acid substitutions in PrfA that generate constitutively active PrfA proteins. For example, the G155S prfA* allele encodes a PrfA* protein that appears to be locked in a constitutively active state (Shetron-Rama et al., 2003); consequently a strain with this prfA* allele exhibits constant, high-level expression of PrfA-dependent genes that are normally induced within the cytosol of infected host cells (e.g., actA and hly) (Mueller and Freitag, 2005). In this study, we showed that the L. monocytogenes prfA* (G155S) strain exhibits prfA, plcA, and opuCA transcript levels similar to those observed in intracellular L. monocytogenes isolated from the vacuole and cytosol of infected Caco-2 cells (Kazmierczak et al., 2006), with prfA and plcA transcript levels that were significantly higher than those observed in a wildtype prfA strain cultured with activated charcoal. Thus, use of the L. monocytogenes prfA* strain appears to represent an appropriate model to study PrfA-dependent gene expression typical for intracellular L. monocytogenes.
Our initial microarray experiments showed about 12-fold higher transcript levels for the PrfA-dependent gene plcA in the L. monocytogenes parent strain as compared to the ΔprfA strain when cells were cultured in the presence of activated charcoal for 2 hours. This is consistent with previous reports that showed that L. monocytogenes cultured in the presence of activated charcoal display increased expression of key virulence genes, including prfA, plcA, hly, mpl, actA, and plcB (Ripio et al., 1996; Milohanic et al., 2003; Ermolaeva et al., 2004). However, no significant difference in inlA, inlB, and inlC transcript levels were found between L. monocytogenes 10403S and the isogenic ΔprfA strain when cultured in the presence of activated charcoal for 2 hours in our microarray experiments reported here, even though Milohanic et al. (2003) reported significantly higher inlA, inlB, and inlC transcript levels, using a macroarray in an L. monocytogenes EGD-e wildtype strain as compared to an EGD-e ΔprfA strain (when cultured overnight in the presence of activated charcoal). Using qRT-PCR, our group also did not find significant differences in inlA, inlB, and inlC transcript levels between a L. monocytogenes 10403S parent strain and an isogenic ΔprfA mutant cultured in BHI with 0.2% charcoal for 2 hours (McGann et al., 2007b). These data may reflect the fact that some PrfA-dependent genes (e.g., plcA, hly) are preceded by a perfect palindromic PrfA binding site, which allows for rapid, high transcriptional activation of these genes (Camilli et al., 1993; Freitag and Portnoy, 1994; Sheehan et al., 1995), while other virulence genes (e.g., prfA, mpl, actA, inlA) are preceded by a weaker PrfA binding site (i.e., an imperfect palindrome with one or more mismatches), which leads to slower and weaker PrfA-dependent transcriptional activation (Sheehan et al., 1995). The presence of PrfA binding sites with different strengths appears to be important for ensuring a hierarchy of virulence gene expression that allows for rapid activation of genes required in the early stages of intracellular infection (e.g., hly, plcA), followed by slower, subsequent activation of genes needed later in the intracellular life cycle, e.g., actA, mpl (Sheehan et al., 1995). Our results are consistent with this model, as we found differential plcA transcription (between the 10403S parent strain and the ΔprfA strain) in bacterial cells that were exposed to activated charcoal for 2 hours, while differential expression of PrfA-dependent internalin genes (i.e., inlAB, inlC, lmo2445), which are preceded by imperfect palindromes, was only detectable in the prfA*–ΔprfA comparison. Specifically, these genes have palindromic PrfA binding sites that differ from the perfect palindromic PrfA binding sites upstream of hly and plcA by one (inlC and lmo2445 [Glaser et al., 2001]) or two (inlAB [Sheehan et al., 1995; Glaser et al., 2001]) mismatches. These observations suggest that PrfA-dependent transcription of these internalin genes may occur relatively late in the infection cycle (i.e., during intracellular or systemic infection), suggesting the possibility that these gene products contribute to later stages of infection, such as cell-to-cell spread. This hypothesis appears to be consistent with the observation that inlA may be important for L. monocytogenes crossing of the human maternofetal barrier (Lecuit et al., 2004). Dual regulation of inlA by σB and PrfA may be required for dual function of this internalin in invasion of intestinal epithelial cells (with activation of transcription during the gastrointestinal stage by σB) and crossing of the trophoblastic barrier (with activation of inlA transcription during this stage by PrfA). The role of InlA in crossing of the trophoblastic barrier remains unclear, however, as InlA does not appear to contribute to this stage of infection in the guinea pig (Bakardjiev et al., 2004, 2005, 2006).
Internalin genes can be classified based on regulation by σB, PrfA, both regulators, or neither
Overall, our data reported here and previously (McGann et al., 2007b) show that σB and PrfA contribute to the transcriptional regulation of different internalins such that (i) both σB and PrfA contribute to transcription of inlA and inlB; (ii) only σB contributes to transcription of inlC2, inlD, lmo0331, and lmo0610; and (iii) only PrfA contributes to transcription of inlC and lmo2445. These findings indicate that L. monocytogenes internalin genes are expressed under different environmental conditions, suggesting that differential expression may also occur in different compartments of infected hosts. In particular, coregulation of inlAB by σB and PrfA may allow appropriate, sensitive control of gene transcription during both gastrointestinal and systemic stages of infection.
All four internalins determined to be σB-dependent, but PrfA-independent, (inlC2, inlD, lmo0331, and lmo0610) are predicted to be covalently attached to the L. monocytogenes cell surface through a LPXTG sequence motif (Navarre and Schneewind, 1999). Lmo0610 and Lmo0331 contain 8 and 11 leucine-rich repeat units, respectively, while both lmo0331 and lmo0610 encode PKD repeats, which have been proposed to serve as ligand-binding sites in cell-surface proteins (Cabanes et al., 2002). σB-dependent regulation of inlC2, inlD, lmo0331, and lmo0610 suggests that these genes are up-regulated by environmental stress conditions, possibly those encountered during passage through the gastrointestinal tract. Strains carrying deletions in inlC2 and inlD were found to be unaffected in their ability to invade a number of nonphagocytic cells (Dramsi et al., 1995), hence, the specific functions of these proteins have not yet been defined. Characterization of lmo0331 and lmo0610 null mutants has not yet been reported. Considering that a number of σB-dependent genes are important in virulence, particularly during gastrointestinal stages of infection (e.g., opuCA, bsh, inlA) (Kazmierczak et al., 2003; Sue et al., 2003, 2004; Begley et al., 2005), characterization of null mutations in inlC2, inlD, lmo0331, and lmo0610 in oral or intragastric infection models may provide a promising approach for identifying the specific functions of these proteins. As species-specificity has been demonstrated for some internalins, e.g., InlA and InlB (Lecuit et al., 1999; Khelef et al., 2006), and as L. monocytogenes shows a broad natural host range, characterization in multiple animal species of L. monocytogenes strains bearing null mutations in targeted internalin genes may be needed before the specific functions of these internalins can be defined.
lmo2445 represents a newly identified PrfA-dependent internalin gene. Both PrfA-regulated internalins (lmo2445 and inlC [Engelbrecht et al., 1996]) are predicted to encode small secreted internalins lacking surface-anchoring domains (Hamon et al., 2006). Both of these internalin genes are preceded by apparently weak PrfA-binding sites, consistent with a previous report that inlC is primarily expressed when PrfA activity is highest, such as when L. monocytogenes is inside a host cell (Engelbrecht et al., 1996). It is thus tempting to speculate that both of these secreted internalins may play a role in the later stages of cellular or systemic infection. This hypothesis is consistent with phenotypic characterization, which showed reduced virulence of a ΔinlC strain after intravenous infection of mice (Engelbrecht et al., 1996), even though the ΔinlC strain showed neither attenuated intracellular replication in J774 or Caco-2 cells (Bergmann et al., 2002) nor attenuated invasion in Caco-2 cells (Engelbrecht et al., 1996). As both of these genes are clearly PrfA-dependent, further characterization of null mutations in both inlC and lmo2445 in different animal and cell culture models appears to be warranted and should allow for further insight into the roles of different internalins in L. monocytogenes infection and virulence. Using a number of strains bearing double mutations, Bergmann et al. (2002) showed that InlC may have a supportive role in InlA-mediated invasion, suggesting that characterization of dual mutations among internalin genes in a single strain may be needed to further define the function of these internalins.
Sixteen internalin genes, including inlE, inlF, inlG, inlI, and inlJ, showed no evidence of differential expression by PrfA or σB under the conditions used. Consistent with the conclusion that this group of internalins is not regulated by PrfA, Joseph et al. (2006) found no evidence of increased expression of alternative internalins in the L. monocytogenes intracellular environment. The fact that InlJ has an apparent role in virulence (Sabet et al., 2005) suggests, however, that at least some internalins that do not appear to be regulated by σB or PrfA contribute to L. monocytogenes virulence.
Conclusions
Listeria monocytogenes is a ubiquitous organism capable of both surviving under diverse environmental conditions and of infecting a wide range of host species and host cell types (e.g., intestinal epithelial cells, endothelial cells [Hamon et al., 2006]). The presence of a large number of L. monocytogenes genes encoding cell surface–associated molecules (4.7% of all predicted L. monocytogenes genes [Cabanes et al., 2002]) and, in particular, the internalin family, suggests roles for these proteins in interacting with different host and cell types. Internalins represent a diverse family of surface proteins, not only with regard to their structures and function, but also with regard to their transcriptional regulation, as illustrated by the fact that 8 of 24 internalin-like genes in L. monocytogenes are regulated by σB and/or PrfA, while transcription of the other internalins appears to be regulated by other mechanisms. A comprehensive approach including characterization of null mutant strains (Gaillard et al., 1991; Dramsi et al., 1995, 1997; Bergmann et al., 2002; Sabet et al., 2005), structure determination (Marino et al., 1999; Schubert et al., 2002; Ooi et al., 2006), and transcriptional profiling will be needed to unravel the functions of this group of proteins to ultimately allow a better understanding of their contributions to L. monocytogenes survival and transmission in different hosts and environments.
Supplementary Material
Acknowledgment
This work was supported in part by the National Institutes of Health Award No. RO1-AI052151-01A1 (to K.J.B.).
References
- Anonymous. Listeria monocytogenes Sequencing Project. Broad Institute of Harvard and Massachusetts Institute of Technology 2006. 2007. http://www.broad.mit.edu/annotation/genome/listeria_group/MultiHome.html. [Jul 4;2008 ]. http://www.broad.mit.edu/annotation/genome/listeria_group/MultiHome.html
- Bakardjiev AI. Stacy BA. Fisher SJ. Portnoy DA. Listeriosis in the pregnant guinea pig: a model of vertical transmission. Infect. Immun. 2004;72:489–497. doi: 10.1128/IAI.72.1.489-497.2004. [DOI] [PMC free article] [PubMed] [Google Scholar]
- Bakardjiev AI. Stacy BA. Portnoy DA. Growth of Listeria monocytogenes in the guinea pig placenta and role of cell-to-cell spread in fetal infection. J. Infect. Dis. 2005;191:1889–1897. doi: 10.1086/430090. [DOI] [PubMed] [Google Scholar]
- Bakardjiev AI. Theriot JA. Portnoy DA. Listeria monocytogenes traffics from maternal organs to the placenta and back. Available at http://www.plospathogens.org/ PLoS Pathog. 2006;2:e66. doi: 10.1371/journal.ppat.0020066. [DOI] [PMC free article] [PubMed] [Google Scholar]
- Barrett T. Suzek TO. Troup DB. Wilhite SE. Ngau WC. Ledoux P. Rudnev D. Lash AE. Fujibuchi W. Edgar R. NCBI GEO: mining millions of expression profiles—database and tools. Nucleic Acids Res. 2005;33:D562–566. doi: 10.1093/nar/gki022. [DOI] [PMC free article] [PubMed] [Google Scholar]
- Becker LA. Cetin MS. Hutkins RW. Benson AK. Identification of the gene encoding the alternative sigma factor σB from Listeria monocytogenes and its role in osmo-tolerance. J. Bacteriol. 1998;180:4547–4554. doi: 10.1128/jb.180.17.4547-4554.1998. [DOI] [PMC free article] [PubMed] [Google Scholar]
- Begley M. Sleator RD. Gahan CG. Hill C. Contribution of three bile-associated loci, bsh, pva, and btlB, to gastrointestinal persistence and bile tolerance of Listeria monocytogenes. Infect. Immun. 2005;73:894–904. doi: 10.1128/IAI.73.2.894-904.2005. [DOI] [PMC free article] [PubMed] [Google Scholar]
- Bergmann B. Raffelsbauer D. Kuhn M. Goetz M. Hom S. Goebel W. InlA- but not InlB-mediated internalization of Listeria monocytogenes by non-phagocytic mammalian cells needs the support of other internalins. Mol. Microbiol. 2002;43:557–570. doi: 10.1046/j.1365-2958.2002.02767.x. [DOI] [PubMed] [Google Scholar]
- Bishop DK. Hinrichs DJ. Adoptive transfer of immunity to Listeria monocytogenes. The influence of in vitro stimulation on lymphocyte subset requirements. J. Immunol. 1987;139:2005–2009. [PubMed] [Google Scholar]
- Bohne J. Kestler H. Uebele C. Sokolovic Z. Goebel W. Differential regulation of the virulence genes of Listeria monocytogenes by the transcriptional activator PrfA. Mol. Microbiol. 1996;20:1189–1198. doi: 10.1111/j.1365-2958.1996.tb02639.x. [DOI] [PubMed] [Google Scholar]
- Bonazzi M. Cossart P. Bacterial entry into cells: a role for the endocytic machinery. FEBS Lett. 2006;580:2962–2967. doi: 10.1016/j.febslet.2006.04.010. [DOI] [PubMed] [Google Scholar]
- Cabanes D. Dehoux P. Dussurget O. Frangeul L. Cossart P. Surface proteins and the pathogenic potential of Listeria monocytogenes. Trends Microbiol. 2002;10:238–245. doi: 10.1016/s0966-842x(02)02342-9. [DOI] [PubMed] [Google Scholar]
- Camilli A. Tilney LG. Portnoy DA. Dual roles of plcA in Listeria monocytogenes pathogenesis. Mol. Microbiol. 1993;8:143–157. doi: 10.1111/j.1365-2958.1993.tb01211.x. [DOI] [PMC free article] [PubMed] [Google Scholar]
- Chakraborty T. Leimeister-Wachter M. Domann E. Hartl M. Goebel W. Nichterlein T. Notermans S. Coordinate regulation of virulence genes in Listeria monocytogenes requires the product of the prfA gene. J. Bacteriol. 1992;174:568–574. doi: 10.1128/jb.174.2.568-574.1992. [DOI] [PMC free article] [PubMed] [Google Scholar]
- Chatterjee SS. Hossain H. Otten S. Kuenne C. Kuchmina K. Machata S. Domann E. Chakraborty T. Hain T. Intracellular gene expression profile of Listeria monocytogenes. Infect. Immun. 2006;74:1323–1338. doi: 10.1128/IAI.74.2.1323-1338.2006. [DOI] [PMC free article] [PubMed] [Google Scholar]
- Chaturongakul S. Boor KJ. σB activation under environmental and energy stress conditions in Listeria monocytogenes. Appl. Environ. Microbiol. 2006;72:5197–5203. doi: 10.1128/AEM.03058-05. [DOI] [PMC free article] [PubMed] [Google Scholar]
- Chou CC. Chen CH. Lee TT. Peck K. Optimization of probe length and the number of probes per gene for optimal microarray analysis of gene expression. Nucleic Acids Res. 2004;32:e99. doi: 10.1093/nar/gnh099. [DOI] [PMC free article] [PubMed] [Google Scholar]
- Dickneite C. Bockmann R. Spory A. Goebel W. Sokolovic Z. Differential interaction of the transcription factor PrfA and the PrfA-activating factor (Paf) of Listeria monocytogenes with target sequences. Mol. Microbiol. 1998;27:915–928. doi: 10.1046/j.1365-2958.1998.00736.x. [DOI] [PubMed] [Google Scholar]
- Draghici S. Khatri P. Eklund AC. Szallasi Z. Reliability and reproducibility issues in DNA microarray measurements. Trends Genet. 2006;22:101–109. doi: 10.1016/j.tig.2005.12.005. [DOI] [PMC free article] [PubMed] [Google Scholar]
- Dramsi S. Biswas I. Maguin E. Braun L. Mastroeni P. Cossart P. Entry of Listeria monocytogenes into hepatocytes requires expression of InIB, a surface protein of the internalin multigene family. Mol. Microbiol. 1995;16:251–261. doi: 10.1111/j.1365-2958.1995.tb02297.x. [DOI] [PubMed] [Google Scholar]
- Dramsi S. Dehoux P. Lebrun M. Goossens PL. Cossart P. Identification of four new members of the internalin multigene family of Listeria monocytogenes EGD. Infect. Immun. 1997;65:1615–1625. doi: 10.1128/iai.65.5.1615-1625.1997. [DOI] [PMC free article] [PubMed] [Google Scholar]
- Dramsi S. Kocks C. Forestier C. Cossart P. Internalin-mediated invasion of epithelial cells by Listeria monocytogenes is regulated by the bacterial growth state, temperature and the pleiotropic activator PrfA. Mol. Microbiol. 1993;9:931–941. doi: 10.1111/j.1365-2958.1993.tb01223.x. [DOI] [PubMed] [Google Scholar]
- Edgar R. Domrachev M. Lash AE. Gene Expression Omnibus: NCBI gene expression and hybridization array data repository. Nucleic Acids Res. 2002;30:207–210. doi: 10.1093/nar/30.1.207. [DOI] [PMC free article] [PubMed] [Google Scholar]
- Engelbrecht F. Chun SK. Ochs C. Hess J. Lottspeich F. Goebel W. Sokolovic Z. A new PrfA-regulated gene of Listeria monocytogenes encoding a small, secreted protein which belongs to the family of internalins. Mol. Microbiol. 1996;21:823–837. doi: 10.1046/j.1365-2958.1996.541414.x. [DOI] [PubMed] [Google Scholar]
- Ermolaeva S. Belyi Y. Tartakovskii I. Characteristics of induction of virulence factor expression by activated charcoal in Listeria monocytogenes. FEMS Microbiol. Lett. 1999;174:137–141. doi: 10.1111/j.1574-6968.1999.tb13560.x. [DOI] [PubMed] [Google Scholar]
- Ermolaeva S. Novella S. Vega Y. Ripio MT. Scortti M. Vazquez-Boland JA. Negative control of Listeria monocytogenes virulence genes by a diffusible autorepressor. Mol. Microbiol. 2004;52:601–611. doi: 10.1111/j.1365-2958.2004.04003.x. [DOI] [PubMed] [Google Scholar]
- Freitag NE. Portnoy DA. Dual promoters of the Listeria monocytogenes prfA transcriptional activator appear essential in vitro but are redundant in vivo. Mol. Microbiol. 1994;12:845–853. doi: 10.1111/j.1365-2958.1994.tb01070.x. [DOI] [PubMed] [Google Scholar]
- Freitag NE. Rong L. Portnoy DA. Regulation of the PrfA transcriptional activator of Listeria monocytogenes: multiple promoter elements contribute to intracellular growth and cell-to-cell spread. Infect. Immun. 1993;61:2537–2544. doi: 10.1128/iai.61.6.2537-2544.1993. [DOI] [PMC free article] [PubMed] [Google Scholar]
- Gaillard JL. Berche P. Frehel C. Gouin E. Cossart P. Entry of L. monocytogenes into cells is mediated by internalin, a repeat protein reminiscent of surface antigens from gram-positive cocci. Cell. 1991;65:1127–1141. doi: 10.1016/0092-8674(91)90009-n. [DOI] [PubMed] [Google Scholar]
- Garner MR. James KE. Callahan MC. Wiedmann M. Boor KJ. Exposure to salt and organic acids increases the ability of Listeria monocytogenes to invade Caco-2 cells but decreases its ability to survive gastric stress. Appl. Environ. Microbiol. 2006;72:5384–5395. doi: 10.1128/AEM.00764-06. [DOI] [PMC free article] [PubMed] [Google Scholar]
- Gentleman RC. Carey VJ. Bates DM. Bolstad B. Dettling M. Dudoit S. Ellis B. Gautier L. Ge Y. Gentry J. Hornik K. Hothorn T. Huber W. Iacus S. Irizarry R. Leisch F. Li C. Maechler M. Rossini AJ. Sawitzki G. Smith C. Smyth G. Tierney L. Yang JY. Zhang J. Bioconductor: open software development for computational biology and bioinformatics. Genome Biol. 2004;5:R80. doi: 10.1186/gb-2004-5-10-r80. [DOI] [PMC free article] [PubMed] [Google Scholar]
- Glaser P. Frangeul L. Buchrieser C. Rusniok C. Amend A. Baquero F. Berche P. Bloecker H. Brandt P. Chakraborty T. Charbit A. Chetouani F. Couve E. de Daruvar A. Dehoux P. Domann E. Dominguez-Bernal G. Duchaud E. Durant L. Dussurget O. Entian K-D. Fsihi H. Portillo FG-D. Garrido P. Gautier L. Goebel W. Gomez-Lopez N. Hain T. Hauf J. Jackson D. Jones L-M. Kaerst U. Kreft J. Kuhn M. Kunst F. Kurapkat G. Madueno E. Maitournam A. Vicente JM. Ng E. Nedjari H. Nordsiek G. Novella S. de Pablos B. Perez-Diaz J-C. Purcell R. Remmel B. Rose M. Schlueter T. Simoes N. Tierrez A. Vazquez-Boland J-A. Voss H. Wehland J. Cossart P. Comparative genomics of Listeria species. Science. 2001;294:849–852. doi: 10.1126/science.1063447. [DOI] [PubMed] [Google Scholar]
- Gray MJ. Freitag NE. Boor KJ. How the bacterial pathogen Listeria monocytogenes mediates the switch from environmental Dr. Jekyll to pathogenic Mr. Hyde. Infect. Immun. 2006;74:2505–2512. doi: 10.1128/IAI.74.5.2505-2512.2006. [DOI] [PMC free article] [PubMed] [Google Scholar]
- Hamon M. Bierne H. Cossart P. Listeria monocytogenes: a multifaceted model. Nat. Rev. Microbiol. 2006;4:423–434. doi: 10.1038/nrmicro1413. [DOI] [PubMed] [Google Scholar]
- Hughes TR. Mao M. Jones AR. Burchard J. Marton MJ. Shannon KW. Lefkowitz SM. Ziman M. Schelter JM. Meyer MR. Kobayashi S. Davis C. Dai H. He YD. Stephaniants SB. Cavet G. Walker WL. West A. Coffey E. Shoemaker DD. Stoughton R. Blanchard AP. Friend SH. Linsley PS. Expression profiling using microarrays fabricated by an ink-jet oligonucleotide synthesizer. Nat. Biotechnol. 2001;19:342–347. doi: 10.1038/86730. [DOI] [PubMed] [Google Scholar]
- Joseph B. Przybilla K. Stühler C. Schauer K. Slaghuis J. Fuchs TM. Goebel W. Identification of Listeria monocytogenes genes contributing to intracellular replication by expression profiling and mutant screening. J. Bacteriol. 2006;188:556–568. doi: 10.1128/JB.188.2.556-568.2006. [DOI] [PMC free article] [PubMed] [Google Scholar]
- Kazmierczak MJ. Mithoe SC. Boor KJ. Wiedmann M. Listeria monocytogenes σB regulates stress response and virulence functions. J. Bacteriol. 2003;185:5722–5734. doi: 10.1128/JB.185.19.5722-5734.2003. [DOI] [PMC free article] [PubMed] [Google Scholar]
- Kazmierczak MJ. Wiedmann M. Boor KJ. Contributions of Listeria monocytogenes σB and PrfA to expression of virulence and stress response genes during extra- and intracellular growth. Microbiology. 2006;152:1827–1838. doi: 10.1099/mic.0.28758-0. [DOI] [PubMed] [Google Scholar]
- Khelef N. Lecuit M. Bierne H. Cossart P. Species specificity of the Listeria monocytogenes InlB protein. Cell Microbiol. 2006;8:457–470. doi: 10.1111/j.1462-5822.2005.00634.x. [DOI] [PubMed] [Google Scholar]
- Kim H. Boor KJ. Marquis H. Listeria monocytogenes σB contributes to invasion of human intestinal epithelial cells. Infect. Immun. 2004;72:7374–7378. doi: 10.1128/IAI.72.12.7374-7378.2004. [DOI] [PMC free article] [PubMed] [Google Scholar]
- Kim H. Marquis H. Boor KJ. σB contributes to Listeria monocytogenes invasion by controlling expression of inlA and inlB. Microbiology. 2005;151:3215–3222. doi: 10.1099/mic.0.28070-0. [DOI] [PMC free article] [PubMed] [Google Scholar]
- Kobe B. Deisenhofer J. A structural basis of the interactions between leucine-rich repeats and protein ligands. Nature. 1995;374:183–186. doi: 10.1038/374183a0. [DOI] [PubMed] [Google Scholar]
- Lecuit M. Dramsi S. Gottardi C. Fedor-Chaiken M. Gumbiner B. Cossart P. A single amino acid in E-cadherin responsible for host specificity towards the human pathogen Listeria monocytogenes. EMBO J. 1999;18:3956–3963. doi: 10.1093/emboj/18.14.3956. [DOI] [PMC free article] [PubMed] [Google Scholar]
- Lecuit M. Nelson DM. Smith SD. Khun H. Huerre M. Vacher-Lavenu MC. Gordon JI. Cossart P. Targeting and crossing of the human maternofetal barrier by Listeria monocytogenes: role of internalin interaction with trophoblast E-cadherin. Proc. Natl. Acad. Sci. U S A. 2004;101:6152–6157. doi: 10.1073/pnas.0401434101. [DOI] [PMC free article] [PubMed] [Google Scholar]
- Lingnau A. Domann E. Hudel M. Bock M. Nichterlein T. Wehland J. Chakraborty T. Expression of the Listeria monocytogenes EGD inlA and inlB genes, whose products mediate bacterial entry into tissue culture cell lines, by PrfA-dependent and -independent mechanisms. Infect. Immun. 1995;63:3896–3903. doi: 10.1128/iai.63.10.3896-3903.1995. [DOI] [PMC free article] [PubMed] [Google Scholar]
- Lockhart DJ. Dong H. Byrne MC. Follettie MT. Gallo MV. Chee MS. Mittmann M. Wang C. Kobayashi M. Horton H. Brown EL. Expression monitoring by hybridization to high-density oligonucleotide arrays. Nat. Biotechnol. 1996;14:1675–1680. doi: 10.1038/nbt1296-1675. [DOI] [PubMed] [Google Scholar]
- Low JC. Donachie W. A review of Listeria monocytogenes and listeriosis. Vet. J. 1997;153:9–29. doi: 10.1016/s1090-0233(97)80005-6. [DOI] [PubMed] [Google Scholar]
- Luo Q. Rauch M. Marr AK. Muller-Altrock S. Goebel W. In vitro transcription of the Listeria monocytogenes virulence genes inlC and mpl reveals overlapping PrfA-dependent and -independent promoters that are differentially activated by GTP. Mol. Microbiol. 2004;52:39–52. doi: 10.1111/j.1365-2958.2003.03960.x. [DOI] [PubMed] [Google Scholar]
- Marino M. Braun L. Cossart P. Ghosh P. Structure of the InlB leucine-rich repeats, a domain that triggers host cell invasion by the bacterial pathogen L. monocytogenes. Mol. Cell. 1999;4:1063–1072. doi: 10.1016/s1097-2765(00)80234-8. [DOI] [PubMed] [Google Scholar]
- Marino M. Braun L. Cossart P. Ghosh P. A framework for interpreting the leucine-rich repeats of the Listeria internalins. Proc. Natl. Acad. Sci. U S A. 2000;97:8784–8788. doi: 10.1073/pnas.97.16.8784. [DOI] [PMC free article] [PubMed] [Google Scholar]
- McGann P. Ivanek R. Wiedmann M. Boor KJ. Temperature-dependent expression of Listeria monocytogenes internalin and internalin-like genes suggests functional diversity of these proteins among the listeriae. Appl. Environ. Microbiol. 2007a;73:2806–2814. doi: 10.1128/AEM.02923-06. [DOI] [PMC free article] [PubMed] [Google Scholar]
- McGann P. Wiedmann M. Boor KJ. The alternative sigma factor σB and the virulence gene regulator PrfA both regulate transcription of Listeria monocytogenes internalins. Appl. Environ. Microbiol. 2007b;73:2919–2930. doi: 10.1128/AEM.02664-06. [DOI] [PMC free article] [PubMed] [Google Scholar]
- Mengaud J. Dramsi S. Gouin E. Vazquez-Boland JA. Milon G. Cossart P. Pleiotropic control of Listeria monocytogenes virulence factors by a gene that is auto-regulated. Mol. Microbiol. 1991;5:2273–2283. doi: 10.1111/j.1365-2958.1991.tb02158.x. [DOI] [PubMed] [Google Scholar]
- Mengaud J. Vicente MF. Cossart P. Transcriptional mapping and nucleotide sequence of the Listeria monocytogenes hlyA region reveal structural features that may be involved in regulation. Infect. Immun. 1989;57:3695–3701. doi: 10.1128/iai.57.12.3695-3701.1989. [DOI] [PMC free article] [PubMed] [Google Scholar]
- Milohanic E. Glaser P. Coppee JY. Frangeul L. Vega Y. Vazquez-Boland JA. Kunst F. Cossart P. Buchrieser C. Transcriptome analysis of Listeria monocytogenes identifies three groups of genes differently regulated by PrfA. Mol. Microbiol. 2003;47:1613–1625. doi: 10.1046/j.1365-2958.2003.03413.x. [DOI] [PubMed] [Google Scholar]
- Mueller KJ. Freitag NE. Pleiotropic enhancement of bacterial pathogenesis resulting from the constitutive activation of the Listeria monocytogenes regulatory factor PrfA. Infect. Immun. 2005;73:1917–1926. doi: 10.1128/IAI.73.4.1917-1926.2005. [DOI] [PMC free article] [PubMed] [Google Scholar]
- Nadon CA. Bowen BM. Wiedmann M. Boor KJ. Sigma B contributes to PrfA-mediated virulence in Listeria monocytogenes. Infect. Immun. 2002;70:3948–3952. doi: 10.1128/IAI.70.7.3948-3952.2002. [DOI] [PMC free article] [PubMed] [Google Scholar]
- Navarre WW. Schneewind O. Surface proteins of gram-positive bacteria and mechanisms of their targeting to the cell wall envelope. Microbiol. Mol. Biol. Rev. 1999;63:174–229. doi: 10.1128/mmbr.63.1.174-229.1999. [DOI] [PMC free article] [PubMed] [Google Scholar]
- Nelson KE. Fouts DE. Mongodin EF. Ravel J. DeBoy RT. Kolonay JF. Rasko DA. Angiuoli SV. Gill SR. Paulsen IT. Peterson J. White O. Nelson WC. Nierman W. Beanan MJ. Brinkac LM. Daugherty SC. Dodson RJ. Durkin AS. Madupu R. Haft DH. Selengut J. Van Aken S. Khouri H. Fedorova N. Forberger H. Tran B. Kathariou S. Wonderling LD. Uhlich GA. Bayles DO. Luchansky JB. Fraser CM. Whole genome comparisons of serotype 4b and 1/2a strains of the food-borne pathogen Listeria monocytogenes reveal new insights into the core genome components of this species. Nucleic Acids Res. 2004;32:2386–2395. doi: 10.1093/nar/gkh562. [DOI] [PMC free article] [PubMed] [Google Scholar]
- Ooi A. Hussain S. Seyedarabi A. Pickersgill RW. Structure of internalin C from Listeria monocytogenes. Acta Crystallogr. D Biol. Crystallogr. 2006;62:1287–1293. doi: 10.1107/S0907444906026746. [DOI] [PubMed] [Google Scholar]
- Piffaretti JC. Kressebuch H. Aeschbacher M. Bille J. Bannerman E. Musser JM. Selander RK. Rocourt J. Genetic characterization of clones of the bacterium Listeria monocytogenes causing epidemic disease. Proc. Natl. Acad. Sci. U S A. 1989;86:3818–3822. doi: 10.1073/pnas.86.10.3818. [DOI] [PMC free article] [PubMed] [Google Scholar]
- Popowska M. Markiewicz Z. Characterization of Listeria monocytogenes protein Lmo0327 with murein hydrolase activity. Arch. Microbiol. 2006;186:69–86. doi: 10.1007/s00203-006-0122-8. [DOI] [PubMed] [Google Scholar]
- Raengpradub S. Wiedmann M. Boor KJ. Comparative analysis of the σB-dependent stress responses in Listeria monocytogenes and Listeria innocua strains exposed to selected stress conditions. Appl. Environ. Microbiol. 2008;74:158–171. doi: 10.1128/AEM.00951-07. [DOI] [PMC free article] [PubMed] [Google Scholar]
- Raffelsbauer D. Bubert A. Engelbrecht F. Scheinpflug J. Simm A. Hess J. Kaufmann SH. Goebel W. The gene cluster inlC2DE of Listeria monocytogenes contains additional new internalin genes and is important for virulence in mice. Mol. Gen. Genet. 1998;260:144–158. doi: 10.1007/s004380050880. [DOI] [PubMed] [Google Scholar]
- Rauch M. Luo Q. Muller-Altrock S. Goebel W. σB-dependent in vitro transcription of prfA and some newly identified genes of Listeria monocytogenes whose expression is affected by PrfA in vivo. J. Bacteriol. 2005;187:800–804. doi: 10.1128/JB.187.2.800-804.2005. [DOI] [PMC free article] [PubMed] [Google Scholar]
- Relogio A. Schwager C. Richter A. Ansorge W. Valcarcel J. Optimization of oligonucleotide-based DNA microarrays. Nucleic Acids Res. 2002;30:e51. doi: 10.1093/nar/30.11.e51. [DOI] [PMC free article] [PubMed] [Google Scholar]
- Ripio MT. Dominguez-Bernal G. Suarez M. Brehm K. Berche P. Vazquez-Boland JA. Transcriptional activation of virulence genes in wild-type strains of Listeria monocytogenes in response to a change in the extracellular medium composition. Res. Microbiol. 1996;147:371–384. doi: 10.1016/0923-2508(96)84712-7. [DOI] [PubMed] [Google Scholar]
- Sabet C. Lecuit M. Cabanes D. Cossart P. Bierne H. LPXTG protein InlJ, a newly identified internalin involved in Listeria monocytogenes virulence. Infect. Immun. 2005;73:6912–6922. doi: 10.1128/IAI.73.10.6912-6922.2005. [DOI] [PMC free article] [PubMed] [Google Scholar]
- Schubert WD. Urbanke C. Ziehm T. Beier V. Machner MP. Domann E. Wehland J. Chakraborty T. Heinz DW. Structure of internalin, a major invasion protein of Listeria monocytogenes, in complex with its human receptor E-cadherin. Cell. 2002;111:825–836. doi: 10.1016/s0092-8674(02)01136-4. [DOI] [PubMed] [Google Scholar]
- Selinger DW. Cheung KJ. Mei R. Johansson EM. Richmond CS. Blattner FR. Lockhart DJ. Church GM. RNA expression analysis using a 30 base pair resolution Escherichia coli genome array. Nat. Biotechnol. 2000;18:1262–1268. doi: 10.1038/82367. [DOI] [PubMed] [Google Scholar]
- Sheehan B. Klarsfeld A. Msadek T. Cossart P. Differential activation of virulence gene expression by PrfA, the Listeria monocytogenes virulence regulator. J. Bacteriol. 1995;177:6469–6476. doi: 10.1128/jb.177.22.6469-6476.1995. [DOI] [PMC free article] [PubMed] [Google Scholar]
- Shetron-Rama LM. Mueller K. Bravo JM. Bouwer HG. Way SS. Freitag NE. Isolation of Listeria monocytogenes mutants with high-level in vitro expression of host cytosol-induced gene products. Mol. Microbiol. 2003;48:1537–1551. doi: 10.1046/j.1365-2958.2003.03534.x. [DOI] [PubMed] [Google Scholar]
- Smyth GK. Limma: linear models for microarray data. In: Gentleman R, editor; Carey V, editor; Dudoit S, editor; Irizarry R, editor; Huber W, editor. Bioinformatics and Computational Biology Solutions Using R and Bioconductor. New York: Springer; 2005. pp. 397–420. [Google Scholar]
- Smyth GK. Speed T. Normalization of cDNA microarray data. Methods. 2003;31:265–273. doi: 10.1016/s1046-2023(03)00155-5. [DOI] [PubMed] [Google Scholar]
- Sue D. Boor KJ. Wiedmann M. σB-dependent expression patterns of compatible solute transporter genes opuCA and lmo1421 and the conjugated bile salt hydrolase gene bsh in Listeria monocytogenes. Microbiology. 2003;149:3247–3256. doi: 10.1099/mic.0.26526-0. [DOI] [PubMed] [Google Scholar]
- Sue D. Fink D. Wiedmann M. Boor KJ. σB-dependent gene induction and expression in Listeria monocytogenes during osmotic and acid stress conditions simulating the intestinal environment. Microbiology. 2004;150:3843–3855. doi: 10.1099/mic.0.27257-0. [DOI] [PubMed] [Google Scholar]
- Tan PK. Downey TJ. Spitznagel EL., Jr Xu P. Fu D. Dimitrov DS. Lempicki RA. Raaka BM. Cam MC. Evaluation of gene expression measurements from commercial microarray platforms. Nucleic Acids Res. 2003;31:5676–5684. doi: 10.1093/nar/gkg763. [DOI] [PMC free article] [PubMed] [Google Scholar]
- Tsai YH. Orsi R. Nightingale KK. Wiedmann M. Listeria monocytogenes internalins are highly diverse and evolved by recombination and positive selection. Infect. Genet. Evol. 2006;6:378–389. doi: 10.1016/j.meegid.2006.01.004. [DOI] [PubMed] [Google Scholar]
- Vazquez-Boland JA. Kuhn M. Berche P. Chakraborty T. Dominguez-Bernal G. Goebel W. Gonzalez-Zorn B. Wehland J. Kreft J. Listeria pathogenesis and molecular virulence determinants. Clin. Microbiol. Rev. 2001;14:584–640. doi: 10.1128/CMR.14.3.584-640.2001. [DOI] [PMC free article] [PubMed] [Google Scholar]
- Wiedmann M. Arvik TJ. Hurley RJ. Boor KJ. General stress transcription factor σB and its role in acid tolerance and virulence of Listeria monocytogenes. J. Bacteriol. 1998;180:3650–3656. doi: 10.1128/jb.180.14.3650-3656.1998. [DOI] [PMC free article] [PubMed] [Google Scholar]
- Wong KK. Freitag NE. A novel mutation within the central Listeria monocytogenes regulator PrfA that results in constitutive expression of virulence gene products. J. Bacteriol. 2004;186:6265–6276. doi: 10.1128/JB.186.18.6265-6276.2004. [DOI] [PMC free article] [PubMed] [Google Scholar]
- Wu C. Carta R. Zhang L. Sequence dependence of cross-hybridization on short oligo microarrays. Nucleic Acids Res. 2005;33:e84. doi: 10.1093/nar/gni082. [DOI] [PMC free article] [PubMed] [Google Scholar]
- Wu L. Thompson DK. Li G. Hurt RA. Tiedje JM. Zhou J. Development and evaluation of functional gene arrays for detection of selected genes in the environment. Appl. Environ. Microbiol. 2001;67:5780–5790. doi: 10.1128/AEM.67.12.5780-5790.2001. [DOI] [PMC free article] [PubMed] [Google Scholar]
- Zhang C. Zhang M. Ju J. Nietfeldt J. Wise J. Terry PM. Olsen M. Kachman SD. Wiedmann M. Samadpour M. Benson AK. Genome diversification in phylogenetic lineages I and II of Listeria monocytogenes: identification of segments unique to lineage II populations. J. Bacteriol. 2003;185:5573–5584. doi: 10.1128/JB.185.18.5573-5584.2003. [DOI] [PMC free article] [PubMed] [Google Scholar]
- Zhang J. Finney RP. Clifford RJ. Derr LK. Buetow KH. Detecting false expression signals in high-density oligonucleotide arrays by an in silico approach. Genomics. 2005;85:297–308. doi: 10.1016/j.ygeno.2004.11.004. [DOI] [PubMed] [Google Scholar]
Associated Data
This section collects any data citations, data availability statements, or supplementary materials included in this article.