

Abstract
Targeted molecular therapies inhibit proliferation and survival of cancer cells but may also affect immune cells. We have evaluated the effects of Sirolimus and Sorafenib on proliferation and survival of lymphoid cell subsets. Both drugs were cytotoxic to CD4+CD25high T cells, and were growth inhibitory for CD4+ and CD8+ T cells. Cytotoxicity depended on CD3/CD28 stimulation and was detectable within 12 h, with 80–90% of CD4+CD25high cells killed by 72 h. Cell death was due to apoptosis, based on Annexin V and 7AAD staining. Addition of IL-2 prevented the apoptotic response to Sirolimus, potentially accounting for reports that Sirolimus can enhance proliferation of CD4+CD25high cells. These results predict that Sirolimus or Sorafenib would reduce CD4+CD25high cells if administered prior to antigenic stimulation in an immunotherapy protocol. However, administration of IL-2 protects CD4+CD25high T cells from cytotoxic effects of Sirolimus, a response that may be considered in design of therapeutic protocols.
Keywords: Sorafenib, Apoptosis, CD4+, CD8+, CD3/CD28, Annexin V, 7AAD
Introduction
Novel targeted therapies for cancer include immune therapy and small molecule targeted therapies. Immune therapy may include cancer vaccines or adoptive T cell therapy. Targeted therapies inhibit cell signaling pathways critical for cancer cell growth, division, and metastasis. There is rationale for considering combinations of these approaches. Inhibitors of cell signaling pathways for growth, proliferation, or survival might enhance immunotherapy by making tumors more susceptible to killing by cytotoxic CD8+ T cells. However, inhibitors of cell signaling might interfere with the immune response because many of the pathways critical for tumor cell growth and division are also critical to T-cell activation and expansion.
We performed studies to assess the effects on T-cell proliferation of Sirolimus and Sorafenib, two signal transduction inhibitors currently in clinical practice and development. Sirolimus (Rapamycin) is an FDA-approved agent, used since the late 1990s as immunosuppressive therapy to prevent rejection of transplanted organ allografts [4, 17]. Another inhibitor of mTOR signaling, temsirolimus (CCI-779, Wyeth Pharmaceuticals), is a derivative of Sirolimus and is being evaluated in clinical trials as a cancer therapeutic. Sirolimus binds to a cytoplasmic receptor, FKBP12, and the drug–protein complex inhibits the function of mTOR kinase, an important cellular regulator of translation and transcription [3]. Sorafenib (BAY43-9006) was approved by the FDA in December 2005 for treatment of renal cell cancer [7] and in November 2007 for unresectable hepatocellular carcinoma. It was developed as a B-Raf kinase inhibitor in part because B-Raf has been identified as mutated and over-expressed in multiple cancers, especially melanoma. Sorafenib also inhibits VEGF-R kinases (1/2/3) and other tyrosine kinases, all of which may contribute to its therapeutic actions [1, 27]. The effects of Sorafenib on lymphocyte subsets have not been explored. In prior work, we have found that nanomolar doses of Sirolimus and Sorafenib can inhibit human melanoma cell proliferation, and we have been interested in exploring the effects of these doses of those agents on human lymphocyte proliferation [14].
The T cell population of CD4+CD25high has attracted particular attention because of regulatory activity of tumor suppressor cells [8, 12]. One desirable scenario would be to inhibit this population of cells selectively, without eliminating the remaining CD4+ or CD8+ T cells to improve the efficacy of immunization therapy. One would expect that an mTOR inhibitor such as Sirolimus would suppress the proliferation of T cells, however, Sirolimus has been reported to expand the CD4+CD25high T cells selectively in culture [2, 23]. Here we examine the effects of Sirolimus and Sorafenib on the proliferation and survival of CD4+CD25high T cells compared to CD4+ and CD8+ T cells.
Materials and methods
Cell separation
Peripheral blood mononuclear cells (PBMC) were isolated from 20 healthy human volunteers, using the following sources: Ficoll gradient centrifugation of whole blood, anonymous donor buffy coats from Virginia Blood Services (Richmond, VA), or leukapheresis of volunteers, either locally or commercially from BRT Laboratories (Baltimore, MD). These were collected under IRB approved protocols (HIC 10598, 12382).
T-cell subsets were isolated from PBMC by the Miltenyi Biotech MACS system according to the manufacturer’s instructions (Auburn, CA, Catalog # 130-091-154 for CD8+ T cells; Catalog #130-091-155 and 130-090-445 for CD4+CD25− T cells, and Catalog #130-091-301 for CD4+CD25high T cells). The resulting T cell subpopulations were assessed for purity by flow cytometry and were only used if ≥90% pure. All of the cells were cultured in RPMI 1640 medium (Gibco, Grand Island, NY) supplemented with 10% fetal bovine serum (Gemini Bio-Products, Woodland, CA), 2 mM l-glutamine, penicillin (100 units/ml), and streptomycin (100 μg/ml) at 37°C in 5% CO2, unless otherwise indicated.
Flow cytometry
Cell surface staining was performed according to established protocols; 2 × 10⁵ cells per condition were incubated for 30 min at 4°C with different combinations of the following antibodies in the dark [CD3-APC (BD Biosciences #555342), CD4-PE-CY7 (Caltag #MHCD0412), CD4-FITC (BD Biosciences #555346), CD4-PE-CY5 (Beckman Coulter #IM2636), CD8-FITC (Beckman Coulter #TO20222), CD8-APC (BD Biosciences #555369), and CD25-PE (Miltenyi #120-001-311)]. Following two washings with PBS containing 0.1% BSA and 0.1% sodium azide (FACS Buffer) cells were resuspended in 2% paraformaldehyde/PBS (Sigma-Aldrich), and analyzed with the flow cytometry core facility FACS Calibur and FlowJo software. Intracellular human Foxp3 staining was performed: lymphocytes were stained for 30 min with CD25-PE (Miltenyi) and CD4-Fitc (BDPharmingen), and washed in FACS buffer (PBS+0.1% BSA +0.1% sodium azide). Surface-stained cells were fixed for 30 min using the FoxP3 fixation/permeabilization kit from eBioscience (Cat. #00-5521) according to their instructions. Fixative was removed by washing two times in permeabilization (Perm) buffer. Cells were incubated in Perm buffer containing 4% normal rat serum for 10 min at 4°C, followed by the addition of an equal volume of 1:5–1:10 dilution (in Perm buffer) of Foxp3-APC (eBioscience Catalog 88-8999-40; PCH101) antibody. After 30 min at 4°C, cells were washed twice in Perm buffer, then once in FACS buffer. Cells were acquired on a FACS Calibur flow cytometer and data processed by FloJo software.
Reagents and inhibitors
Sorafenib (BAY43-9006) was purchased from Calbiochem (Catalog #553011). Sirolimus (Rapamycin) was purchased from LC Laboratories (Woburn, MA; R-5000). Stock solutions were made of each agent in DMSO. For all assays, the negative control was a solution containing DMSO at the same concentration (“vehicle”). IL-2 was purchased from Chiron (Emeryville, CA; Proleukin) and used at 1,000 IU/ml.
Cell proliferation assays
For experiments to examine the effects of the signal transduction inhibitors on lymphocyte cell proliferation, lymphocytes were plated (30,000 cells per well) in triplicate in flat-bottom 96-well plates (Costar 3610); in RPMI1640 (Sigma), medium supplemented with 10% FBS, glutamine, and pen-strep; they were treated with inhibitor or vehicle at the indicated concentrations then, after an hour, were either stimulated or not with CD3/CD28 Dynabeads (Invitrogen Catalog #111-31D; 2.5 µl beads/106 T cells; 4 × 10⁷ beads/ml in PBS pH 7.4 with 0.1% human serum albumin). Exogenous cytokines were not used. Lymphocytes were cultured 72 h, and then cell numbers were assayed by measure of intracellular ATP using Cell Titer Glo (Promega Catalog#G7571; Madison, WI), according to manufacturer instructions. Mean values were calculated and plotted, with error bars representing the standard deviation of triplicate samples from at least three independent experiments. Triplicate values were all within 8.5%. For time-course studies, all lymphocytes were plated and treated at the same time, and plates were read by the luminometer at the time points indicated (6, 12, 24, 36, 48 h later, etc.). The time-course experiments were done twice, with triplicate wells for each time point, for each experiment.
Apoptosis assays
T cells were treated with vehicle, 10 nM Sirolimus or 10 nM Sorafenib and after an hour stimulated with CD3/CD28 beads and incubated for 12 or 24 h as indicated. Cells were then surface stained for CD4 (CD4-FITC), CD25 (CD25-PE), and CD8 (CD8-APC-Cy7) as described above. After surface staining cells, they were washed once in FACS buffer [0.1% BSA and 0.1% NaN3 (azide) in PBS], once in PBS, and then once more in freshly prepared binding buffer, (10× solution from BDbiosciences Catalog #51-66121E). Annexin V-APC (BDbiosciences Catalog #550474) was added at a final dilution of 1:10 or 1:20 from the original stock in 1× binding buffer containing 7AAD (1 µg/ml; CalBiochem Catalog #129935). The dilution of Annexin V-APC used was based on the number of cells. Cells were pelleted, the buffer was decanted, and cells were gently suspended in residual buffer to which was added 0.02 ml of Annexin V-APC and 7AAD. Appropriate compensation controls and FMOs were performed in conjunction.
Human subjects
All the research involving human subjects was approved by the University of Virginia’s IRB (Human Investigation Committee) in accordance with assurances filed with and approved by the Department of Health and Human Services.
Results
Effect of Sirolimus or Sorafenib on CD4+CD25high T cells
We separated peripheral blood mononuclear cells (PBMCs) from healthy donors and isolated CD4+CD25high T cells as described previously using the Miltenyi MACS system [5, 6, 8, 9, 11, 18–20, 28, 29]. Cells were analyzed by flow cytometry and found to be ≥90% CD4+CD25high (Fig. 1a). Purified CD4+CD25high T cells did not proliferate without stimulation, but when stimulated with CD3/CD28, the number of cells increased up to 3-fold after 72 h (responses were variable among different donors). Treatment with Sirolimus or Sorafenib for 1 h prior to stimulation by CD3/CD28 caused a dose-dependent reduction in the number of these T cells, where the effects were similar for the two agents (Fig. 1b). The dose–response curve revealed inhibition of proliferation below 3 nM Sirolimus or Sorafenib. At 3 nM, there was essentially no proliferation (Fig. 1b, dashed line) and at higher concentrations of 10 nM (Fig. 1b) and 100 nM (data not shown), there was a near complete net loss in the number of viable CD4+CD25high T cells. Thus, some doses of Sirolimus and Sorafenib below 10 nM were cytotoxic for CD3/CD28-stimulated CD4+CD25high T cells. The time dependence of the cytotoxic response was examined (Fig. 1c) and showed that there was no net loss of CD4+CD25high T cells prior to 12 h and a steep decline in the number of cells from 12 to 72 h, at which time only about 20% of the cells survived. The response was very similar for 10 nM Sirolimus and for 10 nM Sorafenib.
Fig. 1.
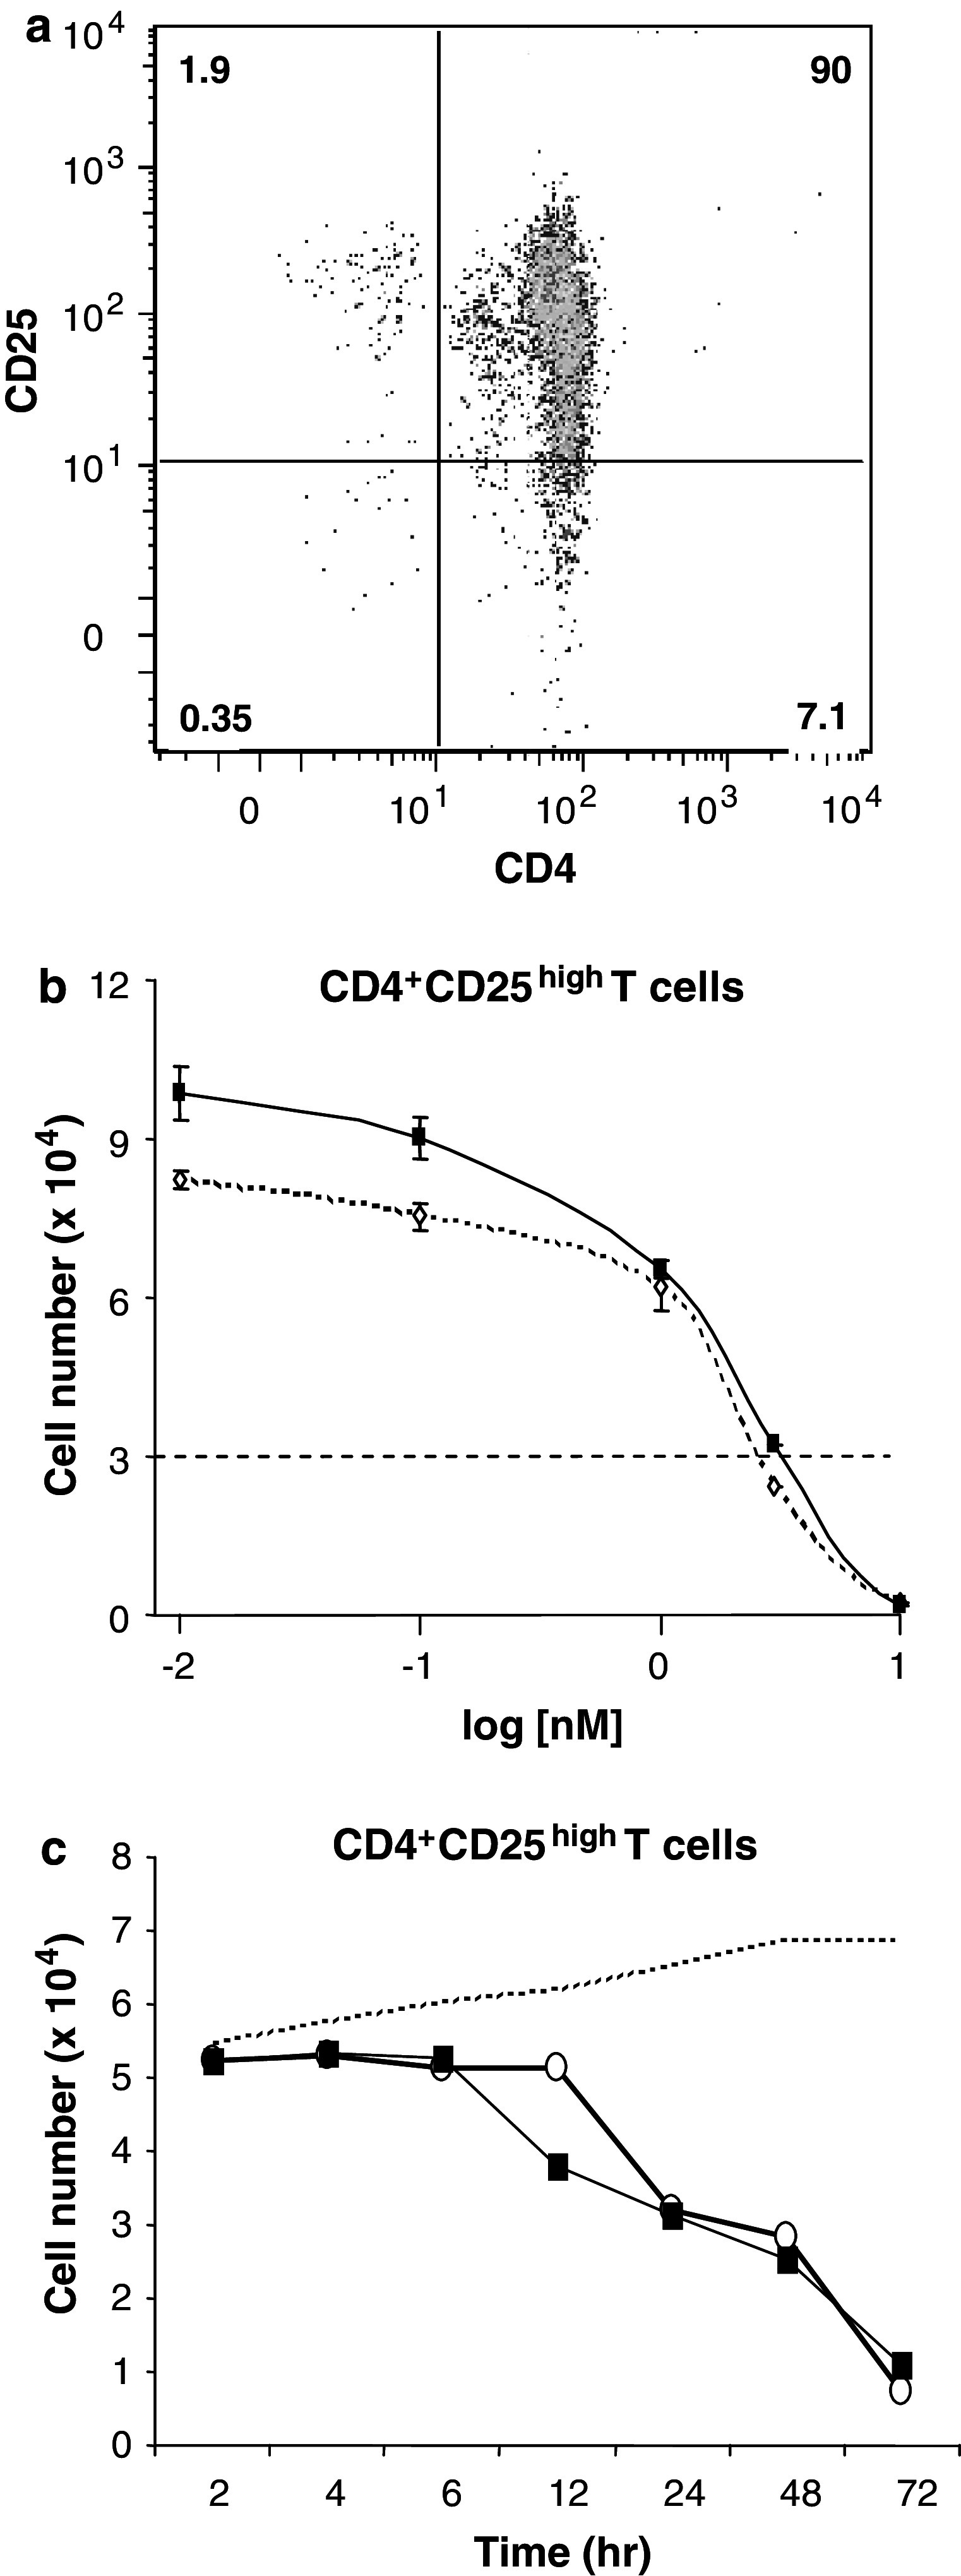
Threshold effect of Sirolimus or Sorafenib on CD3/CD28 induced proliferation of CD4+CD25high T cells. a CD4+CD25high T cells were isolated and stained with CD4-FITC (x axis) and CD25-PE (y axis) and analyzed by flow cytometry. b CD4+CD25high T cells were treated with Sirolimus or Sorafenib prior to TCR engagement with CD3/CD28 beads. Cell number (×104) is plotted on the y axis. The concentrations of Sirolimus (dotted line, open diamonds) or Sorafenib (solid line, closed squares) are plotted in log scale on the x axis from 0.01 to 10 nM. Data are mean ± SD of triplicate samples from independent experiments (n = 2 for 3 nM, n = 3 for others). c Isolated CD4+CD25high T cells were treated with 10 nM Sirolimus (open circles) or 10 nM Sorafenib (closed squares), compared to no drug (vehicle, dashed line) and then evaluated for cell number over time in hours. Data are averages of triplicate samples from two independent experiments
CD4+ and CD8+ human lymphocytes proliferate in the presence of Sirolimus or Sorafenib
CD4+ and CD8+ T cell subsets were isolated from peripheral blood mononuclear cells (PBMCs) from healthy donors. Isolation of CD4+ T cells excluded CD25+ cells, and hereafter these are referred to simply as CD4+ T cells. Representative flow cytometry data demonstrate purity >90% for CD4+CD8− negative cells (Fig. 2a) and for CD4−CD8+ cells (Fig. 2b). These T-cell subsets were pre-treated with Sirolimus or Sorafenib, then stimulated with CD3/CD28 to engage the T-cell receptor. CD4+ T cells increased in number by 150–200% after T-cell receptor engagement, as shown in Fig. 2c, open bar. Pre-treatment with either Sirolimus (hatched bars) or Sorafenib (solid bars) at 0.01 to 100 nM caused a dose-dependent decrease in proliferation (Fig. 2c). At these very low doses, a 104-fold change in concentration resulted in only about a 50% decrease in proliferation. We note that therapeutic doses of these agents produce serum levels (100 µM Sirolimus [21], 10 µM Sorafenib [10, 24]) that are 100–1,000 times higher than the concentrations tested here. When CD4+ T cells were treated with Sirolimus plus Sorafenib, in combination, at concentrations ranging from 0.01 to 100 nM, there was a net decrease in cell number relative to the initial input (data not shown). CD8+ T cells were more responsive to CD3/CD28 stimulation, increasing in number nearly 500% (Fig. 2d, open bar). Addition of even the lowest dose (0.01 nM) of Sirolimus (hatched bars) or Sorafenib (solid bars) decreased this response by nearly 50% (Fig. 2d). A 104 increase in dose resulted in little further inhibition. Thus, both CD4+ and CD8+ T cells survived in the presence of these doses of Sirolimus or Sorafenib, and CD8+ T cells continued to proliferate under these conditions.
Fig. 2.

Inhibition of CD4+ and CD8+ T cell proliferation by Sirolimus or Sorafenib. a CD4+ T cells were separated as described in the methods and analyzed by flow cytometry after staining with CD4-FITC (y axis) and CD8-APC (x axis). The percentage of cells in each quadrant is designated. b CD8+ T cells were separated as described in the methods and analyzed by flow cytometry after staining with CD4-Pe-Cy5 (y axis) and CD8-FITC (x axis). c CD4+ T cells were evaluated for increase in cell number after treatment with vehicle (no drug, white bar), Sirolimus (hatched bars), or Sorafenib (black bars), with % change in cell number plotted at different concentrations of agent (nM). d CD8+ T cells were evaluated for increase in cell number after treatment with vehicle (no drug, white bar), Sirolimus (hatched bars), or Sorafenib (black bars) with % change in cell number plotted at different concentrations (nM). Data are calculated as the mean ± SD of triplicate values from three independent experiments. Isolated CD4+ T cells (e) and CD8+ T cells (f) were treated with 10 nM Sirolimus (open circles) or 10 nM Sorafenib (closed squares), compared to no drug (vehicle, dashed line) and then evaluated for cell number over time in hours. Data are averages of triplicate samples from two independent experiments
The time dependence of the inhibitory effect of Sirolimus and Sorafenib on CD4+ and CD8+ T cell proliferation was examined. CD4+ T cells treated with vehicle, as a control, and stimulated with CD3/CD28 began to increase in number after 12 h (Fig. 2e, dashed line). In the presence of either 10 nM Sirolimus (open circles) or 10 nM Sorafenib (closed squares), the number of CD4+ T cells did not change significantly over 72 h (Fig. 2e). However, we point out that in the absence of drugs, the number of CD4+T cells increased during this time period (dotted line). By comparison, CD8+ T cells resisted inhibitory effects of low dose Sirolimus or Sorafenib and increased in cell number parallel to the control starting 4 h after addition of CD3/CD28 beads (Fig. 2f). These data demonstrate that low nanomolar doses of Sirolimus and Sorafenib were not cytotoxic for either the CD4+ or CD8+ T cell populations, a distinctly different response than with the CD4+CD25high T cells (Fig. 1c).
Apoptosis of CD4+CD25high T cells in response to Sirolimus or Sorafenib
The time-dependent depletion of CD4+CD25high T cells in response to either Sirolimus or Sorafenib was due to apoptosis. Isolated subsets of CD4+, CD8+, and CD4+CD25high T cells were treated with Sirolimus or Sorafenib and after an hour stimulated with CD3/CD28. After 12 or 24 h, apoptotic cells were stained with Annexin V and non-viable cells with 7AAD (Fig. 3). Compared to treatment with vehicle (left column), CD4+ T cells treated with either Sirolimus (center column) or Sorafenib (right column) exhibited an average (n = 3) 4- to 5-fold increase in the percentage of apoptotic and non-viable cells (Fig. 3a). Thus, the lack of change in the number of CD4+ T cells cultured in the presence of Sirolimus or Sorafenib (see Fig. 2e) likely reflects a balance of cell death and cell proliferation. The proliferation of CD4+T cells was evident in the absence of Sirolimus or Sorafenib (Fig. 2c). Treatment of CD8+ T cells with either Sirolimus or Sorafenib caused an average (n = 3) 2- to 3-fold increase in apoptotic and non-viable cells (Fig. 3b). The low observed incidence of apoptosis in the CD8+ population is consistent with a net increase in cell number in the presence of Sirolimus or Sorafenib (Fig. 2f, see above). CD4+CD25high T cells treated with either Sirolimus or Sorafenib had an average (n = 2) 4- to 6-fold increase in apoptotic and non-viable cells at 12 h (Fig. 3c). At 24 h after treatment with Sirolimus or Sorafenib, the percentage of apoptotic and non-viable cells increased further to 36 and 27%, respectively (Fig. 3d). Thus, Sirolimus and Sorafenib induced apoptosis and cell death in CD4+CD25high T cell population.
Fig. 3.
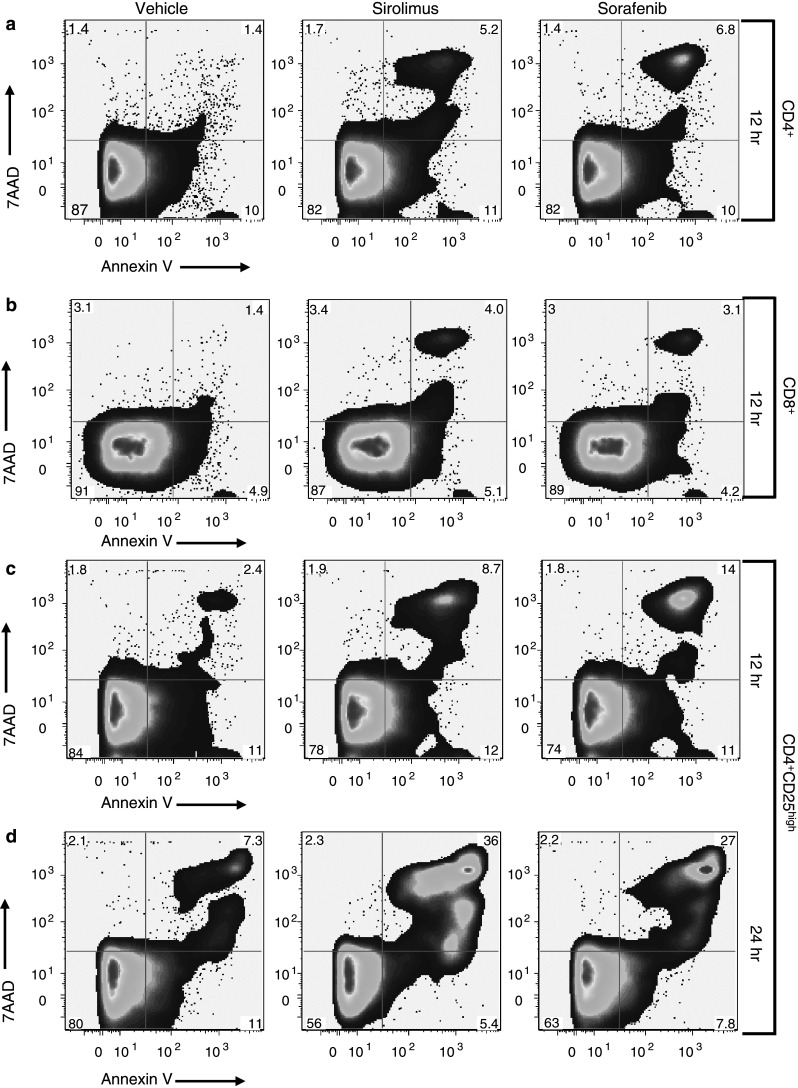
Treatment with Sirolimus or Sorafenib results in selective increases in apoptosis of CD4+CD25high T cells. CD4+T cells (a, n = 3), CD8+ T cells (b, n = 3), and CD4+CD25high T cells (c, d, n = 2 each) are stained with Annexin V-APC (x axis) and 7AAD (y axis) 12 h (a–c) or 24 h (d) after treatment with vehicle (left column), 10 nM Sirolimus (center column), or 10 nM Sorafenib (right column). Cells in all groups were stimulated with CD3/CD28 1 h after treatment with vehicle or drug
Apoptosis of CD4+CD25high T cells is dependent upon CD3/CD28 stimulation
We treated isolated CD4+CD25high T cells from healthy donors with Sirolimus or Sorafenib and after an hour, stimulated them (or not) with CD3/CD28. Without stimulation by CD3/CD28 (Fig. 4a), the number of apoptotic or non-viable CD4+CD25high T cells at 24 h was not increased by treatment with either Sirolimus (center column) or Sorafenib (right column) compared to vehicle (left column). CD4+CD25high T cells from the same donor stimulated with CD3/CD28 showed a significant increase in the number of apoptotic and non-viable cells after treatment with Sirolimus or Sorafenib (Fig. 4b). Similar results were obtained with CD4+CD25high T cells from two other normal donors (data not shown). Thus, CD4+CD25high T cells did not undergo apoptosis in response to Sirolimus or Sorafenib unless their T cell receptors were activated by CD3/CD28 co-stimulation.
Fig. 4.

Selective apoptosis of CD4+CD25high T cells is dependent upon stimulation by CD3/CD28. a CD4+CD25high T cells were isolated from a normal donor and stained with Annexin V-APC (x axis) and 7AAD (y axis) 24 h after treatment with vehicle (left column), 10 nM Sirolimus (center column), or 10 nM Sorafenib (right column). b CD4+CD25high T cells from the same donor were treated as described in a except 1 h after addition of drugs, cells were stimulated with CD3/CD28 and analyzed at 24 h. These results were replicated with CD4+CD25high T cells isolated from two additional normal donors
IL-2 abrogates the apoptotic response of CD4+CD25high T cells to Sirolimus
IL-2 is sometimes added to stimulate primary cultures of T cells. To test the effect of IL-2 on the cytotoxicity of Sirolimus, CD4+CD25high T cells were stimulated with or without CD3/CD28, with and without IL-2 (Fig. 5). Sirolimus produced dose-dependent inhibition of CD4+CD25high T cell proliferation in response to TCR activation (Fig. 5, columns 3–5), and this response was completely blocked by addition of IL-2 to the cultures (Fig. 5, columns 6–8). In controls without TCR activation, apoptosis of CD4+CD25high T cells was not increased by Sirolimus, with or without IL-2 (not shown). Thus, IL-2 prevented the cytotoxic effect of Sirolimus on CD3/CD28-stimulated CD4+CD25high T cells.
Fig. 5.

Protective effects of IL-2 on CD4+CD25high T cells treated with Sirolimus. CD4+CD25high T cells were treated with Sirolimus (0, 1 or 10 nM), CD3/CD28 beads (columns 3–8), and 1,000 IU IL-2/ml (columns 2, 6–8) as indicated in the figure. Data are averages of total cell number ± SD of triplicate samples from three independent experiments
Discussion
We began these in vitro studies because of our interest in using targeted therapies in conjunction with immunotherapy for melanoma treatment. We have found that nanomolar doses of Sirolimus and Sorafenib inhibit human melanoma cell proliferation and that combination of these and other agents are cytotoxic for human melanoma cells [14, 15]. One of our concerns with use of these targeted agents is their potential immunosuppressive effects, even at low dose, which may interfere with antitumor immunity and/or may diminish responses to immunotherapy. Here, our goal was to evaluate Sirolimus and Sorafenib for their effects on different populations of T cells from peripheral blood. Sirolimus and Sorafenib are both FDA-approved agents and are used clinically at doses that produce serum concentrations in the range of 100 µmol. At doses more than 1,000 times lower, we found in vitro cytotoxicity of primary CD4+CD25high T cells, but not CD4+ or CD8+ T cells. We stimulated proliferation of these different T-cell subsets using CD3/CD28 dynabeads as an experimental model to mimic the in vivo activation of the T-cell receptor. This method provided us with a uniform stimulus that increased cell number for each of the subsets of T cells from peripheral blood. The protocol elicited proliferation of the CD4+CD25high T cell population [8, 12, 13]. This population of cells was consistently 60–80% Foxp3+ by antibody staining in flow cytometry (data not shown). Expression of Foxp3 has been used as one marker to distinguish regulatory T cells from activated CD4+CD25+ T cells. Dependence on Foxp3 as a marker for human regulatory T cells has been challenged [16, 22, 26, 30]. It is possible that our isolated CD4+CD25highFoxp3+ T cells function in vivo as regulatory/suppressor cells (as suggested by our in vitro assays, data not shown), but we do not know whether or not cells with other functions represent part of this T cell subpopulation. Regardless, stimulation of the TCR by CD3/CD28 prompted apoptosis of the CD4+CD25high T cells when they were treated with Sirolimus or Sorafenib at <10 nM. This apoptotic effect was completely ablated by the addition of IL-2 to the culture medium. This effect could be due to activation of proliferation signals or a change in the balance of pro- versus anti-apoptotic signals. We imagine that there is opposing signaling by the T-cell receptor and the IL-2 receptor that determines the apoptotic response to Sirolimus (Fig. 6).
Fig. 6.

Model for effects of TCR activation and IL-2 on responses of CD4+CD25high T cells to Sirolimus and Sorafenib. Arrows indicate positive effects and crosses indicate negative effects
The mechanism for differential susceptibility of T cell subsets to Sirolimus or Sorafenib remains unknown. There was a dramatic loss of CD4+CD25high T cells above a 3 nM threshold dose. This titration effect is consistent with a prior report [23] and suggests titration of a limiting factor essential for CD4+CD25high T cell survival that is induced by stimulation with CD3/CD28. Thus, an intriguing question is whether there is there a common target for Sirolimus and Sorafenib. One simple explanation would be a protein inhibited by both drugs. Sirolimus and Sorafenib both inhibit protein kinases. These chemical agents have distinctive structural backbones and act by different mechanisms. Sirolimus is a macrolide that targets a prolyl-isomerase (FKBP12) that, in turn, binds and inhibits mTOR kinase at a site separate from the kinase domain. On the other hand, Sorafenib (aka:BAY43-9006, N-(3-trifluoromethyl-4-chlorophenyl)-N′-(4-(2-methylcarbamoyl pyridin-4-yl)oxyphenyl)urea), inhibits Raf and VEGFR kinases by competing with ATP for binding at the active site in the kinase domain. These considerations make it unlikely that Sirolimus and Sorafenib compete for a single intracellular receptor to trigger apoptosis in CD4+CD25high T cells. It is possible that there is an unrecognized common target for Sirolimus and Sorafenib, but our results predict that the target must: (1) bind both compounds with nanomolar affinity, (2) be induced by CD3/CD28 stimulation and (3) be essential for CD4+CD25high T cell survival, and not survival of CD4+ or CD8+ T cells. Comparative proteomic analyses of different T cell subsets could be employed to identify new nanomolar affinity targets for Sirolimus and Sorafenib. Alternatively, inhibition of the recognized targets of Sirolimus and Sorafenib (FKBP12/mTOR and Raf) might, by separate pathways, extinguish an unidentified signal that is critical for survival of CD4+CD25high T cells.
In contrast to the findings in the current manuscript, others have reported that Sirolimus selectively expands CD4+CD25high T cells in vitro [2, 23]. In that work, naïve murine CD4+ T cells were stimulated with antigen plus IL-2, in the presence or absence of 100 nM Sirolimus and cultured 4 weeks. At the end of that time, there was a relative expansion of the CD4+CD25high T cell subset without a significant change in the total cell number. This could be explained either by selective expansion of CD4+CD25high cells [2] or by conversion of CD4+ cells to CD4+CD25high [25]. These reports may seem to contradict our observations of inhibitory and cytotoxic responses of CD4+CD25high T cells to nanomolar concentrations of Sirolimus. However, in those reports, IL-2 was included in long-term cultures of T cells prior to their challenge with Sirolimus [2, 23]. We have found that IL-2 rendered CD4+CD25high T cells resistant to cytotoxic effects of Sirolimus. There are other differences between the two studies: it is possible that long-term cultures (weeks) with IL-2 may produce major changes in gene expression that could affect their response to Sirolimus. In our experiments, Sirolimus and IL-2 were added within an hour of each other, making it less likely that activation of transcription and translation by IL-2 was responsible for the resistance to Sirolimus. We think it more likely that signaling from the activated IL-2 receptor modified existing proteins to make CD4+CD25high T cells resistant to the inhibition by Sirolimus. We propose that IL-2 may stimulate anti-apoptotic signals that make the CD4+CD25high T cells resistant to the pro-apoptotic effects of Sirolimus (Fig. 6).
Acknowledgments
We thank Dr. Tom Sturgill for the use of his luminometer. The contributions by each of the authors are as follows: Kerrington R. Molhoek designed and performed most of the experiments, analyzed the data and prepared the figures and a draft of the manuscript. David L. Brautigan and Craig L. Slingluff Jr, both aided in the design of the experiments, the interpretation of the results and preparation of the figures and editing of the manuscript. Chantel C. McSkimming and Walter C. Olson performed the flow cytometry experiments and analyzed the data using the Flowjo software. Kerrington R. Molhoek, PhD was supported by the American Cancer Society, California Division Campaign for Research 2007 Postdoctoral Fellowship. This work was partly supported by grants CA77584 and CA40042 to Dr. David L. Brautigan from USPHS NCI and partly supported by funds from the Harrison Foundation to the University of Virginia Cancer Center, and Dr. Craig L. Slingluff Jr and Dr. Kerrington R. Molhoek. Partial support was also provided by a gift from the Commonwealth Foundation for Cancer Research and by the James and Rebecca Craig Foundation. Support was also provided by the NIH/NCI grant R01 CA57653 (to C.L.S.) and the University of Virginia Cancer Center Support Grant (NIH/NCI P30 CA44579). The authors declare that there are no conflicts of interest or financial interests.
References
- 1.Adnane L, Trail PA, Taylor I, Wilhelm SM. Sorafenib (BAY 43-9006, Nexavar((R))), a dual-action inhibitor that targets RAF/MEK/ERK pathway in tumor cells and tyrosine kinases VEGFR/PDGFR in tumor vasculature. Methods Enzymol. 2005;407:597–612. doi: 10.1016/S0076-6879(05)07047-3. [DOI] [PubMed] [Google Scholar]
- 2.Battaglia M, Stabilini A, Roncarolo MG. Rapamycin selectively expands CD4+CD25+FoxP3+regulatory T cells. Blood. 2005;105:4743–4748. doi: 10.1182/blood-2004-10-3932. [DOI] [PubMed] [Google Scholar]
- 3.Chan S. Targeting the mammalian target of rapamycin (mTOR): a new approach to treating cancer. Br J Cancer. 2004;91:1420–1424. doi: 10.1038/sj.bjc.6602162. [DOI] [PMC free article] [PubMed] [Google Scholar]
- 4.Chiaramonte S, Dissegna D, Ronco C. Monitoring of immunosuppressive therapy in renal transplanted patients. Contrib Nephrol. 2005;146:73–86. doi: 10.1159/000082068. [DOI] [PubMed] [Google Scholar]
- 5.Demirkiran A, Bosma BM, Kok A, Baan CC, Metselaar HJ, Ijzermans JN, Tilanus HW, Kwekkeboom J, van der Laan LJ. Allosuppressive donor CD4+CD25+ regulatory T cells detach from the graft and circulate in recipients after liver transplantation. J Immunol. 2007;178:6066–6072. doi: 10.4049/jimmunol.178.10.6066. [DOI] [PubMed] [Google Scholar]
- 6.Ehrenstein MR, Evans JG, Singh A, Moore S, Warnes G, Isenberg DA, Mauri C. Compromised function of regulatory T cells in rheumatoid arthritis and reversal by anti-TNFalpha therapy. J Exp Med. 2004;200:277–285. doi: 10.1084/jem.20040165. [DOI] [PMC free article] [PubMed] [Google Scholar]
- 7.Eto M, Naito S. Molecular targeting therapy for renal cell carcinoma. Int J Clin Oncol. 2006;11:209–213. doi: 10.1007/s10147-006-0577-2. [DOI] [PubMed] [Google Scholar]
- 8.Hoffmann P, Eder R, Kunz-Schughart LA, Andreesen R, Edinger M. Large-scale in vitro expansion of polyclonal human CD4(+)CD25high regulatory T cells. Blood. 2004;104:895–903. doi: 10.1182/blood-2004-01-0086. [DOI] [PubMed] [Google Scholar]
- 9.Hong J, Zang YC, Nie H, Zhang JZ. CD4+ regulatory T cell responses induced by T cell vaccination in patients with multiple sclerosis. Proc Natl Acad Sci USA. 2006;103:5024–5029. doi: 10.1073/pnas.0508784103. [DOI] [PMC free article] [PubMed] [Google Scholar]
- 10.Hotte SJ, Hirte HW. BAY 43-9006: early clinical data in patients with advanced solid malignancies. Curr Pharm Des. 2002;8:2249–2253. doi: 10.2174/1381612023393053. [DOI] [PubMed] [Google Scholar]
- 11.Karube K, Ohshima K, Tsuchiya T, Yamaguchi T, Kawano R, Suzumiya J, Utsunomiya A, Harada M, Kikuchi M. Expression of FoxP3, a key molecule in CD4CD25 regulatory T cells, in adult T-cell leukaemia/lymphoma cells. Br J Haematol. 2004;126:81–84. doi: 10.1111/j.1365-2141.2004.04999.x. [DOI] [PubMed] [Google Scholar]
- 12.Kreijveld E, Koenen HJ, Hilbrands LB, Joosten I. Ex vivo expansion of human CD4+CD25high regulatory T cells from transplant recipients permits functional analysis of small blood samples. J Immunol Methods. 2006;314:103–113. doi: 10.1016/j.jim.2006.06.001. [DOI] [PubMed] [Google Scholar]
- 13.Longhi MS, Ma Y, Bogdanos DP, Cheeseman P, Mieli-Vergani G, Vergani D. Impairment of CD4(+)CD25(+) regulatory T-cells in autoimmune liver disease. J Hepatol. 2004;41:31–37. doi: 10.1016/j.jhep.2004.03.008. [DOI] [PubMed] [Google Scholar]
- 14.Molhoek KR, Brautigan DL, Slingluff CL., Jr Synergistic inhibition of human melanoma proliferation by combination treatment with B-Raf inhibitor BAY43-9006 and mTOR inhibitor Rapamycin. J Transl Med. 2005;3:39. doi: 10.1186/1479-5876-3-39. [DOI] [PMC free article] [PubMed] [Google Scholar]
- 15.Molhoek KR, Griesemann H, Shu J, Gershenwald JE, Brautigan DL, Slingluff CL., Jr Human melanoma cytolysis by combined inhibition of mammalian target of rapamycin and vascular endothelial growth factor/vascular endothelial growth factor receptor-2. Cancer Res. 2008;68:4392–4397. doi: 10.1158/0008-5472.CAN-07-5844. [DOI] [PMC free article] [PubMed] [Google Scholar]
- 16.Morgan ME, van Bilsen JH, Bakker AM, Heemskerk B, Schilham MW, Hartgers FC, Elferink BG, van der Zanden L, de Vries RR, Huizinga TW, Ottenhoff TH, Toes RE. Expression of FOXP3 mRNA is not confined to CD4+CD25+T regulatory cells in humans. Hum Immunol. 2005;66:13–20. doi: 10.1016/j.humimm.2004.05.016. [DOI] [PubMed] [Google Scholar]
- 17.Morris RE, Wu J, Shorthouse R. A study of the contrasting effects of cyclosporine, FK 506, and rapamycin on the suppression of allograft rejection. Transplant Proc. 1990;22:1638–1641. [PubMed] [Google Scholar]
- 18.Nishikawa H, Qian F, Tsuji T, Ritter G, Old LJ, Gnjatic S, Odunsi K. Influence of CD4+CD25+regulatory T cells on low/high-avidity CD4+T cells following peptide vaccination. J Immunol. 2006;176:6340–6346. doi: 10.4049/jimmunol.176.10.6340. [DOI] [PubMed] [Google Scholar]
- 19.Nishimura E, Sakihama T, Setoguchi R, Tanaka K, Sakaguchi S. Induction of antigen-specific immunologic tolerance by in vivo and in vitro antigen-specific expansion of naturally arising Foxp3+CD25+CD4+ regulatory T cells. Int Immunol. 2004;16:1189–1201. doi: 10.1093/intimm/dxh122. [DOI] [PubMed] [Google Scholar]
- 20.Ou LS, Goleva E, Hall C, Leung DY. T regulatory cells in atopic dermatitis and subversion of their activity by superantigens. J Allergy Clin Immunol. 2004;113:756–763. doi: 10.1016/j.jaci.2004.01.772. [DOI] [PubMed] [Google Scholar]
- 21.Punt CJ, Boni J, Bruntsch U, Peters M, Thielert C. Phase I and pharmacokinetic study of CCI-779, a novel cytostatic cell-cycle inhibitor, in combination with 5-fluorouracil and leucovorin in patients with advanced solid tumors. Ann Oncol. 2003;14:931–937. doi: 10.1093/annonc/mdg248. [DOI] [PubMed] [Google Scholar]
- 22.Roncador G, Garcia JF, Garcia JF, Maestre L, Lucas E, Menarguez J, Ohshima K, Nakamura S, Banham AH, Piris MA. FOXP3, a selective marker for a subset of adult T-cell leukaemia/lymphoma. Leukemia. 2005;19:2247–2253. doi: 10.1038/sj.leu.2403965. [DOI] [PubMed] [Google Scholar]
- 23.Strauss L, Whiteside TL, Knights A, Bergmann C, Knuth A, Zippelius A. Selective survival of naturally occurring human CD4+CD25+Foxp3+ regulatory T cells cultured with rapamycin. J Immunol. 2007;178:320–329. doi: 10.4049/jimmunol.178.1.320. [DOI] [PubMed] [Google Scholar]
- 24.Strumberg D, Richly H, Hilger RA, Schleucher N, Korfee S, Tewes M, Faghih M, Brendel E, Voliotis D, Haase CG, Schwartz B, Awada A, Voigtmann R, Scheulen ME, Seeber S. Phase I clinical and pharmacokinetic study of the Novel Raf kinase and vascular endothelial growth factor receptor inhibitor BAY 43-9006 in patients with advanced refractory solid tumors. J Clin Oncol. 2005;23:965–972. doi: 10.1200/JCO.2005.06.124. [DOI] [PubMed] [Google Scholar]
- 25.Valmori D, Tosello V, Souleimanian NE, Godefroy E, Scotto L, Wang Y, Ayyoub M. Rapamycin-mediated enrichment of T cells with regulatory activity in stimulated CD4+T cell cultures is not due to the selective expansion of naturally occurring regulatory T cells but to the induction of regulatory functions in conventional CD4+T cells. J Immunol. 2006;177:944–949. doi: 10.4049/jimmunol.177.2.944. [DOI] [PubMed] [Google Scholar]
- 26.Walker MR, Kasprowicz DJ, Gersuk VH, Benard A, Van Landeghen M, Buckner JH, Ziegler SF. Induction of FoxP3 and acquisition of T regulatory activity by stimulated human CD4+CD25- T cells. J Clin Invest. 2003;112:1437–1443. doi: 10.1172/JCI19441. [DOI] [PMC free article] [PubMed] [Google Scholar]
- 27.Wilhelm S, Carter C, Lynch M, Lowinger T, Dumas J, Smith RA, Schwartz B, Simantov R, Kelley S. Discovery and development of sorafenib: a multikinase inhibitor for treating cancer. Nat Rev Drug Discov. 2006;5:835–844. doi: 10.1038/nrd2130. [DOI] [PubMed] [Google Scholar]
- 28.Xu D, Fu J, Jin L, Zhang H, Zhou C, Zou Z, Zhao JM, Zhang B, Shi M, Ding X, Tang Z, Fu YX, Wang FS. Circulating and liver resident CD4+CD25+ regulatory T cells actively influence the antiviral immune response and disease progression in patients with hepatitis B. J Immunol. 2006;177:739–747. doi: 10.4049/jimmunol.177.1.739. [DOI] [PubMed] [Google Scholar]
- 29.Yang ZZ, Novak AJ, Stenson MJ, Witzig TE, Ansell SM. Intratumoral CD4+CD25+ regulatory T-cell-mediated suppression of infiltrating CD4+ T cells in B-cell non-Hodgkin lymphoma. Blood. 2006;107:3639–3646. doi: 10.1182/blood-2005-08-3376. [DOI] [PMC free article] [PubMed] [Google Scholar]
- 30.Zhang L, Zhao Y. The regulation of Foxp3 expression in regulatory CD4(+)CD25(+)T cells: multiple pathways on the road. J Cell Physiol. 2007;211:590–597. doi: 10.1002/jcp.21001. [DOI] [PubMed] [Google Scholar]