Abstract
In amyloid precursor protein (APP) models of amyloid deposition, the amount of amyloid deposits increase with mouse age. At a first approximation, the extent of amyloid accumulation may either reflect small excesses of production over clearance that accumulate over time or, alternatively, indicate a steady-state equilibrium at that age, reflecting the instantaneous excess of production over clearance, which increases as the organism ages. To discriminate between these options, we reversibly suppressed amyloid deposition in Tg2576 mice with the anti-Aβ antibody 2H6, starting at 8 months, just before the first histological deposits can be discerned. Six months later, we stopped the suppression and monitored the progression of amyloid accumulation in control APP mice and suppressed APP mice over the next 3 months. The accumulation hypothesis would predict that the rate of amyloid from 14 to 17 months would be similar in the suppressed and control mice, while the equilibrium hypothesis would predict that the increase would be faster in the suppressed group, possibly catching up completely with the control mice. The results strongly support the accumulation hypothesis, with no evidence of the suppressed mice catching up with the control mice as predicted by equilibrium models. If anything, there was a slower rate of increase in the suppressed APP mice than the control mice, suggesting that a slow seeding mechanism likely precedes a rapid fibrillogenesis in determining the extent of amyloid deposition.
Introduction
Aβ is continuously produced from the amyloid precursor protein (APP) in brains of normal individuals and patients with Alzheimer's disease (AD). A key pathological feature in AD patients, deposits of Aβ build up for some period before the onset of symptoms. This gradual build up of Aβ is mimicked in APP transgenic mouse models (Games et al., 1995; Hsiao et al., 1996), despite stability of APP transgene expression (Johnson-Wood et al., 1997). Two C-terminal length variants, Aβ40 and Aβ42, accumulate with age, and form both diffuse plaques lacking glial changes and fibrillar, thioflavin-S-positive neuritic/glial plaques (Selkoe, 2001). Deposition of Aβ42 is believed to precede that of Aβ40 in the brain, which is supported by in vitro studies that show Aβ42 can aggregate more readily (Jarrett et al., 1993; Iwatsubo et al., 1994), and genetic evidence in vivo shows increased levels of Aβ42 predisposes for disease (Mann et al., 1996; Citron et al., 1997).
Aβ42 and Aβ40 have been shown to have opposing effects on amyloid deposition. McGowan et al. (2005) described BRI-mice that selectively express Aβ1-40 or Aβ1-42. BRI-Aβ40 mice express high levels of Aβ1-40 and do not develop overt amyloid pathology. In contrast, BRI-Aβ42 mice express approximately 10-fold lower levels of Aβ42 yet develop compact amyloid deposits, CAA, and diffuse Aβ deposits as early as 3 months of age (McGowan et al., 2005). In a study that compared bitransgenic mice, Tg2576 mice crossed with either BRI-Aβ42 or BRI-Aβ40 mice, to their singly transgenic littermates, it was found that Aβ42 promotes amyloid deposition and Aβ40 inhibits it (Kim et al., 2007).
Aβ plaques are thought to be formed from the gradual accumulation and aggregation of secreted Aβ in the extracellular space. This perspective is consistent with the “accumulation hypothesis” which suggests that Aβ deposition is a result of production exceeding clearance mechanisms by a small amount, and the excess becomes converted to a more stable form that deposits and builds up in a time-dependent manner (Maggio et al., 1992; Prior et al., 1996). The accumulation hypothesis predicts that treatments reducing Aβ production or increasing soluble Aβ clearance might prevent further Aβ deposition, but would not clear existing fibrillar deposits.
An alternative explanation for increasing levels of Aβ in the brain with age is that a steady-state equilibrium exists between anabolic and catabolic activities. This “equilibrium hypothesis” suggests that the rate of Aβ production and/or clearance changes during aging, and that the amount of Aβ deposited at a given age reflects the mismatch between the current rate of production and rate of clearance. This hypothesis would also predict that the different pools of Aβ are to some extent exchangeable; removal of one pool will ultimately lead to clearance of the others due to reduced saturation of normal clearance mechanisms. Insulin degrading enzyme (IDE) and neprilysin, two proteases that degrade Aβ, both are reduced with age in regions of the brain with amyloid deposition (Iwata et al., 2002; Caccamo et al., 2005).
In this study, we report our initial test of the accumulation versus equilibrium explanations for the amounts of amyloid deposited in APP mouse brain over the lifespan. We probed the question by delaying deposition using passive immunization with anti-Aβ antibodies between the ages of 8 and 14 months (Tg2576 mice typically start depositing Aβ at 9 months of age). We then released the suppression and measured the amount of deposited Aβ 3 months later.
Materials and Methods
Experimental design.
All procedures performed in this experiment were approved by the institutional animal care and use committee at the University of South Florida. All APP Tg2576-derived mice were bred in our facility at the University of South Florida and genotyped using previously described methods (Holcomb et al., 1998; Gordon et al., 2002). Importantly, we have intentionally bred out the retinal degeneration rd1 mutation from this colony to avoid the inclusion of occasional mice that are blind due to homozygous inheritance of this mutation contributed by the SJL/J background (Alamed et al., 2006). Fourteen 8-month-old APP mice were injected with the anti-Aβ antibody, 2H6 (Aβ33–40 Ig2b; Rinat Laboratories, Pfizer), for 6 months at a concentration of 10 mg/kg weekly (i.p.) until they reach 14 months of age. At this point tissues were collected from half the mice 1 d after the last injection and from the other half 12 weeks later. A parallel group of 14 litter and gender matched APP mice received weekly injections of control antibody directed against the Drosophila-specific amnesiac protein (2908, mouse monoclonal anti-Drosophila amnesiac protein IgG2b; Rinat Laboratories, Pfizer). These control APP transgenic mice underwent the same treatment and tissue collection schedule as the mice treated with the 2H6 antibody. Both male and female mice were evenly distributed in each group. An additional cohort of six 8-month-old APP mice did not receive any treatment and was used for histological purposes to establish Aβ levels at 8 months of age.
Tissue preparation.
On the day the mice were killed, the mice were overdosed with 100 mg/kg Nembutal sodium solution (Abbott Laboratories). The mice were perfused intracardially with 25 ml of 0.9% saline. The right brain hemisphere was dissected, rapidly frozen on dry ice and stored at −80°C. The left hemisphere was removed and immersion fixed in freshly prepared 4% paraformaldehyde for 24 h, then passed through 10, 20, and 30% sucrose solutions for 24 h each before tissue sectioning.
Histology.
Horizontal sections of 25 μm thickness were collected using a sliding microtome and stored in Dulbecco's PBS + 0.2% azide. A series of 8 sections spaced ∼600 μm apart were stained immunohistochemically using the free-floating method for total Aβ (rabbit polyclonal anti-Aβ, generously provided by Paul E. Gottschall, University of South Florida, Tampa, FL; 1:10,000) as previously described (Gordon et al., 2002). Additional sections were immunostained for microglial markers associated with different stages of amyloid deposition. Complement receptor 3 (CD11b) (rat monoclonal anti-CD11b, Serotec; 1:3000) was associated with the earliest deposits in young mice; CD45 (rat monoclonal anti-CD45, Serotec; 1:3000) was an intermediate stage marker, and MHC-II (rat monoclonal anti-I-A/I-E, BD PharMingen; 1:3000) was a marker associated with deposits in older mice (Gordon et al., 2002). Adjacent sections were stained with 0.2% Congo red solution in NaCl saturated 80% ethanol, which detects the compact amyloid plaques made of up fibrillar Aβ.
Quantification of the histological markers was performed using the Image-Pro Plus (Media Cybernetics) software to analyze the percentage area occupied by positive stain. Two fields of the cortex and three fields of the hippocampus were analyzed and averaged together for each mouse region.
Aβ ELISA: tissue homogenization and extraction.
Microdissected frontal cortices from one hemisphere were sequentially extracted with buffers designed to increasingly solubilize amyloid deposits. At each step, homogenization (30 s) in an appropriate buffer (150 mg/ml wet weight) which contained protease inhibitors (Complete Mini Protease Inhibitor Cocktail; Roche) was followed by centrifugation at 100,000 × g for 1 h at 4°C. The supernatant was then removed and the pellet was homogenized in the next solution used in the extraction process. The extraction took place first in Tris-buffered saline (TBS) (20 mm Tris, 137 mm NaCl, pH 7.6), and the resultant pellet was then extracted with SDS diluted with TBS to a final concentration of 2%, and the resultant pellet was then extracted with 70% formic acid (FA) diluted with TBS. Aβ1–40 and Aβ1–42 was quantified in these samples using individual Aβ1–40, 1–42 ELISA kits (Signet) in accordance with the instructions of the manufacturer, except the standards included dilutions of 2% SDS or 70% formic acid when necessary. Using the amount of protein in each extraction, the final values of Aβ in the brain were expressed as nanograms per milligram of protein. Nontransgenic tissues were processed identically in parallel with the transgenic tissues.
Antibody half-life measurement.
Seven 14-month-old APP mice were injected intraperitoneally with 10 mg/kg 2H6 and serum was collected from the tail vein at 2, 5, 8, 24, 48, 96, and 192 h. The amount of anti-Aβ antibody activity in the serum was determined by ELISA assay after dissociation of the antibody from bound Aβ by brief incubation at pH 3.5 s as described previously (Li et al., 2007). Monoclonal antibody 6E10 was used as a standard and the results are calculated as micrograms of antibody per milliliter of serum.
Western blot.
Posterior cortices were placed in 300 μl of ice-cold cell lysis buffer with protease inhibitors (Cell Signaling Technology). The brains were then homogenized for 30 s followed by a 30 s sonication. Total protein content was assessed using the Bio-Rad Protein assay kit according to the manufacturer's instructions. A 50 μg aliquot of total protein from each sample was diluted in 4× SDS loading buffer (each 100 ml of buffer contains: 3 g of Tris; 8 g of SDS; 2.5 g of DTT; 0.05 g of bromophenol blue; 40% [v:v] glycerol) and electrophoretically separated using 4–20% Tris-glycine gels at 80v for 2 h. Electrophoresed proteins were then transferred to polyvinylidene difluoride membranes (Bio-Rad), washed in 1× Tris-buffered saline with 20% Tween (TBS-T) three times, and blocked for 1 h at room temperature with Blocker BLOTTO in TBS (Pierce). After blocking, the membranes were incubated overnight at 4°C with various primary antibodies. The primary antibodies included the APP C-terminal 751–770 antibody (Calbiochem), BACE-1 (gift from Dr. Vassar and Dr. Binder), and GAPDH (Biodesign International). The membranes were washed three times with TBS-T and incubated for 1 h at room temperature with the appropriate HRP-conjugated secondary antibody. All antibodies were diluted with Blocker BLOTTO. Immunoreactive bands were detected by LumiGold ECL Western blotting detection kit (Ver II) (Signagen Laboratories) according to the manufacturer's instructions and then exposed to film which was developed for later densitometric analysis. All membranes are reprobed (without stripping) with anti-GAPDH to control for equal protein loading in each lane. Bands were quantified using Scion Image (NIH) by analyzing pixel density. Semiquantitative analysis was performed by densitometry, correcting protein levels for GAPDH.
Statistics.
To assess possible treatment-related differences in pathology at each time point, the values for each measurement were analyzed by one-way ANOVA followed by Fisher's LSD means comparisons using StatView (SAS Institute).
Results
Predicted outcomes
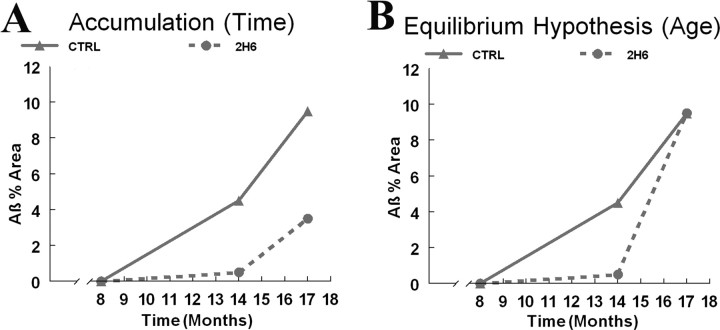
The primary dependent measure in this study was Aβ deposition. Hypothetical outcomes predicted by the “accumulation hypothesis” or the “equilibrium hypothesis” are shown in Figure 1, A and B, respectively. The accumulation hypothesis would predict that once suppression is released, the rate of increase in Aβ deposition for both the control and treated groups would be the same with the suppressed mice simply starting from a lower 14 month value. (Fig. 1 A). Conversely, the equilibrium hypothesis would predict that the rate of increase from 14 to 17 months would be faster in the suppressed mice, and they ultimately would reach the same Aβ deposit value as the APP mice injected with control antibodies (Fig. 1 B). If the Aβ deposition in suppressed mice were to catch up with the unsuppressed mice, this would argue that the environment of the aging brain was determining the amount of Aβ deposited. Hence, it was anticipated that this experimental design could discriminate between age (the altered environment of the aged brain) versus time (the gradual accumulation of deposited Aβ at all ages).
Figure 1.
Theoretical interpretation of Aβ accumulation based on the percentage area of total Aβ immunohistochemistry at 3 age points: 8, 14, and 17 months. The solid line in the figure represents the control group Aβ levels, and the dashed line represents the group treated with 2H6 for 6 months. A, The accumulation hypothesis. B, The equilibrium hypothesis.
Histological measurements
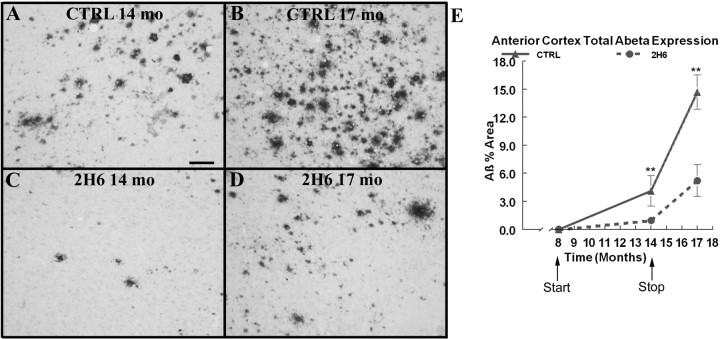
In Tg2576 mice, Aβ begins to deposit at ∼8 months of age. We immunohistochemically stained 8-month-old untreated APP mice for total Aβ and did not detect any deposits. After systemic treatment with anti-Aβ antibodies for 6 months, we observed that antibody administration prevented and substantially delayed the deposition of amyloid (Fig. 2). Total Aβ immunohistochemistry in the APP mice that received the control antibody showed several intensely stained deposits along with numerous diffuse deposits in the frontal cortex compared with the age-matched transgenic mice that received the 2H6 antibody (Fig. 2 A,B). The mice that received the control antibody demonstrated the typical amount and distribution of Aβ deposition for APP mice at these age points, with an average Aβ load of 15% in the frontal cortical area by the age of 17 months (Fig. 2 E).
Figure 2.
Total Aβ immunoreactivity is reduced following 6 months of systemic anti-Aβ antibody administration. A and B show total Aβ immunoreactivity in the frontal cortex of Tg2576 mice that received control antibody at 14 months of age and at 17 months of age, respectively. C and D show total Aβ immunoreactivity in Tg2576 mice that received anti-Aβ antibody at 14 months of age and at 17 months of age. Scale bar, 120 μm. E shows quantification of the percentage area occupied by Aβ-positive stain in the frontal cortex. The solid line shows the value for APP transgenic mice that received control antibody. The dotted line shows the values for APP transgenic mice that received anti-Aβ antibody. **p < 0.01.
The mice treated with 2H6 showed a significant suppression of amyloid deposition at the 14 month time point (Fig. 2 C). The total Aβ immunohistochemistry showed very few compact deposits as well as very sparse diffuse Aβ stain which encompassed <1.5% area of the frontal cortex (Fig. 2 C,E). Three months after treatment was stopped, the total percentage area of Aβ was 6% in the frontal cortex of mice that had been previously treated with 2H6. The Aβ percentage area from the 17 month 2H6 group resembled the percentage area from the 14-month-old control group (Fig. 2 E). Nonetheless, treatment with 2H6 antibody for 6 months resulted in significant reductions in total Aβ immunohistochemistry in the frontal cortex and these significant reductions were maintained 3 months after treatment was stopped.
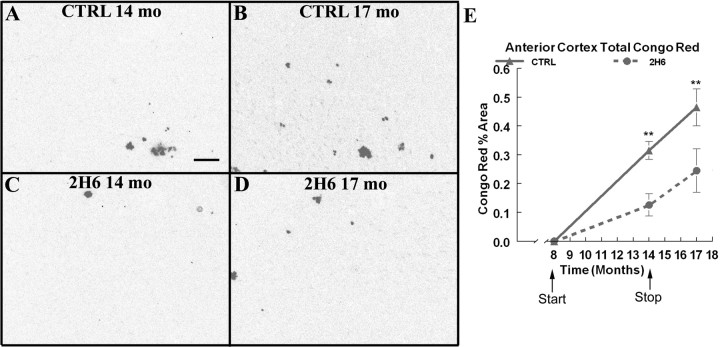
Congo red staining detects compact amyloid deposits in the β-pleated sheet formation. There are far fewer Congo red-positive deposits than Aβ deposits detected by total Aβ immunohistochemistry. Compared with the mice that received control antibody; the mice treated with 2H6 showed significantly fewer compact deposits in the frontal cortex at the 14 month time point (Fig. 3 A,C). Three months after the release of suppression, these mice continued to show significant reductions (∼50%) in compact amyloid (Fig. 3 E).
Figure 3.
. Congo red histochemistry representing compact amyloid deposits are reduced after 6 months of systemic anti-Aβ antibody administration and these reductions are maintained 3 months after the cessation of treatment. A and B show Congo red histochemistry in the frontal cortex of Tg2576 mice that received control antibody at 14 months of age and at 17 months of age. C and D show Congo red histochemistry in Tg2576 mice that received anti-Aβ antibody at 14 months of age and at 17 months of age. Scale bar, 120 μm. E shows quantification of the percentage area occupied by Congo red-positive plaques in the frontal cortex. The solid line shows the value for APP transgenic mice that received control antibody. The dotted line shows the values for APP transgenic mice that received anti-Aβ 2H6 antibody. **p < 0.01.
In addition to Aβ amyloid histology, we immunohistochemically stained for markers that correlate to various levels of microglial activation; complement receptor 3 (CD11b), CD 45, and MHC-II. Complement-receptor 3 expression was increased around the earliest Congophilic deposits in young mice. CD 45 is a protein-tyrosine phosphatase and is expressed at intermediate stages of Aβ deposition. MHC-II is a marker that is expressed around mature deposits in older mice (Gordon et al., 2002). In this study, we did not see any differences in complement-receptor 3 expression between the control and treated groups at the 14 or 17 month age points (Table 1). We also did not find differences in MHC-II immunohistochemistry between control and treated groups. In fact we rarely observed positive MHC-II microglia at the 14 or 17 month time points (Table 1).
Table 1.
Percentage area of MHC-II and CR3 expression on microglia determined by immunohistochemistry in the cortex of Tg2576 mice
| Treatment/age | MHC-II | CR3 |
|---|---|---|
| 2H6/14 months | 0.009 ± 0.003 | 1.6 ± 0.8 |
| 2908/14 months | 0.007 ± 0.004 | 1.0 ± 0.4 |
| 2H6/17 months | 0.059 ± 0.027 | 10.8 ± 1.9 |
| 2908/17 months | 0.066 ± 0.041 | 14.2 ± 2.4 |
Values are mean ± SEM.
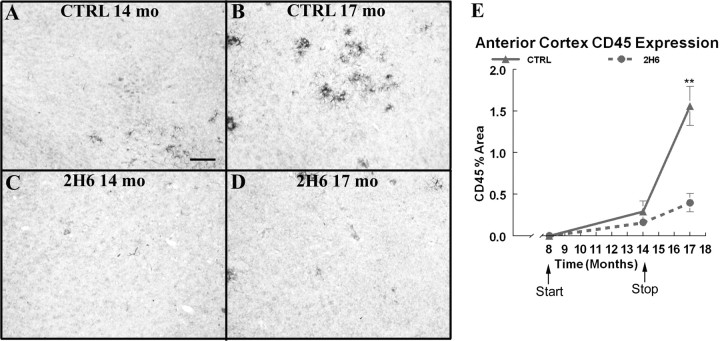
At the 14 month time point, the CD 45 staining of microglia is extremely low in both the treated and control group (Fig. 4 A,C). However, we observed a significant increase in CD45 expression on microglia surrounding amyloid deposits in the frontal cortex of the APP control group at the 17 month time point (Fig. 4 B). In the 2H6 treated mice, 3 months after the treatment was stopped, the 17-month-old CD45 expression resembled the 14 month control group expression levels (Fig. 4 E). The CD 45 expression time course resembled the total Aβ time course, where the control group demonstrated an accelerated increase in expression between 14 and 17 months of age and the treated group showed a slight increase in this period of time with the endpoint resembling the 14 month untreated group levels.
Figure 4.
CD 45 expression is reduced after 6 months of systemic anti-Aβ antibody administration and these reductions are maintained 3 months after the cessation of treatment. A and B show CD 45 immunoreactivity in the frontal cortex of Tg2576 mice that received control antibody at 14 months of age and at 17 months of age, respectively. C and D show CD 45 immunoreactivity in Tg2576 mice that received anti-Aβ antibody at 14 months of age and at 17 months of age. Scale bar, 120 μm.
Neurochemical measurements
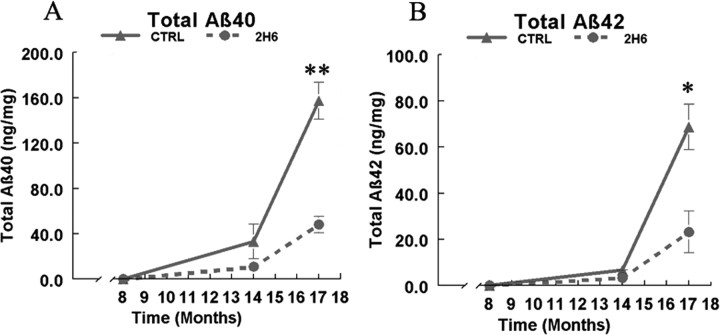
To confirm the histological findings, anterior cortex homogenates from the contralateral side of the brain were extracted sequentially in TBS, 2% SDS, and 70% formic acid and measured for Aβ40 and Aβ42 levels with sandwich ELISAs (Table 2). The sequential extractions allowed measurement of different pools of Aβ. Tg2576 mice at 14–17 months of age have small amounts of TBS-soluble Aβ (Kawarabayashi et al., 2001). Most Aβ requires SDS or formic acid for solubilization since the most abundant form of Aβ at these ages are the insoluble, fibrillar forms (Kawarabayashi et al., 2001). In both Aβ40 and Aβ42 ELISAs, the greatest concentration of Aβ was found in the SDS extraction (Table 2). The ELISAs confirmed the changes found with the histological markers. Significant reductions were found in the levels of both Aβ40 and Aβ42 in the transgenic mice treated with 2H6 at the 14 month time point (Fig. 5 A,B). These significant reductions were maintained 3 months after treatment was stopped. Interestingly, the 2H6 antibody directed against Aβ33–40 was able to reduce Aβ42.
Table 2.
ELISA measurements of Aβ 40 and Aβ 42 after a three-step extraction from the anterior cortex of Tg2576 mice following 6 months of passive immunization with either control IgG or anti-Aβ antibody 2H6
| Aβ | Age (months) | Treatment | TBS [ng/mg (%)] | 2% SDS [μg/mg (%)] | 70% FA [ng/mg (%)] | Total [ng/mg (%)] |
|---|---|---|---|---|---|---|
| Aβ 40 | 14 | Control IgG | 0.7 ± 0.2 (2.0) | 26 ± 11 (65) | 6.8 ± 3.5 (17) | 33.5 (83) |
| 2H6 | 0.4 ± 0.1 (3.0) | 6.0 ± 1.4 (43) | 4.1 ± 1.2 (29) | 10.5 (76) | ||
| 17 | Control IgG | 1.7 ± 0.5 (1.0) | 135 ± 19 (60) | 21 ± 3.4 (9.0) | 157.7 (70) | |
| 2H6 | 1.0 ± 0.3 (1.0) | 33.0 ± 5.1 (42) | 18 ± 2.9 (23) | 52 (66) | ||
| Aβ 42 | 14 | Control IgG | 0.2 ± 0.03 (1.0) | 6.0 ± 1.9 (15) | 0.5 ± 0.2 (1.0) | 6.7 (17) |
| 2H6 | 0.1 ± 0.02 (1.0) | 3.0 ± 0.4 (22) | 0.3 ± 0.01 (2.0) | 3.4 (24) | ||
| 17 | Control IgG | 0.7 ± 0.2 (0.3) | 64 ± 10 (28) | 3.9 ± 0.6 (2.0) | 68.6 (30.3) | |
| 2H6 | 0.4 ± 0.2 (5.0) | 22 ± 10 (28) | 4.4 ± 1.1 (6.0) | 26.8 (34) |
Numbers in parentheses show the percentage of total Aβ in the fraction.
Figure 5.
ELISA measurements of Aβ40 and Aβ42 after extraction in TBS, SDS, and formic acid from the anterior cortex of Tg2576 mice following 6 months of passive immunization with either control IgG or anti-Aβ antibody 2H6. A represents total measurements (encompassing all 3 extracts) for Aβ40 in 14- and 17-month-old Tg2576 mice treated with either control IgG or anti-Aβ 2H6. B represents the average total measurements (encompassing all 3 extracts) of Aβ42 in 14- and 17-month-old Tg2576 mice treated with either control IgG or anti-Aβ 2H6. *p < 0.05 for the averages consisting of the three extractions in mice treated with 2H6 compared with mice treated with control IgG.
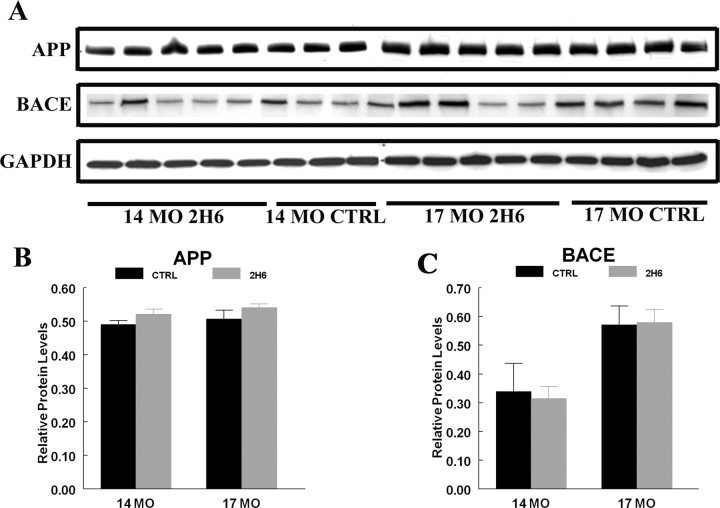
To ensure that long-term antibody treatment did not alter APP processing, we measured steady-state levels of APP and BACE in posterior cortex homogenates by Western blot analysis. We found that the holo-APP protein levels were unaltered with age or treatment (Fig. 6 A,B). BACE-1 levels, however, increased with age, but antibody treatment did not alter these levels (Fig. 6 A,C). A recent observation in APP mice found that BACE-1 expression increased with age in APP mice (Zhao et al., 2007). In addition to holo-APP and BACE-1, we measured α-CTFs and β-CTFs and found no significant changes with treatment or age (data not shown).
Figure 6.
Western blot analysis of holo-APP and BACE-1 in 14- and 17-month-old Tg2576 mice that received control IgG or anti-Aβ 2H6. The blots for APP and BACE-1 are shown in A for posterior cortex. B and C show the quantification of Western blots for APP and BACE-1. The average densitometric values after GAPDH normalization represent protein levels for each time point.
Measurement of antibody half life and plasma levels of Aβ
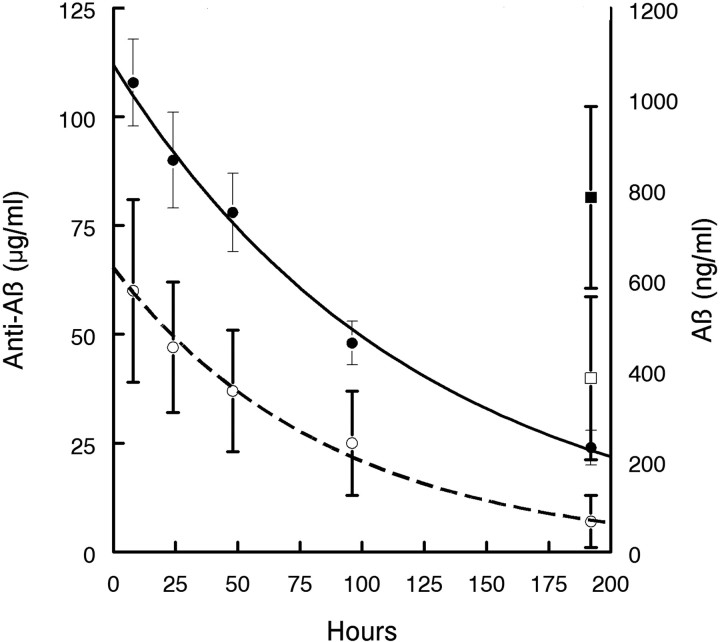
APP mice were injected intraperitoneally with antibody 2H6 and bled serially through the tail vein. Antibody concentration in plasma was determined by two methods using 6E10 as a standard; the standard ELISA method at a pH of 7 and dissociation of antibody from bound Aβ by ELISA using a pH of 3.5. The earliest time points, 2 and 5 h, were not plotted as the maximum serum concentration was not yet achieved as the antibody was absorbed from the peritoneal to serum compartments (values were 35 ± 8 and 39 ± 13 at 2 and 5 h, respectively, at pH of 7 and 65 ± 8 and 78 ± 40, respectively, at a pH of 3.5). The remaining values (8 h through 8 d) were analyzed by linear regression after plotting the log antibody concentration versus time (Fig. 7). Using the dissociated ELISA method, 50% reduction from the t 0 time point occurred at 90 h, indicating a half life of >3 d. When we calculated the antibody half life using the traditional ELISA method at a pH of 7 (associated method), the 50% reduction from the t 0 time point occurred at 50 h, indicating a half life of ∼2 d. We also measured plasma levels of Aβ from each time point and found a gradual increase in levels that peaked at the 48 h time point (Table 3). We were able to analyze Aβ levels at the 8 d time point with both the dissociated and associated ELISA methods (Table 3).
Figure 7.
Half-life of circulating 2H6 in APP transgenic mice at 14 months of age and plasma Aβ levels at the 8 d (200 h) time point. Serum was tested for anti-Aβ antibodies by ELISA using two methods of dissociation from bound Aβ. Antibody 6E10 was used as a standard anti-Aβ antibody. Results in micrograms of antibody per milliliter of serum were plotted on a semi-log scale to permit linear interpretation of the rate of antibody clearance. Line is drawn by linear regression of the data points shown (data points obtained during the absorption phase were excluded; see text). Solid line indicates anti-Aβ antibody levels detected using the dissociated ELISA method at a pH 3.5. The dotted line indicates anti-Aβ antibody levels at a pH of 7. Plasma levels of Aβ in ng/ml are plotted on the right y-axis. Data are mean ± SEM.
Table 3.
Time course of ELISA measurements of total Aβ in serum after a single administration of anti-Aβ antibody 2H6 at 10 mg/kg
| 2 h | 5 h | 8 h | 24 h | 48 h | 96 h | 8 d | |
|---|---|---|---|---|---|---|---|
| Average Aβ (ng/ml) | 591 ± 137 | 611 ± 226 | 1353 ± 384 | 2086 ± 833 | 2169 ± 734 | 1431 ± 705 | 383 ± 210 |
Column headings indicate time after administration.
Discussion
This study was designed to investigate whether the extent of Aβ amyloid deposition in mice of a given age resulted from gradual accretion over time (accumulation) or reflected the steady-state differential between production and clearance (equilibrium).
A priori, the default assumption is that the accumulation hypothesis explains the age-dependent increase in amyloid deposits in mice and men. However, several reports have emerged that are best explained by the equilibrium hypothesis. Previously we showed that intracranial administration of LPS resulted in rapid clearance of diffuse Aβ by at least 50% that returned rapidly to control levels by 3 weeks, replacing amyloid loads that originally required months to accumulate (Herber et al., 2004). Similarly, intracranial injections of anti-Aβ antibodies rapidly cleared 50% or more of deposited Aβ, yet resulted in rapid return toward control levels within weeks (Chauhan et al., 2004; Oddo et al., 2004). In addition, there are several anomalies found in anti-Aβ immunotherapy studies that suggest amyloid plaques are pliable and subject to equilibrium conditions. For example, antibodies specific for the 40 aa length Aβ peptide result in reductions of both Aβ40 and Aβ42 (Levites et al., 2006) (Fig. 5). This is even true for diffuse deposits which are composed of Aβ42 (Gordon et al., 2001). Antibodies generated against Aβ in the human vaccine trials were composed almost exclusively of N-terminal anti-Aβ antibodies, yet ultimately the serum cleared both intact and N-terminally truncated Aβ (although the latter was cleared more slowly) (Holmes et al., 2008).
Based on the results described above, we anticipated that the equilibrium hypothesis would be at least partially responsible for the observed accumulation of amyloid with age. However, the observations taken from this study clearly deny the concept that deposited Aβ is in equilibrium with more accessible and readily cleared pools. Even 3 months after withdrawal of the suppression, the deposition of amyloid and microglial activation never reached the levels found in the control transgenic group. This was consistently observed regardless of the measurement, Aβ immunohistochemistry, Congo red staining, Aβ ELISA, and microglial activation measurements all exhibited suppression at the 14 month time point and slower rates of increase up to 17 months. In fact, if anything the rates of Aβ accumulation were somewhat slower in the suppressed mice than those treated with control antibody. It appeared as if the entire process of amyloid deposition was delayed by nearly 6 months, with the rate of accumulation at 14 months in the suppressed mice being similar to that in the control APP mice at 9 months. Thus, these data strongly support the accumulation hypothesis
In addition, these data are consistent with the concept that Aβ“seeds,” analogous to nucleation centers for crystal formation, are fundamental to its deposition. Growth of the fibrils occurs by assembly of the Aβ seeds into intermediate protofibrils, which in turn self-associate to form mature fibers. Fibrillogenesis is a two-step reaction involving an initial slow, lag period that reflects the thermodynamic barrier to the formation of a nucleation “seed” followed by a rapid fibril propagation and aggregation stage (Jarrett and Lansbury, 1993). The C-terminal region of the Aβ peptide, amino acids 29–40/42, contributes to the key β-sheet structure as well as fibril assembly via side-chain interactions (Kirschner et al., 1987). This region is also important for the structural transition and the stability of Aβ fibrils. The anti-Aβ 2H6 antibody targets the C-terminal end of Aβ40 and may interfere with the precursor pool that is responsible for the aggregation of Aβ, thus resulting in a shifted deposition curve to the right and essentially more effective prevention.
One major difference between our study design and the studies that show a rapid return in amyloid levels after treatment is the age of the animals at the time of treatment. In the studies observing the rapid return of Aβ plaque had abundant plaque deposition at the time of treatment; all mice were treated at ages when plaque deposition was at a mature stage. It is conceivable that the losses observed with the acute treatments were largely removing major portions of the fibrils, but the seeds remained, permitting rapid reaccumulation. However, the initiation of treatment in the present study at 8 months not only prevents the deposition of amyloid but may also prevent the production of Aβ seeds. Das et al. (2001) immunized 3 different age groups of Tg2576 mice that were classified by the amount of preexisting Aβ deposition (minimal, modest, and significant) at the time of vaccination with Aβ1–42. Using ELISA and immunohistochemistry to quantify Aβ, this group found that Aβ1–42 immunization was highly effective in mice with minimal or modest deposition and less effective in mice with significant preexisting Aβ loads (Das et al., 2001). Essentially, these data suggest that enhancing the clearance of amyloid early in the pathogenesis of APP mice delays all components of the process of amyloid deposition.
The apparent absence of equilibrium between deposited and soluble Aβ pools would suggest that treatments reducing Aβ production or increasing clearance only of soluble Aβ might prevent further Aβ deposition, but would not remove existing deposits, especially the fibrillar deposits with associated neuritic dystrophy and glial activation. Jankowsky et al. (2005) created an Aβ-depositing mouse that overexpresses mutant APP from a vector that is regulated by doxycycline. Administration of doxycycline suppresses the mutant APP expression up to 95%, and, essentially, turns off the production of Aβ. When doxycycline was administered after the onset of amyloid pathology the progression of amyloid pathology was arrested; however, existing plaques remained (Jankowsky et al., 2005).
Meyer-Luehmann et al. (2008) studied the kinetics of plaque formation using a multiphoton laser confocal microscope, and discovered that new plaques form within 24 h and their size and final characteristics stabilize within a week (Meyer-Luehmann et al., 2008). These deposits appear to change minimally over the ensuing weeks to months. Treatment of Tg2576 APP mice with a gamma secretase inhibitor from 12 to 15 months of age slows the rate of Aβ deposition, but does not clear preexisting deposits, or even completely prevent new deposits from forming (Best et al., 2007).
Based on our findings we hypothesize that AD therapies that alter the production of Aβ by inhibiting secretase activity or inhibiting APP expression may not reverse preexisting pathology. These data strongly support the use of prophylactic treatments, as it appears that amyloid deposits will require interventions that actively clear amyloid as the only means to efficiently reduce brain Aβ in AD.
Footnotes
This work was supported by National Institute on Aging Grants AG 04418 and AG 18478 to D.M.
A.R. was an employee of Rinat Neurosciences Corporation. D.K. and J.P. are currently employees of Rinat-Pfizer. R.K. has consulted for Rinat Neuroscience. D.M. has presented results at Pfizer-sponsored symposia. Rinat holds the patents for the antibodies used in the studies presented here.
References
- Alamed J, Wilcock DM, Diamond DM, Gordon MN, Morgan D. Two-day radial-arm water maze learning and memory task; robust resolution of amyloid-related memory deficits in transgenic mice. Nat Protoc. 2006;1:1671–1679. doi: 10.1038/nprot.2006.275. [DOI] [PubMed] [Google Scholar]
- Best JD, Smith DW, Reilly MA, O'Donnell R, Lewis HD, Ellis S, Wilkie N, Rosahl TW, Laroque PA, Boussiquet-Leroux C, Churcher I, Atack JR, Harrison T, Shearman MS. The novel gamma secretase inhibitor N-[cis-4-[(4-chlorophenyl)sulfonyl]-4-(2,5-difluorophenyl)cyclohexyl]-1,1, 1-trifluoromethanesulfonamide (MRK-560) reduces amyloid plaque deposition without evidence of notch-related pathology in the Tg2576 mouse. J Pharmacol Exp Ther. 2007;320:552–558. doi: 10.1124/jpet.106.114330. [DOI] [PubMed] [Google Scholar]
- Caccamo A, Oddo S, Sugarman MC, Akbari Y, LaFerla FM. Age- and region-dependent alterations in Abeta-degrading enzymes: implications for Abeta-induced disorders. Neurobiol Aging. 2005;26:645–654. doi: 10.1016/j.neurobiolaging.2004.06.013. [DOI] [PubMed] [Google Scholar]
- Chauhan NB, Siegel GJ, Lichtor T. Effect of age on the duration and extent of amyloid plaque reduction and microglial activation after injection of anti-Abeta antibody into the third ventricle of TgCRND8 mice. J Neurosci Res. 2004;78:732–741. doi: 10.1002/jnr.20298. [DOI] [PubMed] [Google Scholar]
- Citron M, Westaway D, Xia W, Carlson G, Diehl T, Levesque G, Johnson-Wood K, Lee M, Seubert P, Davis A, Kholodenko D, Motter R, Sherrington R, Perry B, Yao H, Strome R, Lieberburg I, Rommens J, Kim S, Schenk D, Fraser P, St George Hyslop P, Selkoe DJ. Mutant presenilins of Alzheimer's disease increase production of 42-residue amyloid beta-protein in both transfected cells and transgenic mice. Nat Med. 1997;3:67–72. doi: 10.1038/nm0197-67. [DOI] [PubMed] [Google Scholar]
- Das P, Murphy MP, Younkin LH, Younkin SG, Golde TE. Reduced effectiveness of Abeta1–42 immunization in APP transgenic mice with significant amyloid deposition. Neurobiol Aging. 2001;22:721–727. doi: 10.1016/s0197-4580(01)00245-7. [DOI] [PubMed] [Google Scholar]
- Games D, Adams D, Alessandrini R, Barbour R, Berthelette P, Blackwell C, Carr T, Clemens J, Donaldson T, Gillespie F. Alzheimer-type neuropathology in transgenic mice overexpressing V717F beta-amyloid precursor protein. Nature. 1995;373:523–527. doi: 10.1038/373523a0. [DOI] [PubMed] [Google Scholar]
- Gordon MN, King DL, Diamond DM, Jantzen PT, Boyett KV, Hope CE, Hatcher JM, DiCarlo G, Gottschall WP, Morgan D, Arendash GW. Correlation between cognitive deficits and Abeta deposits in transgenic APP+PS1 mice. Neurobiol Aging. 2001;22:377–385. doi: 10.1016/s0197-4580(00)00249-9. [DOI] [PubMed] [Google Scholar]
- Gordon MN, Holcomb LA, Jantzen PT, DiCarlo G, Wilcock D, Boyett KW, Connor K, Melachrino J, O'Callaghan JP, Morgan D. Time course of the development of Alzheimer-like pathology in the doubly transgenic PS1+APP mouse. Exp Neurol. 2002;173:183–195. doi: 10.1006/exnr.2001.7754. [DOI] [PubMed] [Google Scholar]
- Herber DL, Roth LM, Wilson D, Wilson N, Mason JE, Morgan D, Gordon MN. Time-dependent reduction in Abeta levels after intracranial LPS administration in APP transgenic mice. Exp Neurol. 2004;190:245–253. doi: 10.1016/j.expneurol.2004.07.007. [DOI] [PubMed] [Google Scholar]
- Holcomb L, Gordon MN, McGowan E, Yu X, Benkovic S, Jantzen P, Wright K, Saad I, Mueller R, Morgan D, Sanders S, Zehr C, O'Campo K, Hardy J, Prada CM, Eckman C, Younkin S, Hsiao K, Duff K. Accelerated Alzheimer-type phenotype in transgenic mice carrying both mutant amyloid precursor protein and presenilin 1 transgenes. Nat Med. 1998;4:97–100. doi: 10.1038/nm0198-097. [DOI] [PubMed] [Google Scholar]
- Holmes C, Boche D, Wilkinson D, Yadegarfar G, Hopkins V, Bayer A, Jones RW, Bullock R, Love S, Neal JW, Zotova E, Nicoll JA. Long-term effects of Abeta42 immunisation in Alzheimer's disease: follow-up of a randomised, placebo-controlled phase I trial. Lancet. 2008;372:216–223. doi: 10.1016/S0140-6736(08)61075-2. [DOI] [PubMed] [Google Scholar]
- Hsiao K, Chapman P, Nilsen S, Eckman C, Harigaya Y, Younkin S, Yang F, Cole G. Correlative memory deficits, Abeta elevation, and amyloid plaques in transgenic mice. Science. 1996;274:99–102. doi: 10.1126/science.274.5284.99. [DOI] [PubMed] [Google Scholar]
- Iwata N, Takaki Y, Fukami S, Tsubuki S, Saido TC. Region-specific reduction of A beta-degrading endopeptidase, neprilysin, in mouse hippocampus upon aging. J Neurosci Res. 2002;70:493–500. doi: 10.1002/jnr.10390. [DOI] [PubMed] [Google Scholar]
- Iwatsubo T, Odaka A, Suzuki N, Mizusawa H, Nukina N, Ihara Y. Visualization of A beta 42(43) and A beta 40 in senile plaques with end-specific A beta monoclonals: evidence that an initially deposited species is A beta 42(43) Neuron. 1994;13:45–53. doi: 10.1016/0896-6273(94)90458-8. [DOI] [PubMed] [Google Scholar]
- Jankowsky JL, Slunt HH, Gonzales V, Savonenko AV, Wen JC, Jenkins NA, Copeland NG, Younkin LH, Lester HA, Younkin SG, Borchelt DR. Persistent amyloidosis following suppression of Abeta production in a transgenic model of Alzheimer disease. PLoS Med. 2005;2:e355. doi: 10.1371/journal.pmed.0020355. [DOI] [PMC free article] [PubMed] [Google Scholar]
- Jarrett JT, Lansbury PT., Jr Seeding “one-dimensional crystallization” of amyloid: a pathogenic mechanism in Alzheimer's disease and scrapie? Cell. 1993;73:1055–1058. doi: 10.1016/0092-8674(93)90635-4. [DOI] [PubMed] [Google Scholar]
- Jarrett JT, Berger EP, Lansbury PT., Jr The carboxy terminus of the beta amyloid protein is critical for the seeding of amyloid formation: implications for the pathogenesis of Alzheimer's disease. Biochemistry. 1993;32:4693–4697. doi: 10.1021/bi00069a001. [DOI] [PubMed] [Google Scholar]
- Johnson-Wood K, Lee M, Motter R, Hu K, Gordon G, Barbour R, Khan K, Gordon M, Tan H, Games D, Lieberburg I, Schenk D, Seubert P, McConlogue L. Amyloid precursor protein processing and A beta42 deposition in a transgenic mouse model of Alzheimer disease. Proc Natl Acad Sci U S A. 1997;94:1550–1555. doi: 10.1073/pnas.94.4.1550. [DOI] [PMC free article] [PubMed] [Google Scholar]
- Kawarabayashi T, Younkin LH, Saido TC, Shoji M, Ashe KH, Younkin SG. Age-dependent changes in brain, CSF, and plasma amyloid β protein in the Tg2576 transgenic mouse model of Alzheimer's disease. J Neurosci. 2001;21:372–381. doi: 10.1523/JNEUROSCI.21-02-00372.2001. [DOI] [PMC free article] [PubMed] [Google Scholar]
- Kim J, Onstead L, Randle S, Price R, Smithson L, Zwizinski C, Dickson DW, Golde T, McGowan E. Abeta40 inhibits amyloid deposition in vivo . J Neurosci. 2007;27:627–633. doi: 10.1523/JNEUROSCI.4849-06.2007. [DOI] [PMC free article] [PubMed] [Google Scholar]
- Kirschner DA, Inouye H, Duffy LK, Sinclair A, Lind M, Selkoe DJ. Synthetic peptide homologous to beta protein from Alzheimer disease forms amyloid-like fibrils in vitro. Proc Natl Acad Sci U S A. 1987;84:6953–6957. doi: 10.1073/pnas.84.19.6953. [DOI] [PMC free article] [PubMed] [Google Scholar]
- Levites Y, Jansen K, Smithson LA, Dakin R, Holloway VM, Das P, Golde TE. Intracranial adeno-associated virus-mediated delivery of anti-pan amyloid beta, amyloid β40, and amyloid β42 single-chain variable fragments attenuates plaque pathology in amyloid precursor protein mice. J Neurosci. 2006;26:11923–11928. doi: 10.1523/JNEUROSCI.2795-06.2006. [DOI] [PMC free article] [PubMed] [Google Scholar]
- Li Q, Gordon M, Cao C, Ugen KE, Morgan D. Improvement of a low pH antigen-antibody dissociation procedure for ELISA measurement of circulating anti-Abeta antibodies. BMC Neurosci. 2007;8:22. doi: 10.1186/1471-2202-8-22. [DOI] [PMC free article] [PubMed] [Google Scholar]
- Maggio JE, Stimson ER, Ghilardi JR, Allen CJ, Dahl CE, Whitcomb DC, Vigna SR, Vinters HV, Labenski ME, Mantyh PW. Reversible in vitro growth of Alzheimer disease beta-amyloid plaques by deposition of labeled amyloid peptide. Proc Natl Acad Sci U S A. 1992;89:5462–5466. doi: 10.1073/pnas.89.12.5462. [DOI] [PMC free article] [PubMed] [Google Scholar]
- Mann DM, Iwatsubo T, Cairns NJ, Lantos PL, Nochlin D, Sumi SM, Bird TD, Poorkaj P, Hardy J, Hutton M, Prihar G, Crook R, Rossor MN, Haltia M. Amyloid beta protein (Abeta) deposition in chromosome 14-linked Alzheimer's disease: predominance of Abeta42(43) Ann Neurol. 1996;40:149–156. doi: 10.1002/ana.410400205. [DOI] [PubMed] [Google Scholar]
- McGowan E, Pickford F, Kim J, Onstead L, Erikson J, Yu C, Skipper L, Murphy MP, Beard J, Das P, Jansen K, Delucia M, Lin WL, Dolios G, Wang R, Eckman CB, Dickson DW, Hutton M, Hardy J, Golde T. Abeta42 is essential for parenchymal and vascular amyloid deposition in mice. Neuron. 2005;47:191–199. doi: 10.1016/j.neuron.2005.06.030. [DOI] [PMC free article] [PubMed] [Google Scholar]
- Meyer-Luehmann M, Spires-Jones TL, Prada C, Garcia-Alloza M, de Calignon A, Rozkalne A, Koenigsknecht-Talboo J, Holtzman DM, Bacskai BJ, Hyman BT. Rapid appearance and local toxicity of amyloid-beta plaques in a mouse model of Alzheimer's disease. Nature. 2008;451:720–724. doi: 10.1038/nature06616. [DOI] [PMC free article] [PubMed] [Google Scholar]
- Oddo S, Billings L, Kesslak JP, Cribbs DH, LaFerla FM. Abeta immunotherapy leads to clearance of early, but not late, hyperphosphorylated tau aggregates via the proteasome. Neuron. 2004;43:321–332. doi: 10.1016/j.neuron.2004.07.003. [DOI] [PubMed] [Google Scholar]
- Prior R, D'Urso D, Frank R, Prikulis I, Cleven S, Ihl R, Pavlakovic G. Selective binding of soluble Abeta1–40 and Abeta1–42 to a subset of senile plaques. Am J Pathol. 1996;148:1749–1756. [PMC free article] [PubMed] [Google Scholar]
- Selkoe DJ. Alzheimer's disease: genes, proteins, and therapy. Physiol Rev. 2001;81:741–766. doi: 10.1152/physrev.2001.81.2.741. [DOI] [PubMed] [Google Scholar]
- Zhao J, Fu Y, Yasvoina M, Shao P, Hitt B, O'Connor T, Logan S, Maus E, Citron M, Berry R, Binder L, Vassar R. β-site amyloid precursor protein cleaving enzyme 1 levels become elevated in neurons around amyloid plaques: implications for Alzheimer's disease pathogenesis. J Neurosci. 2007;27:3639–3649. doi: 10.1523/JNEUROSCI.4396-06.2007. [DOI] [PMC free article] [PubMed] [Google Scholar]


