Abstract
FGFs modulate diverse biological processes including embryonic development. Secreted FGF-binding proteins (BPs) can release FGFs from their local extracellular matrix storage, chaperone them to their cognate receptors, and thus modulate FGF signaling. Here we describe 2 chicken BP homologs (chBP) that show distinct expression peaks at embryonic days E7.5 (chBP2) and E11.5 (chBP1), although their tissue distribution is similar (skin = intestine>lung>heart, liver). Embryos were grown ex ovo to monitor the phenotypic impact of a timed in vivo knockdown of expression peaks by microinjection of specific siRNAs targeted to either of the chBPs. Knockdown of peak expression of chBP2 caused embryonic lethality within <5 days. Surviving embryos showed defective ventral wall closure indicative of altered dorsoventral patterning. This defect coincided with reduced expression of HoxB7 but not HoxB8 that are involved in the control of thoracic/abdominal segment morphology. Also, MAPK phosphatase 3, a negative regulator of FGF signaling, and sonic hedgehog that can participate in feedback control of the FGF pathway were reduced, reflecting altered FGF signaling. Knockdown of the chBP1 expression peak caused embryonic lethality within <3 days although no distinct morphologic phenotype or pathways alterations were apparent. We conclude that BPs play a significant role in fine-tuning the complex FGF signaling network during distinct phases of embryonic development.
Keywords: body wall defect, chick embryo, siRNA, Hox B, Shh
The FGF family consists of 18 distinct proteins that function as receptor ligands and 4 transmembrane receptor tyrosine kinases with multiple isoforms, thus creating a vast and complex signaling network (1). FGF signaling plays a significant role in development as well as in the maintenance of the cardiovascular and nervous systems in the adult organism (2, 3). FGFs also have been shown to be essential in wound healing (4) and to contribute to the growth and metastasis of cancer cells (5). FGFs are expressed in embryonic and adult tissues, and most of these proteins bind to heparan sulfate proteoglycans (HSPGs) in the ECM. This local storage provides additional control of growth factor activity in development and disease (6). Two distinct mechanisms have been described by which locally immobilized FGFs can be released from their HSPG storage: One mechanism involves digestion of the sugar backbone of HSPGs by heparanases or other glycosaminoglycan-degrading enzymes. Another mechanism is the binding of the extracellularly immobilized FGFs to secreted FGF-binding proteins (BP) that serve as chaperones for FGFs. Wu et al. (7) isolated the first secreted FGF BP (HBp17, BP1) from the supernatants of human A431 carcinoma cells and found that BP1 can bind to FGF1 and FGF2 in a reversible manner. Also, BP1 can release FGFs from HSPGs, protect them from degradation, and present them to their high-affinity receptors in an active form (7–10)
Work from different laboratories has shown that BP1 interacts at least with FGF1, -2, -7, -10, and -22 (9, 11). Heparan sulfate and other heparinoids compete with BP1 binding to FGF2 (9), and BP1 directly interacts with perlecan, an HSPG present in the basement membrane (12). FGF binding to its transmembrane receptor requires HSPGs to trigger receptor oligomerization and signaling (reviewed in ref. 13), and BP1 can supplement this HSPG function in FGF signaling when HSPGs have been depleted from cells (14).
To date a majority of studies on BPs have focused on the molecular mechanism of action of the protein, the control of gene expression, and the function of BPs in malignancies (discussed in refs. 7, 10, 15, 16). None have addressed the possible contributions of this protein family during embryonic development. Because of the crucial roles of different FGFs in embryonic development (reviewed in refs. 1, 17), it is tempting to speculate that BPs could provide an additional mechanism to fine-tune the amplitude of FGF activity.
We used chick embryos as a model system and identified chBP1, an orthologue of the human BP1, as well as another family member, chBP2. In vitro assays suggest that the functional properties of the chBP2 protein are indistinguishable from those of the BP1 family. However, chBP2 expression was induced early during embryogenesis, after embryonic day (E) 5, whereas chBP1 induction too place mid-gestation, after E10. These different expression profiles suggest distinct contributions of these genes to physiologic development. Here we report the impact of the knockdown of the expression peaks on embryo survival as well as the specific phenotype observed after knockdown of chBP2 and the dysregulation of genes associated with FGF signaling.
Results and Discussion
Identification and Molecular Characterization of Chicken Orthologues of Binding Protein.
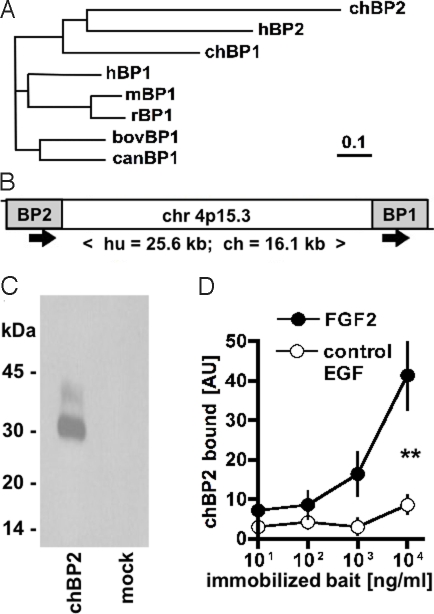
Database searches (TBLASTN) with the human BP1 amino acid sequence revealed 2 distinct ESTs that are predicted to code for homologous proteins in the chicken (Gallus gallus). We used this information to isolate the full-length coding sequences from chicken embryo mRNA. Based on amino acid sequence similarities (>50%) with the respective human proteins, the proteins were assigned to 2 distinct groups as chBP1 and chBP2 (Fig. 1A; supporting information (SI) Fig. S1). Both protein families maintain the positioning of 8 cysteine residues, and the overall protein composition matches with the conserved domain assigned to the FGF-BP gene family, PFAM06473. It also is noteworthy that the FGF-binding domain identified in the human BP1 protein (10) represents the most conserved portion of the proteins when comparing human and chick BPs (≈80% similarity; Fig. S1), supporting the notion of a similar function. Also, the organization of the genomic locus that contains BP1 and BP2 is conserved between human and Gallus gallus with a single exon coding for the respective protein and a short genomic distance of <26 kb between the BP1 and BP2 genes (Fig. 1B). We found shared synteny of BP1 and BP2 orthologues in the genomes of other vertebrates, including Zebrafish and Xenopus. Interestingly, the rodent genome seems to lack the BP2 locus, although we identified a distinct third orthologue in the family, BP3, with shared synteny of human and rodent orthologues (18).
Fig. 1.
Characterization of chBP2. (A) Phylogenetic tree of known BP proteins. (B) Organization of the human and chicken BP1 and BP2 genomic locus. The ORFs (gray) are contained on single exons. The direction of transcription and the distance between the ORFs is indicated. (C) Western blot for tagged chBP2 protein harvested from the supernatants of transfected SW-13 cells. (D) Binding of chBP2 to different concentrations of immobilized FGF2 relative to a negative control (epidermal growth factor, EGF). Bound chBP2 was quantitated by ELISA. **, P < 0.01. AU, absorption units.
In Vitro Function of chBP2.
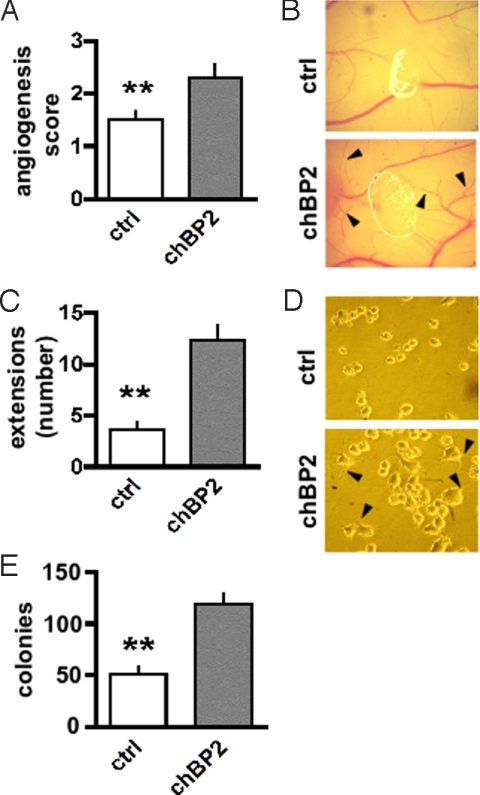
The BP1 proteins from different species (human, mouse, rat, cow) have been characterized extensively (see references in ref. 10), whereas human BP2 initially was described by Ogawa et al. (19) as 37-kDa killer-specific secretory protein (Ksp37) that is secreted by cytotoxic lymphocytes. Therefore, we evaluated chBP2 in a set of experiments similar to those that initially had revealed the mechanism of action and function of BP1. After expression of chBP2 by transient transfection, the protein is found in cell supernatants with an apparent molecular mass of 30 kDa (Fig. 1C). Also, we found that the secreted chBP2 protein binds to immobilized FGF2 (Fig. 1D). For functional assays, FGF2-positive SW-13 cells were transfected with a control or chBP2 expression vector. Expression of chBP2 increased the induction of angiogenesis by these cells when seeded onto a chick chorioallantoic membrane, induced filopodia-like cellular extensions in attached cells, and stimulated colony formation of the cells suspended in soft agar (Fig. 2 A–E). A comparison with chBP1 shows similar binding to immobilized FGF2 and induction of colony formation of transfected SW-13 cells (Fig. S2). Therefore, chBP2 shares primary structure and in vitro mechanism of action with the BP1 family of proteins (8, 9, 20, 21), and the 2 families seem to be functionally interchangeable.
Fig. 2.
Effects of chBP2 expression in FGF2-positive SW-13 cells. (A, B) Induction of angiogenesis in a chicken embryo chorioallantoic membrane (CAM) assay. Cells were placed on a collagen gel matrix on the CAM, and neoangiogenesis was scored. The arrowheads point to newly formed vessels. (C, D) Induction of filopodia-like cellular extensions in attached cells (38). Extensions were quantitated and are indicated by arrowheads. (E) Colony formation in soft agar. Colonies >100 μm were counted. Mock- or chBP2-transfected SW-13 cells were compared in these assays. **, P < 0.01.
Developmental Expression of chBP1 and chBP2.
mRNA expression during embryonic development was measured by quantitative RT-PCR (qRT-PCR) and in situ hybridization. chBP2 expression is induced early in gestation after E5, peaking at E7/8 (Fig. 3C). Northern blotting confirmed this profile of chBP2 mRNA regulation during chick development (data not shown). In contrast to chBP2, the expression of chBP1 is induced at a later time point, during mid-gestation, and peaks at E11/12 (Fig. 3C). In situ hybridization at their respective expression peaks showed that both chBP1 and chBP2 are highly expressed in the skin and intestine and at intermediate levels in the lungs; little or no expression was detectable in the heart and liver (Fig. 3 A and B; Table S1). The expression pattern and timing of chBP1 parallels that of murine BP1, which is induced during the last third of gestation and shows the highest levels in the embryonic gut and skin (22, 23).
Fig. 3.
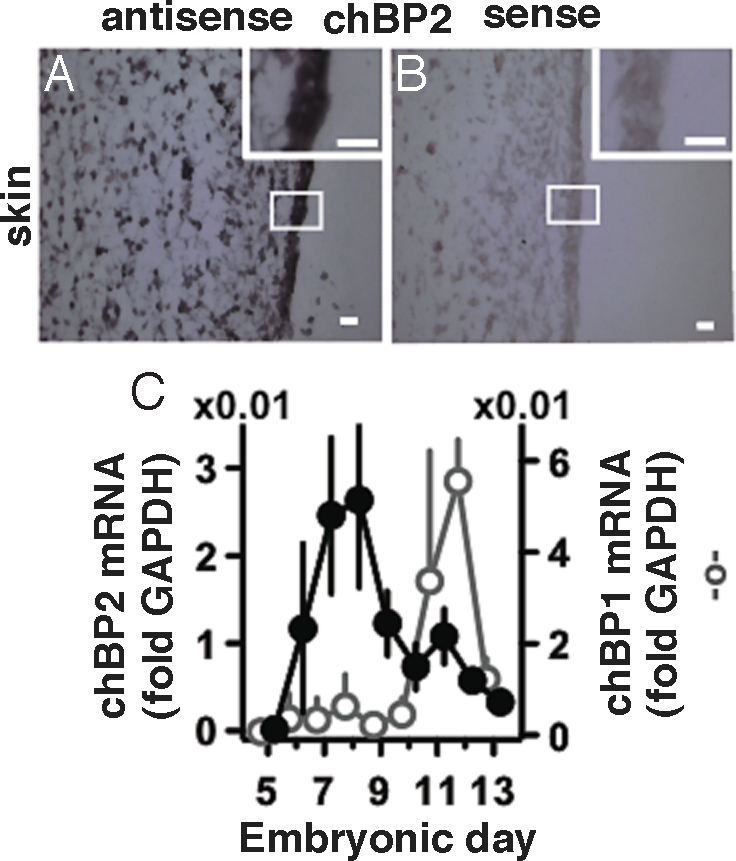
Expression of chBPs during embryogenesis. (A, B) chBP2 mRNA expression in skin at E7 by in situ hybridization. Table S1 shows results from different tissues. (Scale bar, 0.1 mm.) (Inset) Magnification of indicated area. (C) Time course of expression of chBP2 (@, Left Ordinate) and chBP1 (C, Right Ordinate). mRNA levels were determined by qRT-PCR and are expressed relative to GAPDH (n = 3 or 4 embryos per time point).
Timed Knockdown of Peak Expression of chBPs.
The rapid increase of expression of chBP2 during the first 7 days of chick embryonic development suggested a potentially crucial role during this phase of development. To test this hypothesis, we initiated siRNA-mediated knockdown of chBP2 expression starting on day E5. Day E3 embryos were removed from the eggshell, and their growth was monitored in tissue culture dishes on top of their yolk. This approach had been shown previously to provide easy access to the embryos for introduction of transgene expression vectors by allantoic sac injection and allows continuous monitoring for phenotypic effects (24). Here, we took advantage of this approach using RNAi for timed knockdown of the expression peaks of chBPs. siRNAs targeting either chBP1 or chBP2 were administered by injection into the allantoic sac at 12-h intervals starting 24 h before the initiation of expression of the respective chBP. For chBP2 targeting, embryos were microinjected with siRNA and harvested on E7 and E8. qRT-PCR showed a significant knockdown of chBP2 expression by either of 2 non-overlapping siRNAs (Fig. 4A). We reasoned that chBP1-targeted siRNAs could serve as an additional negative control in these experiments with chBP2, because chBP1 expression was at background levels during this early developmental phase (see Fig. 3C). It is noteworthy that after initiation of chBP1 gene expression in later-stage embryos, chBP1 expression is effectively knocked down by the chBP1-specific siRNAs. The respective functional and phenotypic results are discussed below (see Fig. 7).
Fig. 4.
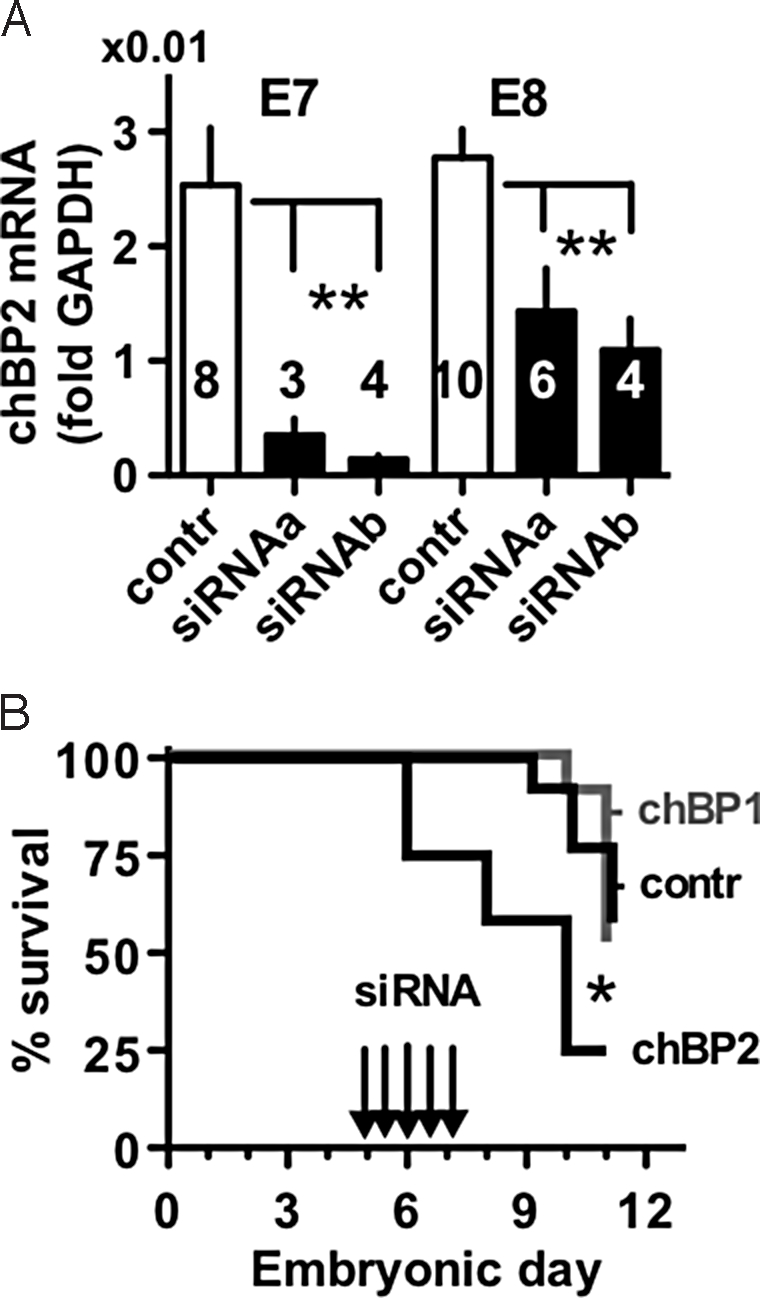
Effect of depletion of chBP2 on embryo viability. (A) siRNA knockdown of chBP2 expression in vivo as measured by qRT-PCR and given relative to GAPDH. The number of embryos in each group is indicated. A control siRNA and 2 distinct siRNAs targeted to chBP2 were used (see Materials and Methods). **, P < 0.01. (B) Survival of embryos injected with siRNAs to knock down the expression peak of chBP2. Embryos injected every 12 h (Arrows) with siRNAs specific for chBP2 (n = 12) showed a reduced survival rate compared with embryos treated with control siRNA (n = 13; P = 0.011) or with siRNA specific for chBP1 (n = 11; P = 0.0054). (Control siRNA vs. chBP1-specific siRNA treatment groups, P > 0.05.)
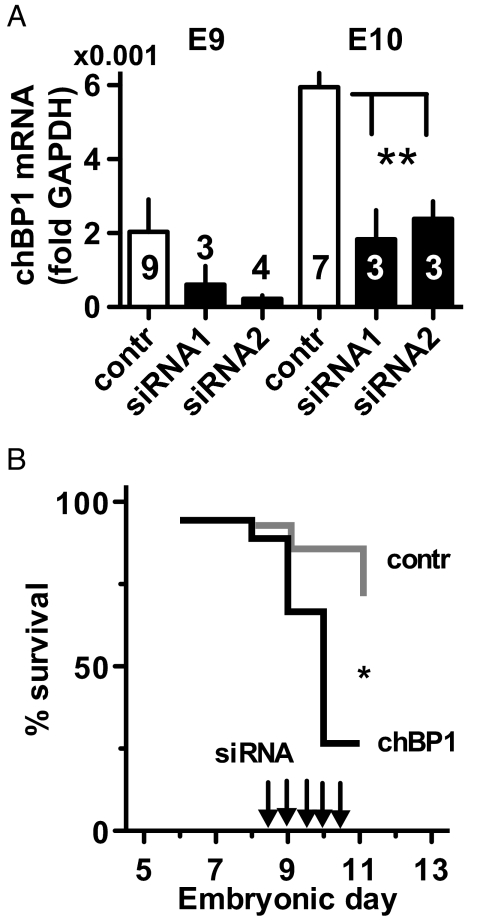
Fig. 7.
Effects of chBP1 knockdown. (A) Expression of chBP1 mRNA in chick embryos at E9 and E10 treated with control siRNA or with 2 different siRNAs targeted to chBP1 (see Materials and Methods). chBP1 mRNA was measured by qRT-PCR, and data are given relative to GAPDH. The number of embryos per group is indicated. **, P < 0.01. (B) Survival of chicks treated with chBP1-specific siRNA (n = 18) relative to control siRNA (n = 14). Arrows indicate siRNA injections. *, P = 0.017.
Effect of chBP2 Knockdown on Embryo Survival and Phenotype.
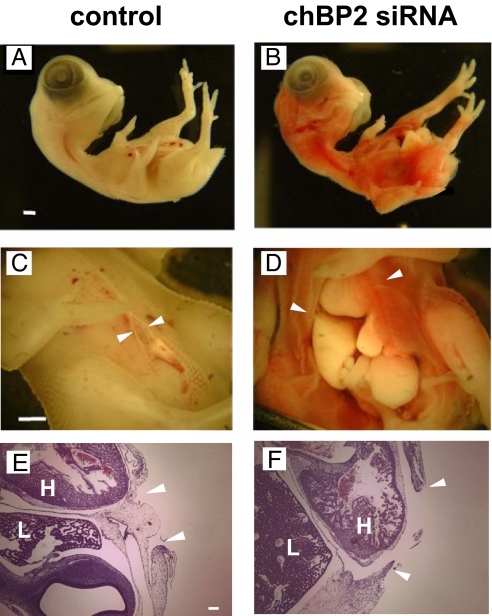
siRNA-mediated knockdown of chBP2 expression resulted in a significant increase in embryonic lethality compared with embryos treated with control siRNA or chBP1-targeted siRNA. One half of the embryos treated with chBP2 siRNA did not survive the first 3 days, whereas none were lost in the groups treated with control siRNA or chBP1 siRNA (Fig. 4B). There was no difference in the survival rates of the embryos treated with chBP1 or control siRNA, indicating that the chBP1 siRNAs had no effect in these early-stage embryos that had not yet initiated expression of chBP1 (Figs. 3C and 4B). The most obvious phenotype in the chBP2 knockdown embryos that survived the first few days of knockdown was a reduction in ventral body wall closure resulting in an open chest and abdominal wall (Fig. 5 D and F). These embryos also displayed a red hue in the skin because of vascular leakage (Fig. 5B) that was verified by extravasation of red cells in tissue sections (not shown). Finally, a subtle delay in feather bud formation was observed.
Fig. 5.
Ventral wall closure in chicks treated with chBP2-specific siRNA (Right) versus control siRNA (Left). Images (A–D) and H&E staining (E, F) of chick embryos at E7. H, heart; L, liver. The arrowheads indicate the edges of the ventral wall closure. (Scale bars, 1 mm in A–D and 0.1 mm in E and F).
Effect of chBP2 Knockdown on HoxB Expression.
Hox gene signaling is a master pathway that could be impacted and lead to the severe morphologic and lethal phenotype observed after the knockdown of chBP2. Hox genes control anterior–posterior axis development and are activated sequentially in response to signal gradients (reviewed in ref. 25). Although anterior–posterior signaling has been studied more extensively, Hox genes also play a role in appropriate dorsoventral patterning that can control ventral body wall closure; for example, overexpressing or externally adding FGFs to embryos can up-regulate posterior members of the Hox gene family (26–28). Although the control of Hox gene expression is related to specific and consecutive somites, the inability to demonstrate co-linearity with organ development (e.g., in the thoracic region) suggests the involvement of additional control mechanisms (29, 30).
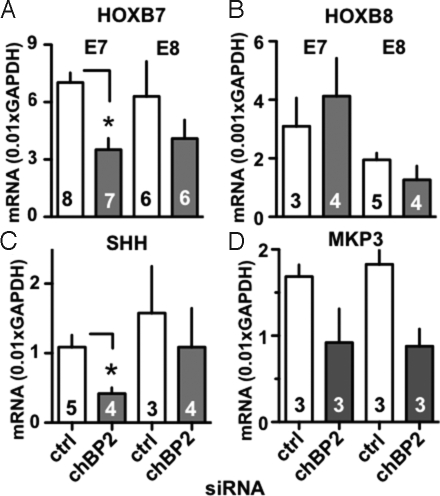
We focused on HoxB7 and HoxB8 because they are implicated in the control of the abdominal and thoracic segments that showed the most striking morphologic defects. Knockdown of chBP2 was associated with a statistically significant 51% reduction of HoxB7 expression in E7 embryos and was still apparent, although not statistically significant, at E8 (Fig. 6A). In contrast, HoxB8 expression was not altered after the chBP2 knockdown (Fig. 6B). It is noteworthy that the embryonic expression time courses of HoxB7 and HoxB8 do not follow the patterns found for either of the chBPs (not shown), and the knockdown of chBP1 did not affect HoxB7 or HoxB8 expression (not shown). Still, chBP2 seems to be required to maintain appropriate HoxB7 expression around E7, and this requirement may be sufficient to explain the morphologic defect observed.
Fig. 6.
Impact of chBP2 knockdown on the expression of HoxB7 (A), HoxB8 (B), sonic hedgehog (SHH, C) and MKP3 (D). mRNA expression was measured by qRT-PCR after treatment with control or chBP2-targeted siRNA. mRNA levels are given relative to GAPDH. *, P < 0.05.
Potential Contribution of chBP2 to Hedgehog Signaling.
Sonic hedgehog (Shh) controls the reach of signaling molecules crucial for spatial and temporal induction of new cell types and morphogenesis. A positive feedback loop between Shh and FGF signaling in developing limbs is well established with signal initiation from the specialized cells of the apical ectodermal ridge and signal maintenance by an FGF/Shh feedback loop (reviewed in ref. 31). Close interaction of FGFs and Shh signaling also was found in the development of other organ systems (32).
Thus, we measured Shh expression to assess whether FGF/chBP2 participate in a feedback loop during this developmental phase. Knockdown of chBP2 was associated with a statistically significant 65% decrease in Shh expression at E7 that was still apparent, although not statistically significant, at E8 (Fig. 6C). The effect of chBP2 depletion on Shh seems to be specific to this early developmental phase, because knockdown of the chBP1 expression peak at a later stage did not alter expression of Shh (not shown).
MAPK Phosphatase 3 Expression as an Indicator of FGF Activity.
The dual-specificity MAPK phosphatase 3 (MKP3, also known as DUSP6 or Pyst1) can negatively modulate FGF signaling. At the same time, MKP3 expression levels in the chicken embryo neuronal plate and limb buds are regulated by FGF and can thus reflect overall FGFR signaling (33, 34). This notion is supported further by a gene expression survey of mouse embryonic midbrain in which FGF signaling was disrupted by tissue-selective knockout of FGFR1; MKP3 was one of the response genes that was downregulated (35). In our studies, the chBP2 knock-down reduced MKP3 expression levels by ≈50% at E7/E8 (P <0.01 for chBP2 vs. control siRNA groups) (Fig. 6D), commensurate with reduced FGF activity in chick embryos at this developmental stage. It is of note, however, that knockdown of the later-stage chBP1 expression peak (discussed later) did have a detectable impact on MKP3 expression (not shown). A likely explanation for this difference from chBP2 is that the regulation of MKP3 expression by FGF signaling is superseded by other control mechanisms at other stages of development or growth.
Effect of chBP1 Knockdown on Embryo Viability and Phenotype.
Treatment of embryos with 2 chBP1-specific siRNAs reduced the expression of the gene by 65% and resulted in a significant, rapid onset of embryonic lethality within <3 days (Fig. 7). A careful inspection, dissection, and histologic analysis of the embryos did not reveal any visible organ malformation. Also, in contrast to the chBP2 knockdown, no impact on HoxB7, HoxB8, Shh, or MKP3 expression was seen in chicks treated with chBP1 siRNA (data not shown). Thus, the induction of expression of both chBP1 and chBP2 is necessary for embryo viability, although they govern distinct developmental phases. The reduced embryo viability after chBP1 knockdown probably results from subtle organ dysfunctions, because no obvious morphologic alteration was detectable.
Conclusions
Here we show that expression of chBP1 and chBP2 are required for embryonic development because knockdown of their respective expression peaks reduced embryonic viability. The ventral body wall defect observed after knockdown of chBP2 suggests a crucial role in the maintenance of FGF signaling during dorsoventral patterning. Indeed, FGFs signal upstream of ventral morphogens and can initiate dorsoventral patterning in early Zebrafish embryos (36). Reduced expression of HoxB7 and Shh after the knockdown of chBP2 is consistent with their participation in an FGF signaling feedback loop whose altered activity is indicated by reduced MKP3 expression levels.
Secreted FGF BPs originally were thought to function as “angiogenic switch” molecules that are induced during malignant progression (20). The present study reveals that BPs also function as crucial regulators of embryonic development and that chBP2 is involved in the control of HoxB7, Shh, and MKP3 expression, i.e., in the expression of genes whose pathways are intertwined with FGF signaling. We propose that FGF signaling during vertebrate development depends on the fine-tuning by secreted FGF BPs .
Materials and Methods
Identification of chBP2.
To identify a chicken homologue of human BP1, the human protein sequence (accession # NP_005121) was submitted to a TBLASTN search at the National Center for Biotechnology Information (NCBI)/National Institutes of Health. From this search we identified a chicken EST (accession #AJ398183) that coded for a protein fragment homologous to the C terminus of the human protein. The ORF of chBP2 then was identified using a 5′ RACE system (Life Technologies). For this identification, E17 chicken retina mRNA was reverse-transcribed using the primer 5′ CCA GCA GCT ACT TGC TTC AT 3′. A homopolymeric cytosine 3′ tail was added followed by an initial PCR performed with the primer pair 5′ GGC CAC GCG TCG ACT AGT ACG GGI IGG GII GGG IIG 3′ and 5′GGC ATG AGG GAG CTT TCT AAG T 3′. A nested PCR then was performed using the primer pair 5′GGC CAC GCG TCG ACT AGT AC 3′ and 5′ GGA AAG GAT GAC AGA GCA ATG G 3′. The fragment then was sequenced on both strands and was submitted to NCBI GenBank (accession number AY164487). The ORF of chBP1 (derived from XM_420773) was amplified from E10 chicken embryo cDNAs using the primer pair 5′CGA GCA AAA CAT GTG GATT 3′ and 5′GCA CTT TTT GTC TTG CAC CAT G 3′. The ORFs of chBP1 or chBP2 including a C-terminal V5 tag were inserted into pcDNA3 (Life Technologies), sequence verified, and expressed in HEK293 or in SW-13 cells as described previously for human BP1 (20). Tagged proteins in supernatants and in cell lysates were detected using a commercially available anti-V5 antibody (Invitrogen).
Cell Free Protein Binding Assays.
FGF2 (at 0.1–10 μg/mL in 0.2 mL of PBS) was immobilized as a bait by overnight incubation at 4 °C in enzyme immunoassay plates (Costar). Epidermal growth factor at the same concentrations served as a negative control. Nonspecific binding sites were blocked by incubating in 1% BSA in PBS for 1 h at room temperature. V5-tagged BP proteins were harvested from transiently transfected cells, added to wells coated with the different baits, and incubated at room temperature for 1 h. The wells then were washed 3 times with PBS-Tween. Bound chBP protein was quantitated by an anti-V5 HRP-conjugated antibody (Invitrogen), and subsequent development was assessed by ELISA (Pierce).
Chicken Embryo Growth.
E3 White Leghorn chicken embryos were obtained from CBT Farms. The studies did not involve the hatching of live birds and thus were exempt from Institutional Animal Care and Use Committee approval. Chicks were removed from their shells and transferred to 100-mm diameter, 20-mm deep tissue culture dishes together with substrate yolk and maintained at 38 °C at constant humidity. Blood flow visualized by stereomicroscopy was used to monitor embryo viability.
Chorioallantoic Membrane Angiogenesis Assay.
For the angiogenesis assays, a 1-mm3 gelatin sponge (Gelfoam, Upjohn) was placed at the periphery of the chorioallantoic membrane on day E4. Five million SW-13 cells (mock or chBP2 transfected) were added to each sponge. The chorioallantoic membranes were photographed 24 h later, and the degree of angiogenesis was scored in a blinded fashion based on a 4-point scoring system (9).
siRNA Targeting.
Two siRNAs obtained from Qiagen were used to target chBP1 (targeted sequences: AAG GCA TCT CCT AAA GGC AAA and AAA CTT CAA GAT ATA TTC AA) and chBP2 (targeted sequences: GGA AAC CTG CAG TGT TAC CTC and CTG CAT GTA CTG CAT TAT GTA). Luciferase-specific siRNA was used as a control (targeted sequence: AAC GTA CGC GGA ATA CTT CGA).
RNA Detection.
Chick embryos were harvested and homogenized in TRIzol (Invitrogen). Total RNA was extracted using chloroform, precipitated, and washed with ethanol. PolyA+ RNA was extracted from total RNA using Oligotex kit (Qiagen). Gene expression was quantitated using RT-PCR Taqman probes and the Platinum Quantitative RT-PCR Thermoscript One-Step system (Invitrogen) for chBP1, chBP2, HoxB7, HoxB8, MKP3, and Shh. SYBR green (Bio-Rad) was used for GAPDH detection. DNA probes of known concentration were used as additional internal standards. In situ hybridization was done as described earlier (37) using embryo tissue samples fixed in 10% buffered formalin and embedded in paraffin. Antisense and sense probes were generated by in vitro transcription with digoxigenin labeling using 2 separate 500-bp fragments specific for either chBP1 or chBP2 that had been cloned into the pGEM-T Easy Vector (Promega).
Data Analysis.
Prism 5 (GraphPad Inc.) software was used for comparisons of data sets by ANOVA or for survival analysis with p-values based on the Gehan-Breslow algorithm.
Supplementary Material
Acknowledgments.
We thank Dr. Charles B. Underhill, Georgetown University, for advice. Dr. Bernadette Kim helped with the in situ hybridization studies. This work was supported by Grant R01 CA71508 to A.W. from the National Cancer Institute, Bethesda, MD.
Footnotes
Conflict of interest: The authors declare no conflict of interest.
This article is a PNAS Direct Submission.
This article contains supporting information online at www.pnas.org/cgi/content/full/0810952106/DCSupplemental.
References
- 1.Itoh N, Ornitz DM. Functional evolutionary history of the mouse Fgf gene family. Dev Dyn. 2008;237:18–27. doi: 10.1002/dvdy.21388. [DOI] [PubMed] [Google Scholar]
- 2.Dailey L, Ambrosetti D, Mansukhani A, Basilico C. Mechanisms underlying differential responses to FGF signaling. Cytokine and Growth Factor Reviews. 2005;16:233–247. doi: 10.1016/j.cytogfr.2005.01.007. [DOI] [PubMed] [Google Scholar]
- 3.Eswarakumar VP, Lax I, Schlessinger J. Cellular signaling by fibroblast growth factor receptors. Cytokine and Growth Factor Reviews. 2005;16:139–149. doi: 10.1016/j.cytogfr.2005.01.001. [DOI] [PubMed] [Google Scholar]
- 4.Gurtner GC, Werner S, Barrandon Y, Longaker MT. Wound repair and regeneration. Nature. 2008;453:314–321. doi: 10.1038/nature07039. [DOI] [PubMed] [Google Scholar]
- 5.Presta M, et al. Fibroblast growth factor/fibroblast growth factor receptor system in angiogenesis. Cytokine and Growth Factor Reviews. 2005;16:159–178. doi: 10.1016/j.cytogfr.2005.01.004. [DOI] [PubMed] [Google Scholar]
- 6.Ornitz DM. FGFs, heparan sulfate and FGFRs: Complex interactions essential for development. BioEssays. 2000;22:108–112. doi: 10.1002/(SICI)1521-1878(200002)22:2<108::AID-BIES2>3.0.CO;2-M. [DOI] [PubMed] [Google Scholar]
- 7.Wu DQ, Kan MK, Sato GH, Okamoto T, Sato JD. Characterization and molecular cloning of a putative binding protein for heparin-binding growth factors. J Biol Chem. 1991;266:16778–16785. [PubMed] [Google Scholar]
- 8.Czubayko F, Smith RV, Chung HC, Wellstein A. Tumor growth and angiogenesis induced by a secreted binding protein for fibroblast growth factors. J Biol Chem. 1994;269:28243–28248. [PubMed] [Google Scholar]
- 9.Tassi E, et al. Enhancement of fibroblast growth factor (FGF) activity by an FGF-binding protein. J Biol Chem. 2001;276:40247–40253. doi: 10.1074/jbc.M104933200. [DOI] [PubMed] [Google Scholar]
- 10.Xie B, et al. Identification of the fibroblast growth factor (FGF)-interacting domain in a secreted FGF-binding protein by phage display. J Biol Chem. 2006;281:1137–1144. doi: 10.1074/jbc.M510754200. [DOI] [PubMed] [Google Scholar]
- 11.Beer HD, et al. The fibroblast growth factor binding protein is a novel interaction partner of FGF-7, FGF-10 and FGF-22 and regulates FGF activity: Implications for epithelial repair. Oncogene. 2005;24:5269–5277. doi: 10.1038/sj.onc.1208560. [DOI] [PubMed] [Google Scholar]
- 12.Mongiat M, et al. Fibroblast growth factor-binding protein is a novel partner for perlecan protein core. J Biol Chem. 2001;276:10263–10271. doi: 10.1074/jbc.M011493200. [DOI] [PubMed] [Google Scholar]
- 13.Pellegrini L. Role of heparan sulfate in fibroblast growth factor signalling: A structural view. Curr Opin Struct Biol. 2001;11:629–634. doi: 10.1016/s0959-440x(00)00258-x. [DOI] [PubMed] [Google Scholar]
- 14.Ray PE, Tassi E, Liu XH, Wellstein A. Role of fibroblast growth factor-binding protein in the pathogenesis of HIV-associated hemolytic uremic syndrome. Am J Physiol. 2006;290:R105–113. doi: 10.1152/ajpregu.00492.2005. [DOI] [PubMed] [Google Scholar]
- 15.Ray R, et al. Up-regulation of fibroblast growth factor-binding protein, by beta-catenin during colon carcinogenesis. Cancer Res. 2003;63:8085–8089. [PubMed] [Google Scholar]
- 16.Tassi E, et al. Expression of a fibroblast growth factor-binding protein during the development of adenocarcinoma of the pancreas and colon. Cancer Res. 2006;66:1191–1198. doi: 10.1158/0008-5472.CAN-05-2926. [DOI] [PubMed] [Google Scholar]
- 17.Powers CJ, McLeskey SW, Wellstein A. Fibroblast growth factors, their receptors and signaling. Endocrine-Related Cancer. 2000;7:165–197. doi: 10.1677/erc.0.0070165. [DOI] [PubMed] [Google Scholar]
- 18.Zhang W, et al. Effect of FGF binding protein-3 on vascular permeability. J Biol Chem. 2008;283:28329–28337. doi: 10.1074/jbc.M802144200. [DOI] [PMC free article] [PubMed] [Google Scholar]
- 19.Ogawa K, et al. A novel serum protein that is selectively produced by cytotoxic lymphocytes. J Immunol. 2001;166:6404–6412. doi: 10.4049/jimmunol.166.10.6404. [DOI] [PubMed] [Google Scholar]
- 20.Czubayko F, et al. A secreted FGF-binding protein can serve as the angiogenic switch in human cancer. Nature Med. 1997;3:1137–1140. doi: 10.1038/nm1097-1137. [DOI] [PubMed] [Google Scholar]
- 21.Tassi E, et al. Effects on neurite outgrowth and cell survival of a secreted fibroblast growth factor binding protein upregulated during spinal cord injury. Am J Physiol. 2007;293:R775–783. doi: 10.1152/ajpregu.00737.2006. [DOI] [PubMed] [Google Scholar]
- 22.Aigner A, Ray PE, Czubayko F, Wellstein A. Immunolocalization of an FGF-binding protein reveals a widespread expression pattern during different stages of mouse embryo development. Histochemistry and Cell Biology. 2002;117:1–11. doi: 10.1007/s00418-001-0360-4. [DOI] [PubMed] [Google Scholar]
- 23.Kurtz A, Darwiche N, Harris V, Wang HL, Wellstein A. Expression of a binding protein for FGF is associated with epithelial development and skin carcinogenesis. Oncogene. 1997;14:2671–2681. doi: 10.1038/sj.onc.1201117. [DOI] [PubMed] [Google Scholar]
- 24.McDonnell K, et al. Vascular leakage in chick embryos after expression of a secreted binding protein for fibroblast growth factors. Lab Invest. 2005;85:747–755. doi: 10.1038/labinvest.3700269. [DOI] [PubMed] [Google Scholar]
- 25.Pearson J, Lemons D, McGinnis W. Modulating Hox gene functions during animal body patterning. Nature Reviews Genetics. 2005;6:893–904. doi: 10.1038/nrg1726. [DOI] [PubMed] [Google Scholar]
- 26.Bel-Vialar S, Itasaki N, Krumlauf R. Initiating Hox gene expression: In the early chick neural tube differential sensitivity to FGF and RA signaling subdivides the HoxB genes in two distinct groups. Development (Cambridge UK) 2002;129:5103–5115. doi: 10.1242/dev.129.22.5103. [DOI] [PubMed] [Google Scholar]
- 27.Cho KW, De Robertis EM. Differential activation of Xenopus homeo box genes by mesoderm-inducing growth factors and retinoic acid. Genes Dev. 1990;4:1910–1916. doi: 10.1101/gad.4.11.1910. [DOI] [PubMed] [Google Scholar]
- 28.Pownall ME, Tucker AS, Slack JM, Isaacs HV. eFGF, Xcad3 and Hox genes form a molecular pathway that establishes the anteroposterior axis in Xenopus. Development (Cambridge UK) 1996;122:3881–3892. doi: 10.1242/dev.122.12.3881. [DOI] [PubMed] [Google Scholar]
- 29.McIntyre DC, et al. Hox patterning of the vertebrate rib cage. Development (Cambridge UK) 2007;134:2981–2989. doi: 10.1242/dev.007567. [DOI] [PubMed] [Google Scholar]
- 30.Wellik DM. Hox patterning of the vertebrate axial skeleton. Dev Dyn. 2007;236:2454–2463. doi: 10.1002/dvdy.21286. [DOI] [PubMed] [Google Scholar]
- 31.Ingham P, Placzek M. Orchestrating ontogenesis: Variations on a theme by sonic hedgehog. Nature Reviews Genetics. 2006;7:841–850. doi: 10.1038/nrg1969. [DOI] [PubMed] [Google Scholar]
- 32.Lavine KJ, Ornitz D. Fibroblast growth factors and hedgehogs: At the heart of the epicardial signaling center. Trends Genet. 2008;24:33–40. doi: 10.1016/j.tig.2007.10.007. [DOI] [PubMed] [Google Scholar]
- 33.Eblaghie MC, et al. Negative feedback regulation of FGF signaling levels by Pyst1/MKP3 in chick embryos. Curr Biol. 2003;13:1009–1018. doi: 10.1016/s0960-9822(03)00381-6. [DOI] [PubMed] [Google Scholar]
- 34.Mason I. Initiation to end point: The multiple roles of fibroblast growth factors in neural development. Nature Reviews Neuroscience. 2007;8:583–596. doi: 10.1038/nrn2189. [DOI] [PubMed] [Google Scholar]
- 35.Jukkola T, Lahti L, Naserke T, Wurst W, Partanen J. FGF regulated gene-expression and neuronal differentiation in the developing midbrain–hindbrain region. Dev Biol. 2006;297:141–157. doi: 10.1016/j.ydbio.2006.05.002. [DOI] [PubMed] [Google Scholar]
- 36.Fürthauer M, Van Celst J, Thisse C, Thisse B. FGF signalling controls the dorsoventral patterning of the zebrafish embryo. Development (Cambridge UK) 2004;131:2853–2864. doi: 10.1242/dev.01156. [DOI] [PubMed] [Google Scholar]
- 37.Henke RT, Eun Kim S, Maitra A, Paik S, Wellstein A. Expression analysis of mRNA in formalin-fixed, paraffin-embedded archival tissues by mRNA in situ hybridization. Methods. 2006;38:253–262. doi: 10.1016/j.ymeth.2005.11.013. [DOI] [PubMed] [Google Scholar]
- 38.Bertani N, Malatesta P, Volpi G, Sonego P, Perris R. Neurogenic potential of human mesenchymal stem cells revisited: Analysis by immunostaining, time-lapse video and microarray. J Cell Sci. 2005;118:3925–3936. doi: 10.1242/jcs.02511. [DOI] [PubMed] [Google Scholar]
Associated Data
This section collects any data citations, data availability statements, or supplementary materials included in this article.


