Abstract
The epidemics of obesity and metabolic disorders have well-recognized health and economic burdens. Pharmacologic treatments for these diseases remain unsatisfactory with respect to both efficacy and side-effect profiles. Here, we have identified a potential central role for T-type calcium channels in regulating body weight maintenance and sleep. Previously, it was shown that mice lacking CaV3.1 T-type calcium channels have altered sleep/wake activity. We found that these mice were also resistant to high-fat diet–induced weight gain, without changes in food intake or sensitivity to high-fat diet–induced disruptions of diurnal rhythm. Administration of a potent and selective antagonist of T-type calcium channels, TTA-A2, to normal-weight animals prior to the inactive phase acutely increased sleep, decreased body core temperature, and prevented high-fat diet–induced weight gain. Administration of TTA-A2 to obese rodents reduced body weight and fat mass while concurrently increasing lean muscle mass. These effects likely result from better alignment of diurnal feeding patterns with daily changes in circadian physiology and potentially an increased metabolic rate during the active phase. Together, these studies reveal what we believe to be a previously unknown role for T-type calcium channels in the regulation of sleep and weight maintenance and suggest the potential for a novel therapeutic approach to treating obesity.
Introduction
While the individual consequences of metabolic syndrome and sleep disorders are widely recognized, the interplay between sleep and metabolism is only recently gaining widespread attention (1–9). Preclinical and clinical studies support a bidirectional regulation between sleep and weight control, with some studies suggesting that diet affects sleep (10–13) and others indicating that sleep disruption may increase the risk for pathologic weight gain (8, 14–24). Elegant work by Van Cauter and others has linked sleep restriction in healthy human subjects to altered leptin and ghrelin hormone levels as well as appetite and food preference (16, 17, 19, 20, 23, 25). Decreased insulin sensitivity and glucose tolerance have also been shown to be affected after selective suppression of slow wave sleep in healthy young adults (22). This suggests that a strategic approach may be devised to address the treatment of metabolic syndrome and obesity through pharmacological treatment that alters sleep.
Vigilance state, as assessed by EEG recording of cortical neuron firing patterns, is associated with the activity of thalamocortical recurrent neuronal networks. T-type voltage-gated calcium channels are expressed in the thalamus, in the reticular nucleus, and in cortical regions (26) and provide the ability to switch neuronal firing patterns. The unique electrophysiological properties of T-type channels has provided an important regulatory role in translating resting membrane potential into thalamocortical firing patterns and controlling vigilance state (26–30). Recent genetic studies have confirmed that T-type calcium channels play a role in regulating vigilance. Mice with constitutive deletion of CaV3.1 T-type calcium channels (referred to herein as Cacna1g KO mice) display altered sleep/wake patterns, including fragmented sleep and a lack of thalamocortical burst firing, which is associated with reduced slow wave sleep (31–34).
Based on the demonstrated role of T-type calcium channels in thalamic regulation of vigilance, we hypothesized that these channels play a role in linking the central regulation of vigilance and body weight. We provide data from animals lacking CaV3.1 suggesting a role for these channels in maintaining body weight and data from pharmacological studies demonstrating that potent and selective T-type calcium channel antagonists reduced wakefulness, reduced diet-induced weight gain, and improved body composition, suggesting this ion channel class may provide a novel therapeutic target for the treatment of obesity.
Results
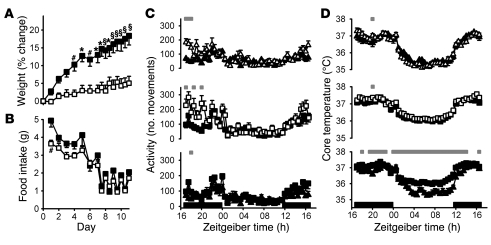
In humans, sleep restriction and reduced slow wave sleep have been linked to acute changes in circulating levels of metabolic hormones (20, 22). To investigate potential links between sleep and obesity in a constitutive genetic model of fragmented sleep, we studied the susceptibility of Cacna1g KO mice to diet-induced weight gain. Male KO animals and their WT littermates were placed on a high-fat diet (HFD) for 11 days. Body weights were comparable between WT and KO animals fed normal lab chow prior to starting the HFD, suggestive of normal baseline growth rates for KO animals compared with WT littermates. However, the KO animals gained significantly less weight than did their WT counterparts when fed the HFD (F1,13 = 15.02; P = 0.0019, 2-way ANOVA; Figure 1A).
Figure 1. Cacna1g KO mice resist HFD-induced weight gain.
(A and B) Percent change in body weight relative to the start of HFD (A) and HFD consumption (B), measured every 24 or 12 hours as described in Results, for WT (filled squares, n = 8) and KO (open squares, n = 7) male littermates. #P < 0.05, *P < 0.01, §P < 0.001, WT versus KO; 2-way ANOVA and Bonferroni post-test. (C and D) Average individual activity, as assessed by telemetry transmitter movements summed over 30-minute intervals (C), and average core temperature (D) of WT (filled symbols) and KO (open symbols) animals. Average values for animals fed normal chow (triangles) and HFD (squares) are plotted on a 24-hour Zeitgeiber time scale, with lights-off periods indicated by black bars along the x axis. Gray bars above denote significant 30-minute time points (P < 0.05, mixed linear effects model for repeated measures). Data are mean ± SEM.
Body composition was assessed by quantitative nuclear magnetic resonance imaging (qNMR) at the end of the study. WT animals had a significantly greater amount of fat than did their KO littermates (12.8 ± 1.0 g vs. 7.7 ± 1.0 g; P = 0.009, paired 2-tailed Student’s t test). Likewise, the percent fat was also greater in the WT animals (33.7% ± 1.2% vs. 23.8% ± 2.3%; P = 0.007, paired 2-tailed Student’s t test).
Weight gain is the result of greater caloric intake than caloric expenditure. HFD intake was monitored to address whether the reduced rate of weight gain could result from a decrease in food intake. For the first week, food intake was monitored every 24 hours, and then every 12 hours for the final 4 days. Food intake in the KO animals was lower overall for the study duration, with only 1 time point of significant difference (Figure 1B).
Because locomotion consumes calories, the mechanism of body weight and composition changes in these studies could be an indirect result of altered locomotor activity. To assess locomotor differences between KO and WT siblings, animal activity was monitored by telemetry implants. No overall significant differences were observed with either normal chow or HFD, although some points of significance were observed near the middle of the active period (Figure 1C). These data suggest that KO animals do not have increased gross locomotor activity that would underlie the observed resistance to body weight gain in the presence of a HFD over an 11-day period. Although locomotor activity and total energy expenditure are not equivalent, these data do not support the hypothesis that changes in locomotor activity could explain the observed differences in body mass.
To approximate an assessment of metabolic rate (35) and evaluate the HFD-induced disruption of circadian rhythm recently demonstrated (10), core body temperature was monitored in WT and KO animals fed both normal chow and HFD. The diurnal temperature rhythms of both WT and KO animals were similar prior to and after HFD feeding (Figure 1D). Furthermore, the WT and KO animals showed similar HFD-induced reduction in the amplitude of the rhythm. This suggests that the resistance to HFD-induced weight gain observed in these KO animals is not caused by reduced food intake, increased locomotor activity, or increased metabolic rate. Feed efficiency, calculated as mg body weight gain per kcal food intake, is another way to assess metabolic rate (36). When fed normal chow, WT and KO animals did not show significant differences in feed efficiency (4.6 ± 8.5 mg/kcal vs. 11.9 ± 9.5 mg/kcal; P = 0.58, unpaired 2-tailed Student’s t test). However, when fed HFD, WT animals had significantly higher feed efficiency than did their KO littermates (28.1 ± 2.9 mg/kcal vs. 8.8 ± 3.3 mg/kcal; P < 0.001, unpaired 2-tailed Student’s t test), which suggests that the Cacna1g deletion affects metabolic rate in a manner that is not reflected in core body temperature changes.
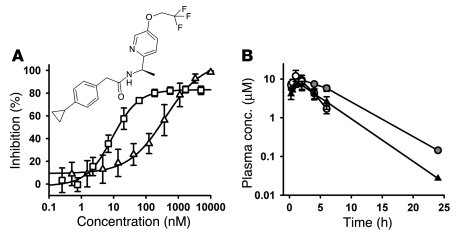
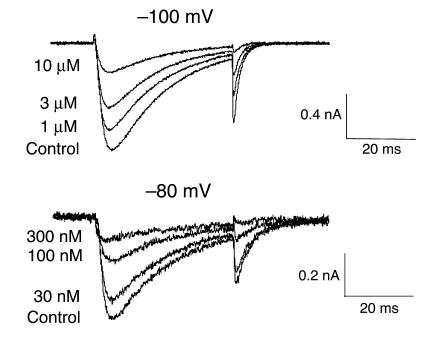
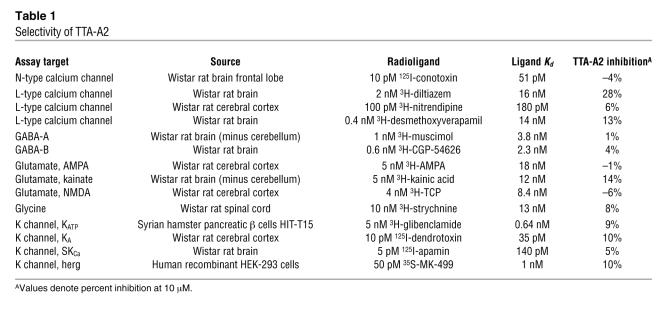
To our knowledge, no selective and potent T-type calcium channel antagonists previously existed to explore these findings pharmacologically. Therefore, we initiated a medicinal chemistry effort to distinguish potent, selective and pharmacokinetically favorable T-type calcium channel antagonists and identified T-type antagonist–A2 (TTA-A2). TTA-A2 is a selective, potent, and state-dependent T-type calcium channel antagonist, for which functional cell-based fluorescence assays (37) showed a potency of 9.4 ± 4.4 nM (n = 7) in the depolarized (inactivated) state and a potency of 384 ± 266 nM (n = 8) in hyperpolarized (closed) state (Figure 2A). Functional potency was confirmed in voltage clamp assays with –80-mV and –100-mV holding membrane potentials in HEK 293 cells heterologously expressing human CaV3.1, with IC50 of 89 and 4,100 nM, respectively (Figure 3). Selectivity for T-type calcium channels was assessed in 170 functional and binding assays, with results demonstrating no significant activities identified with an IC50 less than 10 μM (Table 1). Functional assessment of the selectivity of T-type compared with that of L-, N-, P/Q-, and R-type calcium channels showed IC50 greater than 10 μM for CaV1.2 (L-type), CaV2.1 (P/Q-type), and CaV2.2 (N-type) and 5.4 μM for CaV2.3 (R-type).
Figure 2. TTA-A2 structure, FLIPR potency, and rodent pharmacokinetics.
(A) Potency in hyperpolarized (open triangles) and depolarized (open squares) functional Ca2+ flux assays was determined as described previously (37). Potency is shown as the inflection point from a 4-parameter sigmoidal fit to the data. Data are mean ± SD (n = 7–8 replicates). P < 0.01 between groups, unpaired 2-tailed Student’s t test. Inset shows the structure of TTA-A2. (B) Exposure time course of TTA-A2 in rats (black triangles), lean mice (white circles), and obese mice (gray circles) after a 10-mg/kg dose by oral gavage. Data are mean ± SD (n = 3, except the 24-hour time points, for which 1 of 3 animals had detectable levels of TTA-A2).
Figure 3. TTA-A2 effects on CaV3.1 currents.
Representative whole-cell current traces were recorded from cells heterologously expressing CaV3.1 under control conditions and at steady state in the presence of increasing concentrations of TTA-A2. Currents were evoked by 0.1-Hz depolarizations (30 ms) to –20 mV from holding potentials of –100 or –80 mV.
Table 1 .
Selectivity of TTA-A2
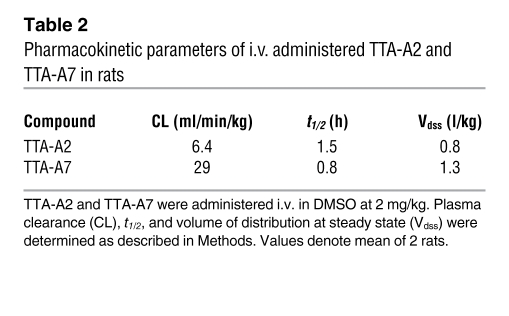
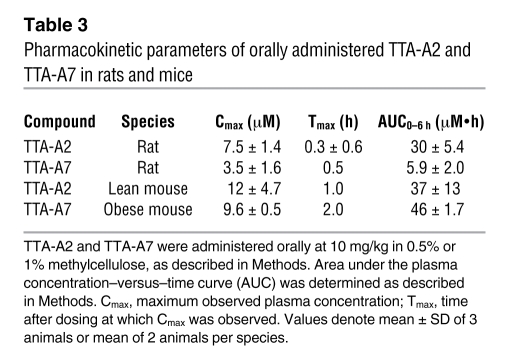
Evaluation of pharmacokinetic properties in rodents showed that TTA-A2 was rapidly absorbed after dosing by oral gavage and demonstrated a small volume of distribution (0.8 l/kg), low clearance (6.4 ml/min/kg), high protein binding (>99%), and a short t1/2 (1.5 h). TTA-A2 showed reasonable brain penetration in rats, yielding a brain/plasma concentration ratio of 0.27 and a CSF/plasma ratio of 0.005, which is consistent with the free fraction of 0.006 in rat plasma. The mean concentrations of TTA-A2 in plasma, brain, and CSF at 1 hour after dosing were 20.3 ± 3.7 μM, 5.2 ± 0.9 μM, and 0.1 ± 0.01 μM, respectively. These data confirm central exposure well in excess of the 9-nM potency determined by the depolarized state fluorometric imaging plate reader (FLIPR) assay. Additional pharmacokinetic data are summarized in Figure 2B and Tables 2 and 3.
Table 2 .
Pharmacokinetic parameters of i.v. administered TTA-A2 and TTA-A7 in rats
Table 3 .
Pharmacokinetic parameters of orally administered TTA-A2 and TTA-A7 in rats and mice
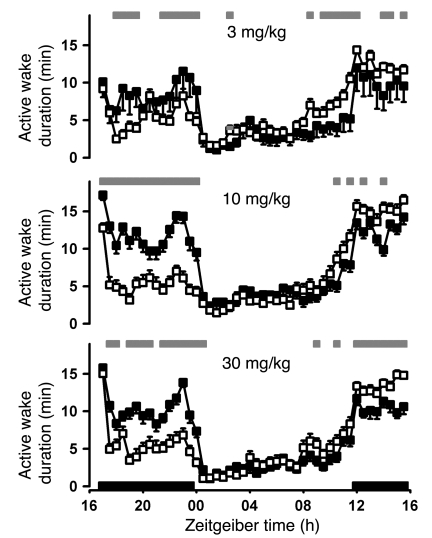
To determine whether pharmacological treatment with a T-type antagonist would mimic the fragmented vigilance state effects previously observed in KO animals (31–34), TTA-A2 was administered at 3, 10, and 30 mg/kg to rats by oral gavage during the wake phase. Animals appeared asleep, and active wake was concomitantly decreased, in a dose-dependent manner (Figure 4), consistent with altering thalamocortical neuronal activity and promoting sedation. Because 30 mg/kg TTA-A2 suppressed active wake in a manner similar to the 10-mg/kg dose, the latter dose was chosen for subsequent studies to decrease the opportunity for accumulation and off-target activities. To minimize the effect of reducing food intake by reducing wake, TTA-A2 was dosed prior to the sleep phase in all subsequent studies.
Figure 4. Effects of TTA-A2 on active wake duration when dosed during the active phase.
Sprague-Dawley rats (n = 8) were implanted with telemetry monitors and recorded in a 7-day crossover dosing paradigm and scored for sleep stage. TTA-A2 (open squares) or vehicle (0.5% methylcellulose, filled squares) was administered orally 5 hours after lights off. The results for all 8 animals were averaged by treatment over 7 administration nights, plotted on a 24-hour Zeitgeiber time scale, with lights-off periods indicated by black bars along the x axis, and compared by mixed ANOVA statistical analysis as described in Methods. Gray bars above denote significant differences (P < 0.05). Solid bars represent lights-off periods. Data are mean ± SEM.
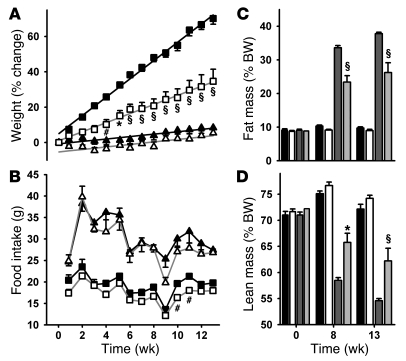
Because the effects of chronic deletion of Cacna1g alone have uncertain predictive value for transient pharmacological inhibition of all 3 T-type calcium channels, an extended dosing regimen was used to determine the pharmacological effects of dosing TTA-A2 prior to the sleep phase on body weight gain. A 13-week study was initiated in WT C57BL/6NTac mice, in which compound treatment and HFD were initiated simultaneously. Another cohort was maintained on normal chow and likewise separated into treatment groups. TTA-A2–treated animals fed HFD gained significantly less weight (F1,14 = 29.02; P < 0.0001, 2-way ANOVA) and had significantly lower body weight after 4 weeks of treatment (Figure 5A). The rate of weight gain was half that of vehicle-treated animals (vehicle, 1.25 g/wk; TTA-A2, 0.59 g/wk). When fed normal chow, body weight did not differ significantly between vehicle and TTA-A2–treated animals.
Figure 5. TTA-A2 slows diet-induced weight gain.
(A) WT C57BL/6NTac mice were acclimated to reverse lighting and handling, divided into 4 cohorts, and weighed weekly. The mice were treated with vehicle (filled symbols) or 10 mg/kg TTA-A2 (open symbols) and fed either normal chow (triangles) or HFD (squares). Lines are linear regression fits to the data from weeks 1–13 (r2 = 0.99 for each HFD fit). (B) Food intake was measured by weighing food weekly. (C and D) Body composition was measured by qNMR at 0, 8, and 13 weeks of treatment with vehicle or 10 mg/kg TTA-A2. Black bars, vehicle-treated normal chow group; white bars, TTA-A2–treated normal chow group; dark gray bars, vehicle-treated HFD group; light gray bars, TTA-A2–treated HFD group. #P < 0.05, *P < 0.01, §P < 0.001, TTA-A2 versus vehicle; 2-way ANOVA and Bonferroni post-test. Data are mean ± SEM (n = 7–8 per group).
The pharmacokinetics of TTA-A2 in lean mice indicated circulating compound levels would be undetectable in lean animals during the wake phase. Therefore, the change in body weights would not be expected to result from a direct effect of compound on food intake during the active period, where the majority of food intake occurs. In HFD-fed animals, weekly food intake was significantly reduced with TTA-A2 treatment compared with vehicle (F1,14 = 9.72; P = 0.001, 2-way ANOVA; Figure 5B), although differences were significant at only 2 individual time points. In contrast, animals fed normal chow did not show treatment-related differences in food intake. No signs of changes in health or survival of animals was observed after 13 weeks of sustained dosing, suggesting that changes in weight gain were not caused by unexpected toxicities.
To determine the nature of the differences in body weight, body composition was assessed by qNMR at weeks 0, 8, and 13. As shown in Figure 5, C and D, animals were comparable prior to the study. TTA-A2–treated animals fed normal chow had lower percent fat (F1,13 = 4.98; P = 0.044, 2-way ANOVA) and higher percent lean mass (F1,13 = 5.42; P = 0.037, 2-way ANOVA) relative to total body weight compared with vehicle treatment. In HFD-fed animals, percent fat mass was significantly lower (F1,14 = 16.87; P = 0.001, 2-way ANOVA), and percent lean mass significantly higher (F1,14 = 10.48; P = 0.006, 2-way ANOVA), in animals receiving TTA-A2 treatment compared with vehicle. These data show that a selective T-type antagonist improved body composition in animals fed a normal diet and impeded HFD-induced weight gain and body composition changes.
Previous work has shown that HFD disrupts diurnal behavior patterns primarily during the inactive period, in which both feeding and activity is abnormally increased (10). To better understand the effect of T-type antagonism on HFD-induced sleep phase feeding and locomotor activity, 10 mg/kg TTA-A2 was administered 30 minutes prior to lights on in animals that had been fed HFD for 2 weeks. Not only did TTA-A2 treatment at this time reverse weight gain, but it also decreased inactive phase feeding, locomotor activity, and core body temperature (Figure 6). Animals treated with TTA-A2 weighed less than their vehicle-treated counterparts (F1,13 = 6.8; P < 0.0001, 2-way ANOVA), and in fact exhibited weight loss under these conditions (Figure 6A).
Figure 6. TTA-A2 decreases inactive phase food intake and accentuates diurnal rhythms in core temperature and activity during HFD.
C57BL/6NTac mice fed HFD for 2 weeks with vehicle treatment were subsequently treated orally with either 10 mg/kg TTA-A2 (open symbols, n = 8) or vehicle (filled symbols, n = 8) 30 minutes prior to lights off. (A and B) Percent body weight change relative to day 0 of TTA-A2 treatment (A) and HFD consumption (B) were assessed every 12 hours at dark-to-light and light-to-dark transitions. #P < 0.05, *P < 0.01, §P < 0.001, TTA-A2 versus vehicle; 2-way ANOVA and Bonferroni post-test. (C and D) Continuous radio telemetry core temperature from individual animals was averaged (C), and beam break–derived locomotor activity was summed over 30-minute intervals (D). Core temperature and activity measures for all 7 days were averaged and plotted on a 24-hour Zeitgeiber time scale, with lights-off periods indicated by black bars along the x axis. Gray bars above denote significant 30-minute time points (P < 0.05, mixed linear effects model for repeated measures). Data are mean ± SEM.
These effects on body weight were associated with a general improvement in body composition, as determined by qNMR analysis. TTA-A2 treatment was associated with decreased fat mass (vehicle, 9.6 ± 0.7 g; TTA-A2, 5.8 ± 0.6 g; P = 0.009, paired 2-tailed Student’s t test) and percent fat composition (vehicle, 29.9% ± 1.6%; TTA-A2, 21.4% ± 1.8%; P = 0.009, paired 2-tailed Student’s t test).
Food intake, which was monitored at the end of the light and dark periods, indicated that TTA-A2 treatment primarily affected inactive phase feeding. HFD consumption was significantly lower overall in animals treated with TTA-A2 (F1,12 = 24.0; P < 0.0001, 2-way ANOVA), and differences reached significance at 3 individual time points. The bulk of this difference occurred during the inactive period, during which consumption was always lower, whereas active phase feeding was comparable between groups (Figure 6B).
TTA-A2 treatment was associated with reduced core temperature and locomotor activity during the inactive phase (Figure 6, C and D) and significant increases in active phase levels that were maintained until the subsequent dose of compound, illustrating a general reversal of diurnal behavioral disruptions induced by HFD. As anticipated by the observed reduction in body weight, treatment with TTA-A2 significantly reduced feed efficiency compared with vehicle-treated animals (–19.4 ± 2.5 mg/kcal vs. 11.0 ± 3.1 mg/kcal; P < 0.0001, unpaired 2-tailed Student’s t test).
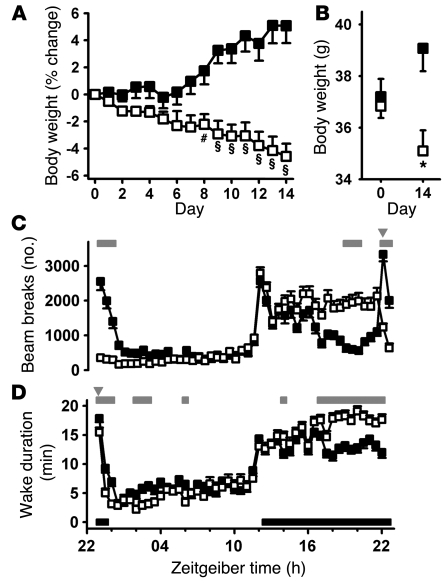
To evaluate the therapeutic potential of T-type antagonists as a treatment for preexisting obesity, diet-induced obese mice were divided into vehicle treatment and 10-mg/kg TTA-A2 treatment groups (n = 8 each). TTA-A2–treated animals showed a gradual weight reduction, achieving a 4.6% decrease by day 14, significantly different from vehicle-treated animals, which gradually gained body weight to a 5.1% increase at day 14 (F1,14 = 19.46, P = 0.0006, 2-way ANOVA; Figure 7A).
Figure 7. Effects of TTA-A2 on body weight, activity, and active wake.
(A) Diet-induced obese mice were weighed prior to daily dosing with vehicle (filled squares) or 10 mg/kg TTA-A2 (open squares). #P < 0.05, §P < 0.001 versus vehicle, 2-way ANOVA. (B) Starting and ending body weights from A. *P < 0.01, TTA-A2 versus vehicle; unpaired 2-tailed Student’s t test. (C) Locomotor activity of animals dosed with vehicle (filled squares) or 10 mg/kg TTA-A2 (open squares) in 30-minute epochs. Data are averaged such that each point represents the mean of 8 days from 8 animals (64 data points). Gray bars above denote significant differences (P < 0.05, Bonferroni post-hoc analysis). (D) Sprague-Dawley rats (n = 8) were implanted with telemetry monitors, recorded in a 7-day crossover dosing paradigm, and scored for sleep stage. Gray bars above denote significant differences (P < 0.05, mixed ANOVA analysis). Gray inverted triangles indicate time of dosing; solid bars represent lights-off periods. Data are mean ± SEM.
TTA-A2–mediated effects on active wakefulness and locomotor activity were monitored by tracking infrared beam breaks over the final 8 days of the study. A circadian pattern of activity was clearly present for both groups, with increased activity at lights off (Figure 7C). Although overall locomotor patterns were not significantly different between the groups (F1,14 = 0.11; P = 0.74, 2-way ANOVA), Bonferroni post-hoc analyses revealed time-dependent significant differences. The vehicle-treated group showed increased activity in response to handling and treatment, while the TTA-A2–treated group showed an acute decrease in activity, which fell below the level of activity during the entire light phase of vehicle-treated animals. This reduced level of activity in dosed animals dissipated with time, becoming indistinguishable from that of vehicle-treated animals at the end of the sleep phase. All animals responded to lights off with an abrupt increase in locomotor activity, indicating no impairment of the wake process in TTA-A2–treated animals. Within 4 hours of waking, beam break activity of vehicle-treated animals decreased to 15%–30% of that observed at wake. In contrast, TTA-A2–treated animals maintained a level of activity roughly 65% of that observed at wake until the next administration of compound.
Although locomotor activity has previously been correlated with EEG-based sleep/wake scoring in mice (38), this is an indirect measure of vigilance state. TTA-A2–induced effects on wake state were therefore confirmed in a second species, the Sprague-Dawley rat. Administration of TTA-A2 within 1 hour prior to the sleep phase decreased active wake acutely and increased wakefulness late in the active phase (Figure 7D), consistent with the locomotor effects seen in obese mice.
To explore whether the weight loss effect was the result of a molecule-specific off-target activity, a related T-type antagonist with comparable potency, selectivity, and physical and pharmacokinetic properties (Tables 2 and 3) was evaluated in diet-induced obese rats with comparable body composition (Figure 8A). TTA-A7 induced a dose-dependent early decrease in body weight that was followed by an increase that paralleled the control group (Figure 8B). In contrast, the positive control fenfluramine induced acute weight loss that was maintained throughout the study (Figure 8B). Although both treatments showed a comparable change in total body composition, including lean and fat mass, relative to vehicle (Figure 8C), a closer look at the changes in body composition components differentiated these treatments (Figure 8D). Both fenfluramine and TTA-A7 at 10 and 30 mg/kg resulted in similar percent reductions of fat mass relative to vehicle. Remarkably, however, TTA-A7 treatment resulted in a dose-dependent increase in lean mass, while changes caused by fenfluramine were no different from vehicle, which suggests that T-type antagonism has the capacity to improve body composition beyond that of the positive control.
Figure 8. Sleep-phase dosing of TTA-A7 reduces body weight and improves body composition in diet-induced obese rats.
(A) Total, lean, and fat mass, assessed by DexaScan, of dosing groups 14 days prior to dosing. Black bars, vehicle; white bars, 10 mg/kg TTA-A7; dark gray bars, 30 mg/kg TTA-A7; light gray bars, 3 mg/kg fenfluramine. (B) Time course of body weight changes in obese rats administered vehicle (10% Tween80, black squares), 10 mg/kg TTA-A7 (white squares), 30 mg/kg TTA-A7 (gray squares), or 3 mg/kg fenfluramine (diamonds). For clarity, significance is only indicated for the final day. (C) Body composition after 14 days of dosing. (D) Change in lean and fat mass, relative to 14 days prior to dosing. Data are mean ± SEM. #P < 0.05, *P < 0.01, §P < 0.001, TTA-A2 versus vehicle; †P < 0.05, TTA-A2 versus fenfluramine; Bonferroni post-hoc analysis.
Discussion
Obesity and metabolic syndrome have become global problems with far reaching health and economic impacts. While an increasing effort to better understand the biology of these diseases and identify new therapeutic opportunities has been productive (39–41), few effective pharmacological treatments exist. Previously reported data from humans that strongly suggest that sleep and metabolic activity share central regulatory networks and may modulate each other (1–5, 7–9, 14–25) provided the foundation for the therapeutic strategy described herein, which we believe to be novel. We demonstrated that dosing a T-type calcium channel antagonist prior to the sleep phase not only had the potential to prevent and even reverse HFD-induced weight gain, but also to improve body composition beyond that of a widely used appetite suppressant. These effects were likely the result of better alignment of diurnal feeding patterns with daily changes in circadian physiology and potentially an increase in the metabolic rate during the active phase.
A compound screening and optimization program resulted in a potent and selective T-type calcium channel antagonist that promoted sleep when dosed to rodents either during the wake period or prior to the sleep phase. This induction of sleep with pharmacological antagonism of T-type calcium channels was inconsistent with the anticipated results based on genetic deletion of Cacna1g, which resulted in increased wake (31–33). These differences between pharmacological antagonism and genetic KO may be caused by the antagonist inhibiting all subtypes of T-type channels, which have distinct distribution patterns in the CNS (26), differences in transient inhibition versus chronic deletion, or effects on neural network activity resulting from a persistent lack of channel function throughout development.
Interestingly, when the compound was dosed in the wake period, there was both a dose-dependent decrease in wake and a dose-dependent change in the wake-onset time, such that animals dosed with 3 mg/kg TTA-A2 showed increased wake in advance of lights off, while those dosed with 30 mg/kg showed minor changes in wake prior to lights off. In all cases where compound was dosed in the active phase, the following active phase showed increased wake until the next dose was received, suggesting saturation of sleep debt followed by a rebound increase in wake. Importantly, the same increase in wake was observed in animals dosed just prior to the sleep phase, further suggesting an enhancement to the restorative quality of the induced sleep. It is also noteworthy that animals dosed with 10 mg/kg TTA-A2 awoke appropriately at the onset of the subsequent dark period regardless of whether they were treated during the wake phase or just prior to the sleep phase. This occurred despite a greater increase in cumulative sleep duration when animals were dosed during the wake phase. This finding suggests that the ability to transition to the wake state in response to the circadian cue of a change in light conditions is not impaired by T-type calcium channel antagonism. The effects on locomotor activity after dosing prior to the sleep phase closely correlated with compound-induced changes in wake, consistent with previous reports that suggest locomotor activity can be a surrogate marker for sleep/wake states (38). Similarly, the effects on core body temperature were also consistent with acute increases in sleep and decreases in locomotion followed by increased activity throughout the active phase.
Substantial weight loss and improved body composition under HFD feeding conditions by acute T-type channel antagonism is also the likely result of realignment of diurnal activity and feeding patterns with circadian-controlled energy utilization mechanisms. Mice fed the HFD exhibited disrupted diurnal behavioral patterns characterized by increased feeding, activity, and core temperature measures during what would normally be the animals’ inactive phase (Figure 1 and ref. 10). Inappropriate energy intake during resting periods is thought to be a major contributor to metabolic syndrome and obesity; genetically obese animals are resistant to weight gain when feeding is restricted to the active phase (42), and Clock mutant animals, which also exhibit increased inactive phase feeding, are prone to significant weight gain and metabolic syndrome (43). These effects are thought to result from misalignment of feeding patterns with circadian oscillations in cholesterol and lipid metabolism, glycolysis, and gluconeogenesis (44). Indeed, night eating is thought to represent an independent risk for metabolic disease in humans (45). In our studies, TTA-A2 treatment just prior to the inactive phase essentially reversed HFD-induced behavioral alterations, including both a decrease in inactive phase activity, core body temperature, and feeding and, remarkably, an increase in active phase activity and temperature. Our results showing an improvement in body composition, even over that of a widely used appetite suppressant, further suggest that acute T-type antagonism is effective in realigning sleep/wake patterns toward optimally timed metabolic processes.
Not all the effects of T-type channel antagonism on HFD-induced weight gain can be attributed to the acute effects of the compound on sleep-phase activity and feeding. We also demonstrated that animals harboring a constitutive Cacna1g deletion were resistant to weight gain and exhibited improved body composition with HFD feeding, despite reports of sleep fragmentation effects and reduction of slow wave sleep (31–34). Cacna1g KO mice remained sensitive to HFD-induced changes in diurnal rhythm and food intake and were not hyperactive relative to their WT siblings. However, feed efficiency was clearly altered, which suggests that there were changes in energy utilization not detected by changes in core temperature. Although positive data indicating a clear mechanism for these changes has yet to be discovered, the present results suggest that TTAs can affect body weight and composition through acute effects on the sleep/wake cycle and a general effect on metabolism. In this regard, T-type antagonism may provide a unique weight loss mechanism.
The present work demonstrated TTA-dependent improvement in body composition in both mouse and rat models. This observation held for both growing and established diet-induced obesity conditions, where actual weight loss was observed in animals after HFD feeding for as little as 2 weeks. This improvement in body weight and composition is an important factor to consider when evaluating compound efficacy. The positive control fenfluramine reduced total body weight to a greater extent, but resulted in similar changes in fat mass. In contrast, treatment with a T-type antagonist dose-dependently increased lean mass to levels significantly different from those observed with fenfluramine. Body composition improvements may also be more relevant to the disease process than net weight reduction, including whether visceral or subcutaneous fat is selectively altered (46–50). Future efforts will be required to explore these changes in more detail.
The effects resulting from T-type antagonism during sleep on body weight and composition are particularly exciting because they suggest that sleep or circadian treatment approaches may benefit those who have difficulty losing weight or maintaining weight loss due to poor diet.
Methods
All animal procedures were approved by, and conducted according to the standards of, the Merck IACUC.
KO mice.
Cacna1g KO mice were obtained from Deltagen on a mixed C57B6/Sv129 background and bred in a heterozygous × heterozygous manner at Taconic. Male Cacna1g KO mice and WT littermates were placed on a HFD (D12492; Research Diets Inc.) for 11 days. Body weight was monitored weekly.
Core body temperature and ambulatory activity was monitored continuously in adult Cacna1g homozygote KO animals, WT littermates, and C57BL/6 mice through radio telemetry transmitters (TA10TA-F20; Data Sciences International) implanted peritoneally. Temperatures for individual subjects were averaged over a 30-minute interval, while activity, expressed as animal movements in the xy plane over the home cage radio receiver, was calculated as the sum of active movements over the 30-minute epoch. Plotted values for each group are averages of these 30-minute measures.
Compound identification and selectivity assessment.
The potency of TTA-A2 [2-(4-Cyclopropylphenyl)-N-((1R)-1-{5-[(2,2,2-trifluoroethyl)oxo]pyridin-2-yl}ethyl)acetamide] in depolarized and hyperpolarized FLIPR assay conditions was evaluated as described previously (37). We further tested TTA-A2 for functional potency against CACNA1C (CaV1.2, L-type), CACNA1A (CaV2.1, P/Q-type), CACNA1B (CaV2.2, N-type), and CACNA1E (CaV2.3, R-type) calcium channels as described previously (51). Finally, an array of 170 additional targets was screened in functional and binding assays at MDS Pharma Services according to standard protocols.
Electrophysiological verification.
Whole-cell patch-clamp recordings on HEK-293 cells expressing human CaV3.1 were performed at room temperature. Currents were recorded using either a HEKA EPC-9 or an Axopatch 200B patch-clamp amplifier. Data were stored on a personal computer equipped with acquisition software HEKA Pulse version 8.5 and analyzed using Pulsefit (HEKA), Igor Pro version 4.0, and GraphPad Prism version 4 (for EPC-9 amplifier) or using Clampex 9, Clampfit (Axon Instruments), and Origin 7.0 (for 200B amplifier). Patch pipettes were made from borosilicate glass tubing (Warner Instruments) and fire polished, and had a resistance of 1–5 MΩ. Series resistance was compensated, and the capacitance artifact was canceled using the amplifier’s built-in circuitry. Leak current was corrected with a P/4 protocol.
Patch pipettes contained 125 mM CsCl, 10 mM TEA-Cl, 10 mM HEPES, 8 mM NaCl, 0.06 mM CaCl2, 0.6 mM EGTA, 4 mM Mg-ATP, and 0.3 mM GTP, and pH was adjusted to 7.2 with CsOH. Extracellular solution was based on Tyrode solution and contained 130 mM NaCl, 4 mM KCl, 30 mM glucose, 20 mM HEPES, 1 mM MgCl2, and 2 mM CaCl2, and pH was adjusted to 7.4 with NaOH. Baseline T-type calcium currents were elicited by depolarizing to –20 mV for 70 milliseconds, cycling every 10 seconds from a holding potential of –100 mV and every 20 seconds from a holding potential of –80 mV.
Pharmacokinetics.
Male Sprague-Dawley rats underwent in-house jugular vein cannulation for sample collection. Rats received TTA-A2 and TTA-A7 at doses of 2 mg/kg in DMSO i.v. (n = 2) and 10 mg/kg in 1% methylcellulose by oral gavage (n = 3). Lean and obese male C57BL/6 mice were dosed by oral gavage with 10 mg/kg TTA-A2 in 0.5% methylcellulose (n = 3 per group). All animals were fasted overnight (~18 hours) prior to dosing, and feeding was resumed 4 hours after dosing. Blood was collected into tubes containing EDTA at the selected time points. Blood from rats was centrifuged to obtain plasma, while blood from mice was analyzed directly. Samples were stored frozen at –20°C prior to analysis.
Samples were processed using a protein precipitation method and analyzed by LC-MS/MS for TTA-A2 and TTA-A7 under a validated analytical protocol. Pharmacokinetic parameters were obtained by the following noncompartmental methods using Watson LIMS (version 6.2.0.02; PPS Inc.). The area under the plasma concentration–versus–time curve (AUC) was calculated using a trapezoidal method. Plasma clearance was obtained by dividing the dose by the AUC. Volume of distribution at steady state was calculated by multiplying the area under the first-moment curve by the dose and dividing by the squared AUC. The plasma t1/2 was determined from the slope of the terminal phase (ke) of the plasma concentration-time plot.
Central exposure of TTA-A2.
TTA-A2 was administered to male Sprague-Dawley rats (n = 3) by oral gavage at a dose of 10 mg/kg (10% Tween in 0.5% methylcellulose). Blood, brain, and CSF samples were collected upon sacrifice at 1 hour after dosing. The blood samples were collected into tubes containing EDTA, and plasma was prepared by centrifugation. Brain samples were homogenized in water (25% w/w) with a SPEX Certiprep 2000 Geno/Grinder. CSF samples were collected into tubes containing acetonitrile, and all samples were stored at –20°C until analysis. Samples were prepared for analysis using a protein precipitation method and analyzed by LC-MS/MS under a validated protocol.
Compound effects on active wake.
Sprague-Dawley rats (n = 8) were implanted with electrocorticogram (ECoG) and electromyogram (EMG) telemetry monitors and recorded in a 7-day crossover dosing paradigm and scored for sleep stage as previously described (52). At 5 hours after lights off, 3, 10, or 30 mg/kg TTA-A2 or vehicle (0.5% methylcellulose) was administered by oral gavage. The results for all 8 animals were averaged by treatment over 7 administration nights.
Growing diet-induced obesity.
WT C57BL/6NTac mice (Taconic) were acclimated to reverse lighting, handling, and dosing; divided into 4 cohorts; and weighed weekly. Animals received vehicle (10% Tween in 0.5% methylcellulose) or 10 mg/kg TTA-A2 and were fed either normal chow (7912; Harlan Teklad) or the high-carbohydrate HFD (D12492; Research Diets Inc.). Food intake was measured by weighing food weekly. Body composition was measured by qNMR at 0, 8, and 13 weeks of treatment. This study was performed at Taconic (Germantown, NY).
For studies in which core temperature and activity were monitored before and after the transition to HFD, body weight and food consumption was measured at 12-hour intervals at the dark-to-light and light-to-dark transitions. Chow spillage and hoarding was minimized by using food jars, providing access to food through lids perforated with 1.5-cm openings, and care was taken to include any displaced chow fragments in food weight measurements.
Established diet-induced obesity.
C57BL/6NTac diet-induced obese mice (Taconic) were maintained on HFD and acclimated to single housing, handling, and dosing prior to study initiation. Once body weights were stable (2 weeks of acclimation), animals were dosed with either vehicle (10% Tween in 0.5% methylcellulose) or 10 mg/kg TTA-A2 2 hours prior to lights on for 2 weeks with daily monitoring of body weights.
Diet-induced obese rats were obtained from Charles River, maintained on HFD, and acclimated to housing, handling, and dosing prior to study initiation. Study started with 135-day-old rats weighing 607 ± 7.6 g. Animals were dosed by oral gavage 1 hour prior to the sleep period with vehicle or with 10 or 30 mg/kg TTA-A7 daily for 14 days (n = 8 per group). An additional cohort of animals was dosed with 3 mg/kg fenfluramine as a positive control in this study. Body composition was evaluated by DexaScan (QDR 4500A; Hologic) 14 days prior to dosing and again at the end of the study.
Statistics.
Data are expressed as mean ± SD for in vitro and pharmacokinetic experiments and as mean ± SEM for in vivo pharmacodynamic studies. Endpoint comparisons with 2 groups of equal size were compared with a paired 2-tailed Student’s t test (Excel 2003; Microsoft). Where the group sizes differed, significant endpoint differences were determined using an unpaired 2-tailed Student’s t test (Prism, version 5; GraphPad). For parallel repeated-measures studies, 2-way ANOVA was used with Bonferroni post-hoc evaluations to determine the significance for individual time points (Prism; GraphPad). Active wake data were analyzed using linear mixed-effect models to account for repeated measures (R for Windows, version 2.8.1; http://www.r-project.org). A P value less than 0.05 was considered significant for all studies.
Acknowledgments
The authors thank Joline Bell, Sandra Petralia, Kevin Riley, Shannan Haun, Eric LaPier, Jay Brooker, Greg Casalaina, Stephanie Slingerland, Chuluun Sugarragchaa, Christine Cumo, Kim Buchanan, and Ian Longthon (Taconic) for performance of 13-week growing diet-induced obesity studies; Ge Dai and Owen McManus for CaV2.x assay support; Irene Nunes, Nicholas Hastings, and Xiao-ming Guan for subject matter expertise and experimental design support; and Matthew Baran for imaging support.
Footnotes
Conflict of interest: This work has been funded by Merck Research Laboratories. The authors are employees of Merck & Co. Inc. and potentially own stock and/or hold stock options in the company.
Nonstandard abbreviations used: FLIPR, fluorometric imaging plate reader; HFD, high-fat diet; qNMR, quantitative nuclear magnetic resonance imaging; TTA, T-type antagonist.
Citation for this article: J. Clin. Invest. 119:1659–1667 (2009). doi:10.1172/JCI36954
References
- 1.Aparecida Crispim C., et al. The influence of sleep and sleep loss upon food intake and metabolism. Nutr. Res. Rev. 2007;20:195–212. doi: 10.1017/S0954422407810651. [DOI] [PubMed] [Google Scholar]
- 2.D’Arrigo T. The secret life of Zs. A good night’s sleep can help you lose weight. Diabetes Forecast. 2007;60:24. [PubMed] [Google Scholar]
- 3.Laposky A.D., Bass J., Kohsaka A., Turek F.W. Sleep and circadian rhythms: Key components in the regulation of energy metabolism. FEBS Lett. 2008;582:142–151. doi: 10.1016/j.febslet.2007.06.079. [DOI] [PubMed] [Google Scholar]
- 4.Pearson H. Medicine: sleep it off. Nature. 2006;443:261–263. doi: 10.1038/443261a. [DOI] [PubMed] [Google Scholar]
- 5.Penev P.D. Sleep deprivation and energy metabolism: to sleep, perchance to eat? Curr. Opin. Endocrinol. Diabetes Obes. 2007;14:374–381. doi: 10.1097/MED.0b013e3282be9093. [DOI] [PubMed] [Google Scholar]
- 6.Ramsey K.M., Marcheva B., Kohsaka A., Bass J. The clockwork of metabolism. Annu. Rev. Nutr. 2007;27:219–240. doi: 10.1146/annurev.nutr.27.061406.093546. [DOI] [PubMed] [Google Scholar]
- 7.Taheri S. Sleep and metabolism: bringing pieces of the jigsaw together. Sleep Med. Rev. 2007;11:159–162. doi: 10.1016/j.smrv.2007.03.005. [DOI] [PubMed] [Google Scholar]
- 8.Van Cauter E., Polonsky K.S., Scheen A.J. Roles of circadian rhythmicity and sleep in human glucose regulation. Endocr. Rev. 1997;18:716–738. doi: 10.1210/er.18.5.716. [DOI] [PubMed] [Google Scholar]
- 9.Van Itallie T.B. Sleep and energy balance: Interactive homeostatic systems. Metabolism. 2006;55:S30–S35. doi: 10.1016/j.metabol.2006.07.010. [DOI] [PubMed] [Google Scholar]
- 10.Kohsaka A., et al. High-fat diet disrupts behavioral and molecular circadian rhythms in mice. Cell Metab. 2007;6:414–421. doi: 10.1016/j.cmet.2007.09.006. [DOI] [PubMed] [Google Scholar]
- 11.Shaaban S.Y., Ei-Sayed H.L., Nassar M.F., Asaad T., Gomaa S.M. Sleep-wake cycle disturbances in protein-energy malnutrition: effect of nutritional rehabilitation. East Mediterr. Health J. 2007;13:633–645. [PubMed] [Google Scholar]
- 12.Guesdon B., Minet-Ringet J., Tome D.G., Even P.C. Restriction-refeeding of calories and protein induces changes to slow wave and paradoxical sleep that parallel changes in body lipid and protein levels in rats. Behav. Brain Res. 2005;164:156–164. doi: 10.1016/j.bbr.2005.06.006. [DOI] [PubMed] [Google Scholar]
- 13.Jenkins J.B., et al. Sleep is increased in mice with obesity induced by high-fat food. Physiol. Behav. 2006;87:255–262. doi: 10.1016/j.physbeh.2005.10.010. [DOI] [PubMed] [Google Scholar]
- 14.Banks S., Dinges D.F. Behavioral and physiological consequences of sleep restriction. . J. Clin. Sleep Med. 2007;3:519–528. [PMC free article] [PubMed] [Google Scholar]
- 15.Bjorvatn B., et al. The association between sleep duration, body mass index and metabolic measures in the Hordaland Health Study. J. Sleep Res. 2007;16:66–76. doi: 10.1111/j.1365-2869.2007.00569.x. [DOI] [PubMed] [Google Scholar]
- 16.Knutson K.L., Spiegel K., Penev P., Van Cauter E. The metabolic consequences of sleep deprivation. Sleep Med. Rev. 2007;11:163–178. doi: 10.1016/j.smrv.2007.01.002. [DOI] [PMC free article] [PubMed] [Google Scholar]
- 17.Scheen A.J., Byrne M.M., Plat L., Leproult R., Van Cauter E. Relationships between sleep quality and glucose regulation in normal humans. Am. J. Physiol. 1996;271:E261–E270. doi: 10.1152/ajpendo.1996.271.2.E261. [DOI] [PubMed] [Google Scholar]
- 18.Schmid S.M., et al. Sleep loss alters basal metabolic hormone secretion and modulates the dynamic counterregulatory response to hypoglycemia. J. Clin. Endocrinol. Metab. 2007;92:3044–3051. doi: 10.1210/jc.2006-2788. [DOI] [PubMed] [Google Scholar]
- 19.Spiegel K., Leproult R., Van Cauter E. Impact of sleep debt on metabolic and endocrine function. Lancet. 1999;354:1435–1439. doi: 10.1016/S0140-6736(99)01376-8. [DOI] [PubMed] [Google Scholar]
- 20.Spiegel K., Tasali E., Penev P., Van Cauter E. Brief communication: Sleep curtailment in healthy young men is associated with decreased leptin levels, elevated ghrelin levels, and increased hunger and appetite. Ann. Intern. Med. 2004;141:846–850. doi: 10.1001/archinte.141.7.846. [DOI] [PubMed] [Google Scholar]
- 21.Spiegel K., Knutson K., Leproult R., Tasali E., Van Cauter E. Sleep loss: a novel risk factor for insulin resistance and Type 2 diabetes. J. Appl. Physiol. 2005;99:2008–2019. doi: 10.1152/japplphysiol.00660.2005. [DOI] [PubMed] [Google Scholar]
- 22.Tasali E., Leproult R., Ehrmann D.A., Van Cauter E. Slow-wave sleep and the risk of type 2 diabetes in humans. Proc. Natl. Acad. Sci. U. S. A. 2008;105:1044–1049. doi: 10.1073/pnas.0706446105. [DOI] [PMC free article] [PubMed] [Google Scholar]
- 23.Van Cauter E., et al. Impact of sleep and sleep loss on neuroendocrine and metabolic function. Horm. Res. 2007;67(Suppl. 1):2–9. doi: 10.1159/000097543. [DOI] [PubMed] [Google Scholar]
- 24.Verhulst S.L., et al. Sleep duration and metabolic dysregulation in overweight children and adolescents. Arch. Dis. Child. 2008;93:89–90. doi: 10.1136/adc.2007.124768. [DOI] [PubMed] [Google Scholar]
- 25.Spiegel K., et al. Leptin levels are dependent on sleep duration: relationships with sympathovagal balance, carbohydrate regulation, cortisol, and thyrotropin. J. Clin. Endocrinol. Metab. 2004;89:5762–5771. doi: 10.1210/jc.2004-1003. [DOI] [PubMed] [Google Scholar]
- 26.Talley E.M., et al. Differential distribution of three members of a gene family encoding low voltage-activated (T-type) calcium channels. J. Neurosci. 1999;19:1895–1911. doi: 10.1523/JNEUROSCI.19-06-01895.1999. [DOI] [PMC free article] [PubMed] [Google Scholar]
- 27.Contreras D. The role of T-channels in the generation of thalamocortical rhythms. CNS Neurol. Disord. Drug Targets. 2006;5:571–585. doi: 10.2174/187152706779025526. [DOI] [PubMed] [Google Scholar]
- 28.Llinas R.R., Steriade M. Bursting of thalamic neurons and states of vigilance. J. Neurophysiol. 2006;95:3297–3308. doi: 10.1152/jn.00166.2006. [DOI] [PubMed] [Google Scholar]
- 29.Steriade M. The corticothalamic system in sleep. Front. Biosci. 2003;8:d878–d899. doi: 10.2741/1043. [DOI] [PubMed] [Google Scholar]
- 30.Steriade M., McCormick D.A., Sejnowski T.J. Thalamocortical oscillations in the sleeping and aroused brain. Science. 1993;262:679–685. doi: 10.1126/science.8235588. [DOI] [PubMed] [Google Scholar]
- 31.Kim D., et al. Lack of the burst firing of thalamocortical relay neurons and resistance to absence seizures in mice lacking alpha(1G) T-type Ca(2+) channels. Neuron. 2001;31:35–45. doi: 10.1016/S0896-6273(01)00343-9. [DOI] [PubMed] [Google Scholar]
- 32.Lee J., Kim D., Shin H.S. Lack of delta waves and sleep disturbances during non-rapid eye movement sleep in mice lacking alpha1G-subunit of T-type calcium channels. Proc. Natl. Acad. Sci. U. S. A. 2004;101:18195–18199. doi: 10.1073/pnas.0408089101. [DOI] [PMC free article] [PubMed] [Google Scholar]
- 33.Lee J., Shin H.S. T-type calcium channels and thalamocortical rhythms in sleep: a perspective from studies of T-type calcium channel knockout mice. CNS Neurol. Disord. Drug Targets. 2007;6:63–69. doi: 10.2174/187152707779940817. [DOI] [PubMed] [Google Scholar]
- 34.Anderson M.P., et al. Thalamic CaV3.1 T-type Ca2+ channel plays a crucial role in stabilizing sleep. Proc. Natl. Acad. Sci. U. S. A. 2005;102:1743–1748. doi: 10.1073/pnas.0409644102. [DOI] [PMC free article] [PubMed] [Google Scholar]
- 35.Nagashima K., et al. Effects of fasting on thermoregulatory processes and the daily oscillations in rats. Am. J. Physiol. Regul. Integr. Comp. Physiol. 2003;284:R1486–R1493. doi: 10.1152/ajpregu.00515.2002. [DOI] [PubMed] [Google Scholar]
- 36.Shearman L.P., et al. Chronic MCH-1 receptor modulation alters appetite, body weight and adiposity in rats. Eur. J. Pharmacol. 2003;475:37–47. doi: 10.1016/S0014-2999(03)02146-0. [DOI] [PubMed] [Google Scholar]
- 37.Shipe W.D., et al. Design, synthesis, and evaluation of a novel 4-aminomethyl-4-fluoropiperidine as a T-type Ca(2+) channel antagonist. . J. Med. Chem. 2008;51:3692–3695. doi: 10.1021/jm800419w. [DOI] [PubMed] [Google Scholar]
- 38.Pack A.I., et al. Novel method for high-throughput phenotyping of sleep in mice. Physiol. Genomics. 2007;28:232–238. doi: 10.1152/physiolgenomics.00139.2006. [DOI] [PubMed] [Google Scholar]
- 39.Zhu J., Zhang B., Schadt E.E. A systems biology approach to drug discovery. Adv. Genet. 2008;60:603–635. doi: 10.1016/S0065-2660(07)00421-X. [DOI] [PubMed] [Google Scholar]
- 40.Chen Y., et al. Variations in DNA elucidate molecular networks that cause disease. Nature. 2008;452:429–435. doi: 10.1038/nature06757. [DOI] [PMC free article] [PubMed] [Google Scholar]
- 41.Lum P.Y., et al. Elucidating the murine brain transcriptional network in a segregating mouse population to identify core functional modules for obesity and diabetes. J. Neurochem. 2006;97(Suppl. 1):50–62. doi: 10.1111/j.1471-4159.2006.03661.x. [DOI] [PubMed] [Google Scholar]
- 42.Masaki T., et al. Involvement of hypothalamic histamine H1 receptor in the regulation of feeding rhythm and obesity. Diabetes. 2004;53:2250–2260. doi: 10.2337/diabetes.53.9.2250. [DOI] [PubMed] [Google Scholar]
- 43.Turek F.W., et al. Obesity and metabolic syndrome in circadian Clock mutant mice. Science. 2005;308:1043–1045. doi: 10.1126/science.1108750. [DOI] [PMC free article] [PubMed] [Google Scholar]
- 44.Green C.B., Takahashi J.S., Bass J. The meter of metabolism. Cell. 2008;134:728–742. doi: 10.1016/j.cell.2008.08.022. [DOI] [PMC free article] [PubMed] [Google Scholar]
- 45.Allison K.C., et al. Binge eating disorder and night eating syndrome in adults with type 2 diabetes. Obesity (Silver Spring). 2007;15:1287–1293. doi: 10.1038/oby.2007.150. [DOI] [PMC free article] [PubMed] [Google Scholar]
- 46.Blackburn G.L., Waltman B.A. Pharmacotherapy to reduce visceral fat. Clin. Cornerstone. 2005;7:52–60. doi: 10.1016/S1098-3597(05)80068-7. [DOI] [PubMed] [Google Scholar]
- 47.Hamdy O., Porramatikul S., Al Ozairi E. Metabolic obesity: the paradox between visceral and subcutaneous fat. Curr. Diabetes Rev. 2006;2:367–373. doi: 10.2174/1573399810602040367. [DOI] [PubMed] [Google Scholar]
- 48.Iannucci C.V., Capoccia D., Calabria M., Leonetti F. Metabolic syndrome and adipose tissue: new clinical aspects and therapeutic targets. Curr. Pharm. Des. 2007;13:2148–2168. doi: 10.2174/138161207781039571. [DOI] [PubMed] [Google Scholar]
- 49.Rodriguez A., Catalan V., Gomez-Ambrosi J., Fruhbeck G. Visceral and subcutaneous adiposity: are both potential therapeutic targets for tackling the metabolic syndrome? Curr. Pharm. Des. 2007;13:2169–2175. doi: 10.2174/138161207781039599. [DOI] [PubMed] [Google Scholar]
- 50.Thalmann S., Meier C.A. Local adipose tissue depots as cardiovascular risk factors. Cardiovasc. Res. 2007;75:690–701. doi: 10.1016/j.cardiores.2007.03.008. [DOI] [PubMed] [Google Scholar]
- 51.Dai G., et al. A high-throughput assay for evaluating state dependence and subtype selectivity of CaV2 calcium channel inhibitors. Assay Drug Dev. Technol. 2008;6:195–212. doi: 10.1089/adt.2008.136. [DOI] [PubMed] [Google Scholar]
- 52.Renger J.J., Dunn S.L., Motzel S.L., Johnson C., Koblan K.S. Sub-chronic administration of zolpidem affects modifications to rat sleep architecture. Brain Res. 2004;1010:45–54. doi: 10.1016/j.brainres.2004.02.067. [DOI] [PubMed] [Google Scholar]


