

Abstract
Background
Controlling enzyme activity by ligand binding to a regulatory domain of choice may have many applications e.g. as biosensors and as tools in regulating cellular functions. However, until now only a small number of ligand-binding domains have been successfully linked to enzyme activity. G protein-coupled receptors (GPCR) are capable of recognizing an extraordinary structural variety of extracellular signals including inorganic and organic molecules. Ligand binding to GPCR results in conformational changes involving the transmembrane helices. Here, we assessed whether ligand-induced conformational changes within the GPCR helix bundle can be utilized to control the activity of an integrated enzyme.
Results
As a proof of principle, we inserted the luciferase amino acid sequence into the third intracellular loop of the M3 muscarinic acetylcholine receptor. This fusion protein retained both receptor and enzyme function. Receptor blockers slightly but significantly reduced enzyme activity. By successive deletion mutagenesis the enzyme activity was optimally coupled to ligand-induced conformational helix movements.
Conclusion
Our results demonstrate that in engineered GPCR-enzyme chimeras, intracellular enzyme activity can be directly controlled by a GPCR serving as the extracellular ligand-binding domain.
Background
Synthetic protein biosensors are typically designed by fusing a target-binding domain to an easily assayed reporter protein. The ligand-binding domain is often derived from a specific receptor protein. Most biosensors are complementation systems where enzyme or fluorophore activity is reconstituted from non-functional domains secondary to receptor dimerization or conformational changes upon ligand binding [1,2]. However, the repertoires of both, well characterized ligand-binding and reporter domains that are suitable for the design of complementation systems are rather small. A modular system that allows arbitrary combination of ligand-binding and reporter domains would thus be most desirable. There are a few examples of properly constructed receptor-enzyme chimeras which allow for the transduction of ligand-induced conformational changes within the receptor to the reporter protein and allosteric modulation of its properties [3-5]. Coupling of ligand-induced conformational changes to reporter protein function appears to be the general bottleneck in designing such biosensors.
Among the different families of transmembrane receptors, G protein-coupled receptors (GPCR) form the largest receptor superfamily comprising over 1000 members within several vertebrate genomes [6-8]. Signals as multiform as light, small molecules including ions, amines, amino acids, peptides, lipids, sugars, as well as large proteins are recognized by receptors of this class [9,10]. Upon agonist binding to the extracellular portion of GPCR, conformational changes of the transmembrane helix (TMH) bundle and intracellular loop (ICL) portions lead to G-protein activation [11-16]. Conformational changes of the TMH bundle are not only observed after agonist binding but also after binding of inverse agonists that do not result in G-protein activation [17-19]. In addition, GPCR can be modified by site-directed mutagenesis to respond to biologically inert compounds instead of their native agonists [20,21]. The combination of these properties favours GPCR as ideal ligand-binding modules in hybrid biosensors.
In a number of studies, enzymes, such as luciferases, galactosidase, alkaline phosphatase and peroxidase, as well as fluorescent proteins (e.g. YFP) have been integrated into GPCR. In these GPCR fusion proteins, the enzyme or fluorescence activities were used as reporter assay to monitor intracellular receptor trafficking [22,23] and, in fluorescence and bioluminescence resonance energy transfer (FRET/BRET) approaches, to monitor GPCR-protein interactions [24-27]. Recently, the activity of ion channels coupled to GPCR was modulated upon ligand binding, demonstrating that GPCR are suitable binding domains for biosensors [28].
Here, we report the allosteric modulation of enzyme activity upon ligand binding to a GPCR-enzyme chimera. Using the M3 muscarinic acetylcholine receptor (M3R) and luciferase as model proteins, we provide a proof of concept that through rigid-body movement of the TMH bundle, extracellular signals may be transduced onto an enzyme that is integrated into the cytosolic portion of a GPCR, thus changing enzyme activity.
Results and discussion
Functional integration of luciferase into the M3R
To generate a biosensor in which enzyme activity is allosterically controlled by a binding domain of a GPCR, we replaced a 195-amino acid segment of the third ICL (ICL3) of M3R (amino acid positions 274–469) with the sequence of luciferase from Photinus pyralis (referred to as M3R-luci, Figures 1 and 2). Previous studies in mammalian expression systems have shown that in M3R, the removal of the central part of ICL3 has no significant effect on receptor function [29-31]. As shown in Figure 3 and summarized in Table 1, M3R-luci expressed in COS-7 cells was delivered to the cell surface and displayed both luciferase activity (Figure 3A) and carbachol (CCh)-induced inositol phosphate (IP) formation (Figure 3B). However, enzyme activity was not influenced by application of the agonist CCh but we noted a significant reduction (15%, p < 0.001) in luciferase activity in the presence of the inverse agonist atropine (Figure 3A, Table 1). The effect of atropine was not found when luciferase was inserted into the second intracellular loop (ICL2) or fused to a truncated M3R (constructs #21 and #22, Figure 2, Table 1) and in several other controls (luciferase alone, V2 vasopressin receptor (V2R)) [see Additional file 1] [see Additional file 2] [see Additional file 3].
Figure 1.

Schematic presentation of the M3R-luciferase fusion construct. Outline of M3R-luci with detailed illustration of ICL3 containing the luciferase sequence. Details of all fusion constructs are given in Figure 2.
Figure 2.
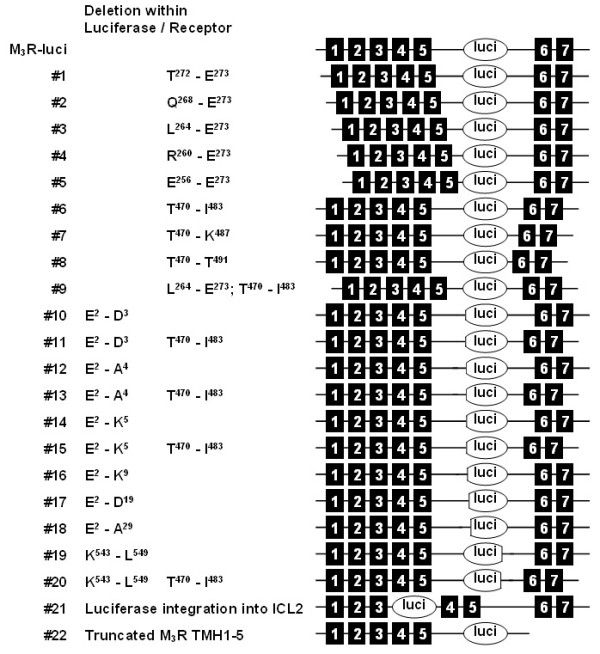
Fusion constructs and deletion mutants used in the study. Mutants were generated by successive deletion of N- and C-terminal domains of the enzyme and loop portions of the receptor (deleted portions are given). For control experiments luciferase was also integrated into ICL2 (#21) and fused to a truncated M3R only consisting of TMH1-5 (#22).
Figure 3.

Functional integration of luciferase into the M3 muscarinic acetylcholine receptor. A) COS-7 cells were transfected with luciferase construct, M3R-luci and construct #8 and luciferase activity was determined after incubation without and with the indicated ligands. The luminescences without ligands were 1,905,212 ± 172,463 AU (luciferase), 196,512 ± 4,942 AU (M3R-luci) and 100,473 ± 9,770 AU (#8). All data are given as means ± SEM of three independent experiments each performed in triplicate. B) Basal and CCh-induced IP formation was determined in COS-7 cells transfected with the wild-type M3R, M3R-luci and construct #8. All data are given as means ± SEM of three independent experiments each performed in triplicate.
Table 1.
Functional properties of wild-type M3R and M3R-luciferase fusion proteins.
| luciferase activity | IP accumulation (fold over GFP basal) | Cell surface expression | ||||
| mutant | basal (% of M3R-luci) | 100 μM CCh (% of basal activity) | 100 μM atropine (% of basal activity) | basal | 100 μM CCh | (% of M3R-luci) |
| M3R | 0.08 ± 0.03 (3) | - | - | 2.93 ± 0.37 | 12.1 ± 2.0 | 229 ± 13 |
| M3R-luci | 100 (31) | 105 ± 5 | 84.6 ± 3.5** | 1.60 ± 0.15 | 10.6 ± 0.2 | 100 |
| #1 | 71.2 ± 0.7 (3) | 103 ± 9 | 74.8 ± 9.3 | 1.40 ± 0.12 | 9.60 ± 0.45 | 74.7 ± 5.3 |
| #2 | 42.8 ± 4.8 (3) | 116 ± 5 | 93.0 ± 4.2 | 1.20 ± 0.12 | 4.37 ± 0.09 | 56.1 ± 4.1 |
| #3 | 29.8 ± 3.0 (4) | 91.0 ± 11.0 | 95.2 ± 10.9 | 0.93 ± 0.03 | 1.57 ± 0.12 | 32.8 ± 5.3 |
| #4 | 16.6 ± 3.0 (3) | 110 ± 3.8 | 104 ± 6.8 | 0.97 ± 0.03 | 1.10 ± 0.06 | 13.5 ± 0.7 |
| #5 | 11.1 ± 1.5 (3) | 104 ± 10 | 96.0 ± 21.2 | 0.97 ± 0.09 | 1.10 ± 0.06 | 3.9 ± 0.9 |
| #6 | 95.7 ± 5.5 (20) | 94.0 ± 7.1 | 75.7 ± 5.2** | 1.27 ± 0.09 | 9.50 ± 0.61 | 105 ± 3.2 |
| #7 | 42.0 ± 3.7 (11) | 95.9 ± 7.5 | 93.8 ± 5.9 | 1.00 ± 0.10 | 3.27 ± 0.17 | 35.8 ± 4.2 |
| #8 | 62.6 ± 5.2 (22) | 98.5 ± 4.7 | 60.2 ± 2.8** | 0.87 ± 0.03 | 1.37 ± 0.09 | 114 ± 7 |
| #9 | 25.9 ± 3.7 (5) | 98.4 ± 8.7 | 87.3 ± 8.6 | 1.03 ± 0.09 | 1.43 ± 0.12 | 27.3 ± 3.5 |
| #10 | 37.0 ± 4.0 (5) | 95.2 ± 7.3 | 76.4 ± 4.1* | 1.53 ± 0.17 | 9.67 ± 0.78 | 31.6 ± 4.4 |
| #11 | 30.3 ± 3.9 (5) | 83.4 ± 7.3 | 73.8 ± 3.1* | 1.40 ± 0.06 | 8.33 ± 0.54 | 28.9 ± 4.8 |
| #12 | 37.2 ± 6.8 (4) | 111 ± 17 | 78.6 ± 10.1 | 1.43 ± 0.17 | 9.90 ± 0.70 | 56.6 ± 7.8 |
| #13 | 27.8 ± 6.7 (3) | 80.2 ± 8.3 | 76.3 ± 8.5 | 1.13 ± 0.09 | 8.87 ± 1.01 | 36.7 ± 11.6 |
| #14 | 42.0 ± 11.3 (4) | 106 ± 10 | 85.5 ± 6.4 | 1.50 ± 0.12 | 9.57 ± 0.95 | 39.5 ± 4.3 |
| #15 | 31.8 ± 6.5 (4) | 102 ± 5 | 84.3 ± 7.4 | 1.10 ± 0.10 | 8.80 ± 0.95 | 25.5 ± 2.5 |
| #16 | 0.4 ± 0.1 (3) | - | - | 1.07 ± 0.09 | 5.23 ± 0.41 | 14.6 ± 3.8 |
| #17 | 0.4 ± 0.1 (3) | - | - | 1.00 ± 0.06 | 4.40 ± 0.45 | 12.3 ± 5.7 |
| #18 | 0.5 ± 0.3 (3) | - | - | 0.87 ± 0.07 | 1.80 ± 0.15 | 5.9 ± 2.5 |
| #19 | 69.3 ± 7.6 (4) | 92.3 ± 16.1 | 66.4 ± 9.4 | 1.47 ± 0.19 | 10.9 ± 1.5 | 76.6 ± 12.6 |
| #20 | 19.5 ± 1.3 (4) | 99.6 ± 4.5 | 91.8 ± 9.0 | 0.93 ± 0.09 | 4.13 ± 0.12 | 35.2 ± 2.9 |
| #21 | 17.8 ± 2.4 (7) | 99.5 ± 3.3 | 96.1 ± 4.1 | 1.07 ± 0.19 | 1.03 ± 0.07 | 6.6 ± 1.6 |
| #22 | 24.3 ± 10.9 (5) | 97.4 ± 4.2 | 97.2 ± 9.1 | 1.03 ± 0.07 | 0.93 ± 0.09 | 0.6 ± 0.5 |
To evaluate the functional properties of M3R-enzyme chimeras, luciferase activities, measured in the absence (basal activity) and presence of the indicated ligands, were determined (see Methods). Basal activity is given as percentage of M3R-luci (411,043 ± 95,142 AU). Activity in the presence of ligands is given as percentage of the activity of the individual constructs. Data are presented as means ± S.E.M. of the indicated number of experiments, each carried out in triplicate. For measurement of Gq/phospholipase C activation IP accumulation assays were performed as described under Methods. Basal IP values were determined in control (GFP)-transfected COS-7 cells (716 ± 81 cpm/well). Data (three independent assays performed in triplicate) are given as means ± S.E.M. fold over GFP-transfected IP values. Cell surface expression was assayed with indirect cell surface ELISA. Specific optical density (OD) readings (OD value of HA-tagged construct minus OD value of GFP-transfected cells) are given as a percentage of M3R-luci. The nonspecific OD (GFP) was 0.156 ± 0.02 (set as 0%) and the OD value of M3R-luci was 0.66 ± 0.06 (set as 100%). ELISA data are given as means ± S.E.M. of three independent experiments, each carried out in triplicate.
Significant reduction of the luciferase activity (*p < 0.01; **p < 0.001)
Optimization of the M3R-luciferase fusion protein
Next, we systematically deleted portions of ICL3 flanking the enzyme (Figure 2) to improve coupling of atropine-induced conformational changes to enzyme activity. Successive N-terminal shortening of ICL3 (constructs #1-#5) progressively reduced cell surface expression, ligand-induced IP formation and luciferase activity but atropine failed to modulate luciferase activity. Likewise, the C-terminal part of ICL3 was shortened (constructs #6-#8). Constructs #6 and #8 were properly delivered to the cell surface and displayed high luciferase activity. Strikingly, both chimeras showed a significant reduction in enzyme activity up to ~40% (construct #8, Table 1) upon atropine binding. G-protein signalling was retained in construct #6 but abolished in construct #8, presumably because the deleted C-terminal part of ICL3 is involved in G-protein coupling [32]. The combination of N- and C-terminal shortening (construct #9) was not advantageous.
We then tested whether N- or C-terminal truncation of the luciferase insert improved coupling to conformational changes of the receptor. Only deletion of the very N-terminal two amino acid residues (construct #10) had a significant effect on atropine-induced reduction of the enzyme activity (Table 1). Combination with ICL3 shortening (construct #11) did not further improve allosteric modulation of the enzyme activity by atropine. In agreement with previous studies [33], further removal of the N terminus abolished enzyme activity completely (Table 1, constructs #12-#18) probably because of destruction of the functionally relevant N-terminal domain. The crystal structure of Photinys pyralis luciferase demonstrates that N-terminal and C-terminal domains form the active site [34]. C-terminal truncation of the enzyme did not result in significantly reduced enzyme activity after atropine application, neither alone (construct #19) nor in combination with ICL3 truncation (construct #20). Preliminary studies with fusion proteins of other GPCR and reporter proteins indicate that integration and optimization is required for every individual biosensor (data not shown).
Allosteric modulation of luciferase activity by M3R blockers
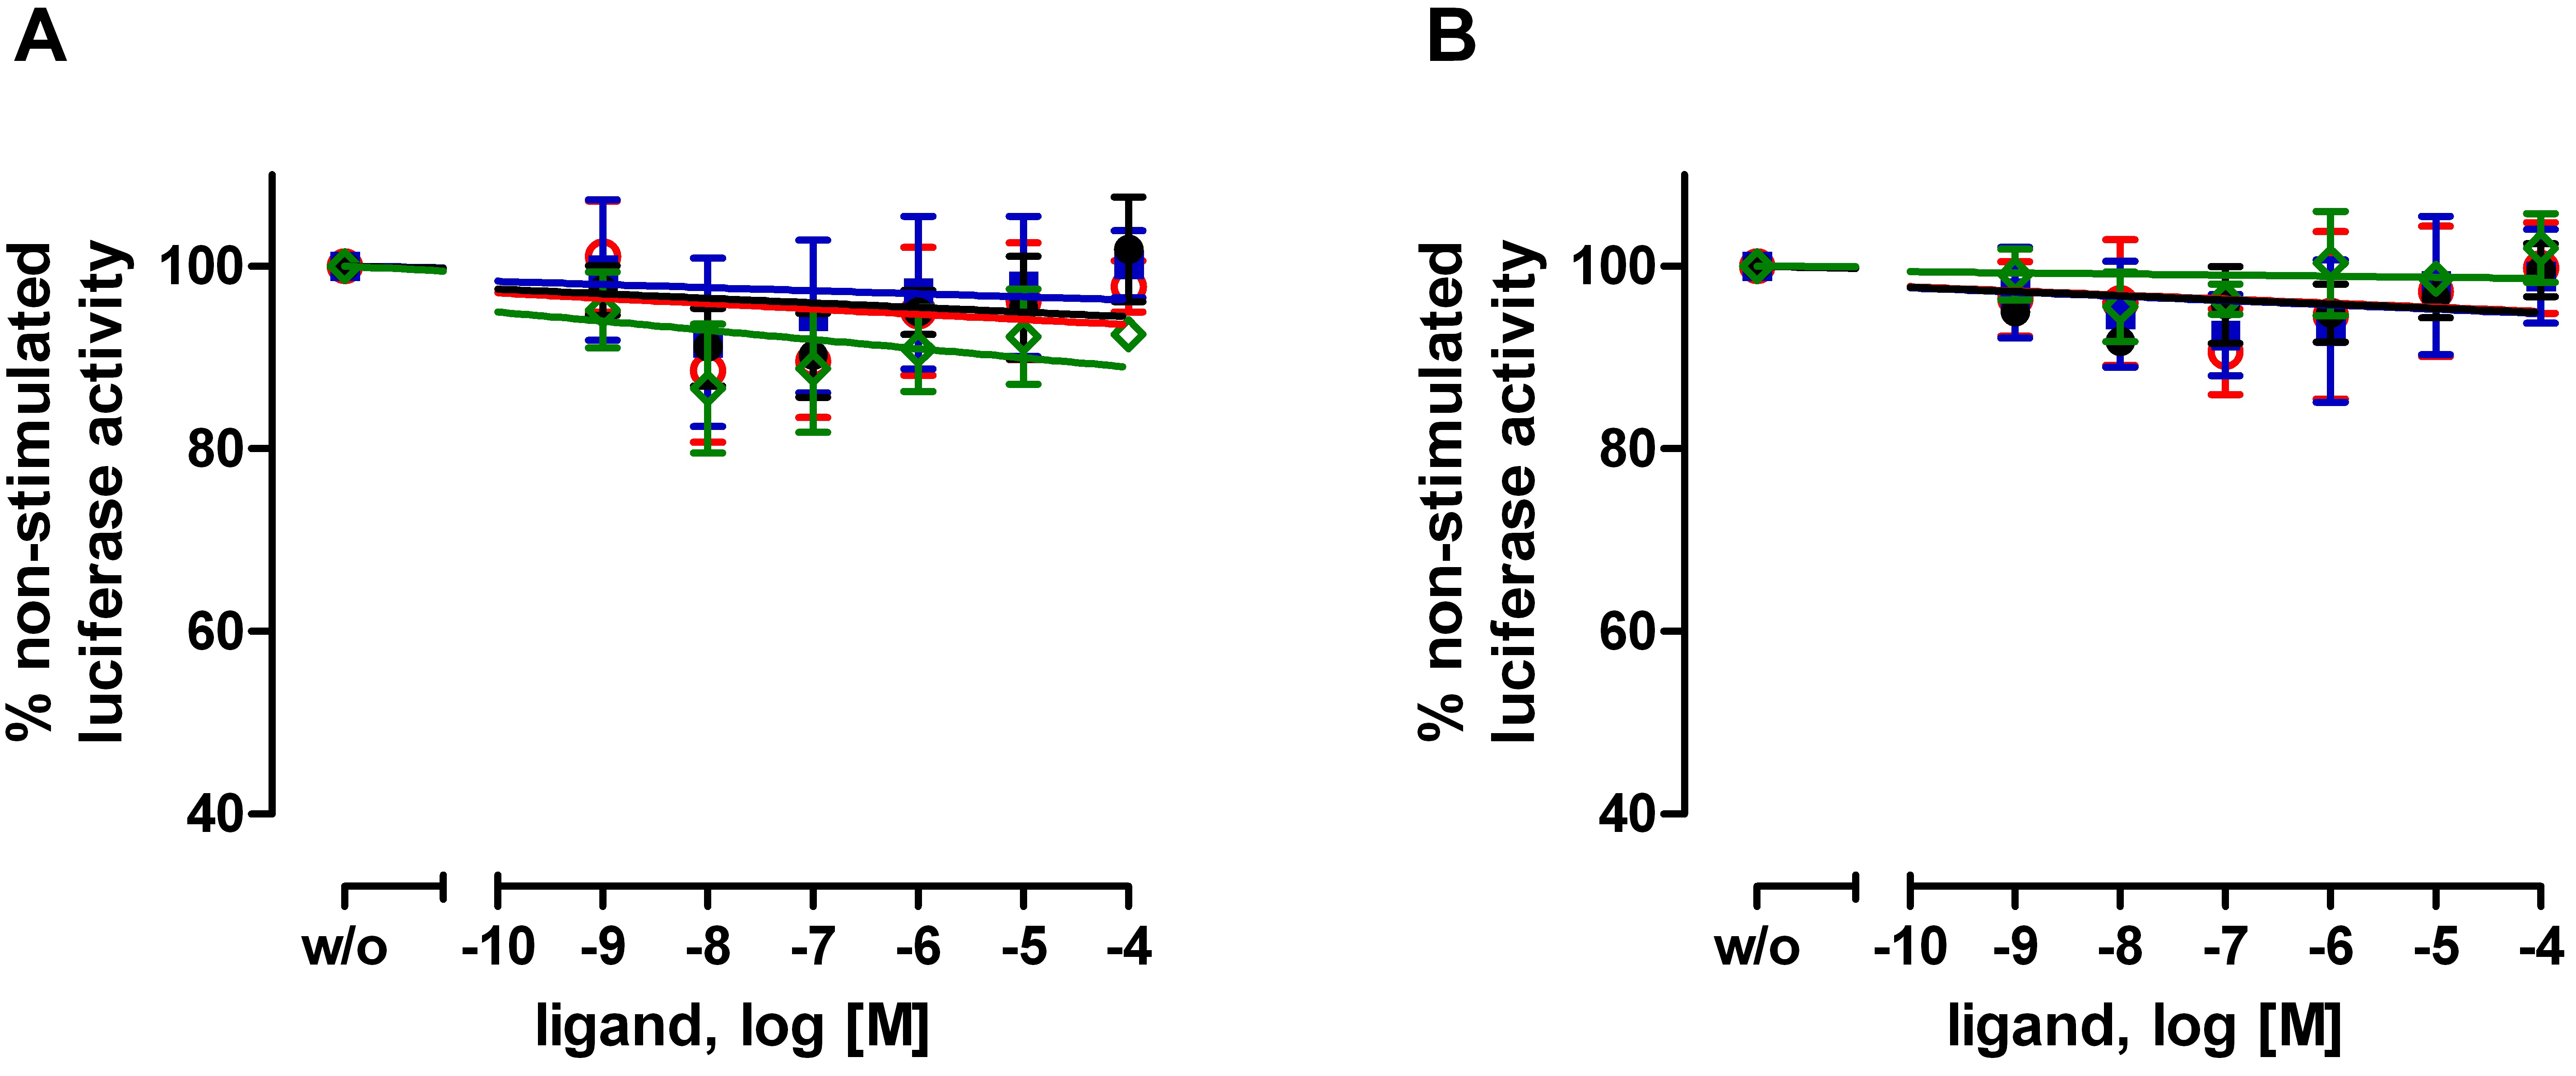
Finally, we investigated the specificity and potency of other M3R blockers in M3R-luci constructs. Scopolamine and butylscopolamine, both are inverse agonists at M3R, were most efficient in reducing luciferase activity in construct #8 [see Additional file 4]. IC50 values for atropine and scopolamine were 6.6 ± 2.3 nM and 2.1 ± 0.4 nM, respectively (Figure 4). In agreement with functional studies at the wild-type M3R [35], butylscopolamine was less potent in luciferase inhibition (IC50 value: 1.7 ± 0.5 μM, Figure 4). This indicates an unchanged pharmacology of the ligand-binding domain within the M3R-luciferase fusion protein.
Figure 4.

Allosteric modulation of enzyme activity in M3R-luciferase fusion proteins by nanomolar concentrations of M3R blockers. CCh (square), atropine (open circle), scopolamine (filled circle) and butylscopolamine (diamond) were applied at the indicated concentrations on COS-7 cells transfected with M3R-luci (A) and construct #8 (B) and luciferase activity was determined. The luminescences without ligands were 178,680 ± 18,171 AU (M3R-luci) and 121,578 ± 12,845 AU (construct #8). Enzyme activity of the individual constructs without ligands was set at 100%. All data are given as mean ± S.E.M. of four independent experiments each performed in triplicate. Control experiments were carried out with COS-7 cells expressing luciferase alone and V2R-luci [see Additional file 3].
From the constructs tested, construct #8 met best the criteria of a biosensor, including nanomolar ligand sensitivity, high cell surface expression, and reduced G protein-coupling (Figures 3 and 4, Table 1). In this construct, structural optimization was successfully used to enhance coupling of ligand-induced rigid body movement of the TMH to structural changes within the luciferase domain. As this leads to a reduction in luciferase activity, one can speculate that the underlying conformational change rearranges the orientation of the N- and C-terminal domains within the luciferase molecule that form its active centre. In addition, our data support previous findings [18,19] that structural changes upon inverse agonist binding are different from those induced by agonists. Following CCh stimulation, fusion protein #6 still activated the Gq/phospholipase C pathway but CCh had no influence on luciferase activity (Table 1). However, atropine reduced luciferase activity by 25% in this construct. It is interesting to note that insertion of luciferase, which itself is bigger than the receptor protein, into the cytoplasmic surface of the GPCR still allows for efficient G-protein coupling. This implicates a rather small interaction site between the receptor and the G protein.
Conclusion
By integration of luciferase into ICL3 of a GPCR and successive optimization, we generated a fusion protein in which the enzyme activity is allosterically modulated by ligand binding to the GPCR in the nanomolar range. Thus, we demonstrate that GPCR are suitable as modular ligand binding domains capable of transducing the signal through rigid-body movement of TMH onto an intracellularly integrated enzyme. Artificial GPCR-enzyme chimeras may have applications beyond biosensing, for example, in ligand-dependent control of metabolic pathways and as molecular tools to study conformational changes in GPCR. Our study may also encourage the generation of GPCR fusion proteins in which other proteins or protein domains such as fluorescent proteins and SH3 domains are allosterically regulated to modulate fluorescence properties and protein-protein interactions, respectively.
Methods
Materials
The agonist carbamylcholine chloride (carbachol, CCh) and the inverse agonists [36] atropine sulfate, scopolamine hydrochloride, and n-butyl scopolamine bromide were obtained from Sigma. Substances were solved in water and stock solutions (100 mM) were aliquoted and stored at -20°C. Aliquots were thawed only once. All restriction enzymes for cloning purposes were purchased from NEB and primers [see Additional file 5] were synthesized by Invitrogen.
Construction of plasmids and mutants of mAChR
All mutations were introduced into the rat M3R [30]. In this rat M3R construct the central part of ICL3 was removed and the N- and C terminus contained an HA- and a Flag-tag, respectively. These modifications were previously demonstrated to have no significant effect on receptor function [29-31].
The cDNA from Photinus pyralis luciferase (without start and stop codons) was amplified and introduced into the ICL3 of M3R by a PCR-based strategy. Luciferase cDNA was 5' and 3' flanked by SpeI sites which allowed for systematic and convenient shortening of ICL3 during optimization experiments. All other mutations were introduced by PCR-based and fragment replacement strategies into M3R-luci (Figure 1 and 2). For control purposes, several additional constructs were generated. Here, luciferase was integrated into ICL2 (Figure 2, construct #21) or C-terminally fused to M3R that was truncated in ICL3 (Figure 2, construct #22). Moreover, luciferase was also integrated into V2R lacking the central portion of ICL3 (positions R243 – T253). The identity of all constructs and the correctness of all PCR-derived sequences were confirmed by restriction analysis and DNA sequencing.
COS-7 cell culture and transfection
COS-7 cells were grown in Dulbecco's modified Eagle medium (DMEM, Invitrogen) supplemented with 10% fetal bovine serum (FBS), 100 U/ml penicillin, and 100 μg/ml streptomycin at 37°C in a humidified 7% CO2 incubator. Rotifect (Roth) was used for transient transfection. For measurement of luciferase activity, 6 × 10⁵ cells were seeded into 6-cm dishes and transfected with 2 μg of plasmid DNA. Twenty-four hours after transfection, cells were split into white 96-well culture plates (PerkinElmer) at 30,000 cells per well. IP formation was determined in 12-well plates (1.5 × 10⁵ cells/well transfected with 0.5 μg of plasmid DNA/well). For the measurement of cell surface expression, cells were seeded into 48-well plates (3.5 × 10⁴ cells/well) and transfected with 0.2 μg of plasmid DNA/well.
Functional assays
To measure IP formation transfected COS-7 cells were incubated with 2 μCi/ml of myo-3H-inositol (18.6 Ci/mmol, PerkinElmer) for 18 h. Thereafter, cells were washed once with serum-free DMEM containing 10 mM LiCl, followed by incubation with ligands for 30 min at 37°C. Intracellular IP levels were determined by anion-exchange chromatography as described previously [37].
The luciferase activity assay was performed with a luciferase activity detection system based on the method described by van Leeuwen et al. [38]. Briefly, after incubation with the ligand in DMEM for 20 min at 37°C, cells were washed with ice-cold PBS. Cell lysis was performed on ice by adding 20 μl of lysis buffer (77 mM K2HPO4, 23 mM KH2PO4, 0.2% Triton X-100, 1 mM DTT, pH 7.8) per well. The lysate was mixed with 100 μl of luciferase buffer (20 mM tricine, 2.67 mM MgSO4, 0.1 mM EDTA, 33.3 mM DTT, 270 μM coenzyme A, 530 μM ATP, 470 μM d-luciferin, pH 7.8). After 3 min luminescence was measured for 1 sec with a Victor2-1420 Multilabel counter (PerkinElmer). Prior to data-collecting functional assays, several tests were performed to ascertain the adequate time for cell lysis and incubation with luciferase buffer. Since both buffers did not contain ligands, diffusion from the receptor was possible. The ligand-induced changes in luciferase activity were stable for at least 10 min after cell lysis [see Additional file 6].
To estimate receptor surface expression, we used an indirect cellular ELISA [39]. Three days after transfection cells were fixed with 4% formaldehyde in PBS for 30 min at room temperature. After washing with PBS and blocking with 10% FBS in DMEM at 37°C for 1 h cells were incubated with biotinylated anti-HA-antibody (Roche, 1 μg/ml in DMEM with 10% FBS) at room temperature for 2 h. Plates were washed and incubated with streptavidin-horse-radish peroxidase conjugate (Roche, 1:5000 dilution in DMEM with 10% FBS) at room temperature for 1 h, followed by extensive washing. Enzymatic reactions were carried out at room temperature in the presence of H2O2 and o-phenylenediamine. The reaction was stopped by adding 50 μl of 50 mM Na2SO3 in 1 M HCl. Colour development was measured bichromatically at 492 nm and 620 nm using a Sunrise™ plate reader (Tecan).
A paired, two-tailed Student's t-test was used to detect significant differences in luciferase activity after ligand binding. The number of replicates is given in the respective legends of the figures and table.
Abbreviations
AU: arbitrary units; FBS: fetal bovine serum; CCh: carbachol; DMEM: Dulbecco's modified Eagle medium; ICL1-3: intracellular loops 1–3; IP: inositol phosphate; M3R: M3 muscarinic acetylcholine receptor; TMH: transmembrane helix; V2R: V2 vasopressin receptor.
Authors' contributions
DT carried out all functional assays and participated in the generation of mutants. DL participated in the generation of the mutants. RS participated in designing the mutants. TS conceived of the study, participated in the design and wrote the manuscript. All authors read and approved the final manuscript
Supplementary Material
Description of control experiments. This file summarises all control experiments carried out.
Luciferase can be integrated into other GPCR (e.g. V2R) without loosing G protein-coupling abilities. COS-7 cells were transfected with wild type V2R and V2R-luci. 48 h after transfection cells were incubated with 100 nM arginine-vasopressin (AVP). Cyclic AMP levels were determined using the non-radioactive cAMP-determination kit (AlphaScreening technology, PerkinElmer). The cAMP level (atmol/cell) of two independent experiments performed in triplicate is given (means ± S.E.M.).
M3R ligands have no effect on soluble luciferase and V2R-luciferase fusion protein. COS-7 cells were transfected with luciferase (A) and V2R-luci (B). Increasing concentrations of CCh (square), atropine (open circle), scopolamine (filled circle) and butylscopolamine (diamond) were applied and luciferase activity was determined as described under Methods. The enzyme activities without ligands were 1,905,212 ± 172,463 AU (luciferase), 182,120 ± 18,188 AU (V2R-luci). Enzyme activity of the individual constructs without ligands was set 100%. All data are given as mean ± S.E.M. of three independent experiments each performed in triplicate.
Modulation of enzyme activity in M3R-luciferase fusion proteins by different receptor ligands. COS-7 cells transfected with M3R-luci and construct #8 were stimulated with the indicated ligands (100 μM) and luciferase activity was determined. The luminescence of the fusion constructs were 184,314 ± 75,049 AU (M3R-luci) and 140,452 ± 55,426 AU (construct #8). Enzyme activity of the individual constructs without ligands were set 100%. All data are given as mean ± S.E.M. of four independent experiments each performed in triplicate.
Primer used in this study. This table listes all primers used to generate the mutants of the M3R-luciferase fusion protein.
Kinetics of luciferase activity assay. Cells were transfected with M3R-luci and luciferase and the assay was performed as described in the Method section with the exception that the luciferase buffer was added at different incubation times after lysis. Data are given as mean ± S.D. of one experiment performed in triplicate.
Acknowledgments
Acknowledgements
We thank H. Römpler for many suggestions and critical reading of the manuscript. This work was supported by the Deutsche Forschungsgemeinschaft (Sfb 610) and Bundesministerium für Bildung und Forschung.
Contributor Information
Doreen Thor, Email: doreen.thor@medizin.uni-leipzig.de.
Diana Le Duc, Email: dieleduc@yahoo.com.
Rainer Strotmann, Email: rainer.strotmann@medizin.uni-leipzig.de.
Torsten Schöneberg, Email: schoberg@medizin.uni-leipzig.de.
References
- Cabantous S, Terwilliger TC, Waldo GS. Protein tagging and detection with engineered self-assembling fragments of green fluorescent protein. Nat Biotechnol. 2005;23:102–107. doi: 10.1038/nbt1044. [DOI] [PubMed] [Google Scholar]
- Paulmurugan R, Gambhir SS. An intramolecular folding sensor for imaging estrogen receptor-ligand interactions. Proc Natl Acad Sci USA. 2006;103:15883–15888. doi: 10.1073/pnas.0607385103. [DOI] [PMC free article] [PubMed] [Google Scholar]
- Ostermeier M. Engineering allosteric protein switches by domain insertion. Protein Eng Des Sel. 2005;18:359–364. doi: 10.1093/protein/gzi048. [DOI] [PubMed] [Google Scholar]
- Dueber JE, Yeh BJ, Chak K, Lim WA. Reprogramming control of an allosteric signaling switch through modular recombination. Science. 2003;301:1904–1908. doi: 10.1126/science.1085945. [DOI] [PubMed] [Google Scholar]
- Guntas G, Mansell TJ, Kim JR, Ostermeier M. Directed evolution of protein switches and their application to the creation of ligand-binding proteins. Proc Natl Acad Sci USA. 2005;102:11224–11229. doi: 10.1073/pnas.0502673102. [DOI] [PMC free article] [PubMed] [Google Scholar]
- Gloriam DE, Fredriksson R, Schioth HB. The G protein-coupled receptor subset of the rat genome. BMC Genomics. 2007;8:338. doi: 10.1186/1471-2164-8-338. [DOI] [PMC free article] [PubMed] [Google Scholar]
- Haitina T, Fredriksson R, Foord SM, Schioth HB, Gloriam DE. The G protein-coupled receptor subset of the dog genome is more similar to that in humans than rodents. BMC Genomics. 2009;10:24. doi: 10.1186/1471-2164-10-24. [DOI] [PMC free article] [PubMed] [Google Scholar]
- Quignon P, Giraud M, Rimbault M, Lavigne P, Tacher S, Morin E, Retout E, Valin AS, Lindblad-Toh K, Nicolas J, Galibert F. The dog and rat olfactory receptor repertoires. Genome Biol. 2005;6:R83. doi: 10.1186/gb-2005-6-10-r83. [DOI] [PMC free article] [PubMed] [Google Scholar]
- Gilchrist A. Modulating G-protein-coupled receptors: from traditional pharmacology to allosterics. Trends Pharmacol Sci. 2007;28:431–437. doi: 10.1016/j.tips.2007.06.012. [DOI] [PubMed] [Google Scholar]
- Versele M, Lemaire K, Thevelein JM. Sex and sugar in yeast: two distinct GPCR systems. EMBO Rep. 2001;2:574–579. doi: 10.1093/embo-reports/kve132. [DOI] [PMC free article] [PubMed] [Google Scholar]
- Schoneberg T, Schulz A, Gudermann T. The structural basis of G-protein-coupled receptor function and dysfunction in human diseases. Rev Physiol Biochem Pharmacol. 2002;144:143–227. [PubMed] [Google Scholar]
- Altenbach C, Yang K, Farrens DL, Farahbakhsh ZT, Khorana HG, Hubbell WL. Structural features and light-dependent changes in the cytoplasmic interhelical E-F loop region of rhodopsin: a site-directed spin-labeling study. Biochemistry. 1996;35:12470–12478. doi: 10.1021/bi960849l. [DOI] [PubMed] [Google Scholar]
- Ghanouni P, Steenhuis JJ, Farrens DL, Kobilka BK. Agonist-induced conformational changes in the G-protein-coupling domain of the beta 2 adrenergic receptor. Proc Natl Acad Sci USA. 2001;98:5997–6002. doi: 10.1073/pnas.101126198. [DOI] [PMC free article] [PubMed] [Google Scholar]
- Jensen AD, Guarnieri F, Rasmussen SG, Asmar F, Ballesteros JA, Gether U. Agonist-induced conformational changes at the cytoplasmic side of transmembrane segment 6 in the beta 2 adrenergic receptor mapped by site-selective fluorescent labeling. J Biol Chem. 2001;276:9279–9290. doi: 10.1074/jbc.M004871200. [DOI] [PubMed] [Google Scholar]
- Rasmussen SG, Jensen AD, Liapakis G, Ghanouni P, Javitch JA, Gether U. Mutation of a highly conserved aspartic acid in the beta2 adrenergic receptor: constitutive activation, structural instability, and conformational rearrangement of transmembrane segment 6. Mol Pharmacol. 1999;56:175–184. doi: 10.1124/mol.56.1.175. [DOI] [PubMed] [Google Scholar]
- Ward SD, Hamdan FF, Bloodworth LM, Siddiqui NA, Li JH, Wess J. Use of an in situ disulfide cross-linking strategy to study the dynamic properties of the cytoplasmic end of transmembrane domain VI of the M3 muscarinic acetylcholine receptor. Biochemistry. 2006;45:676–685. doi: 10.1021/bi051503q. [DOI] [PubMed] [Google Scholar]
- Granier S, Kim S, Shafer AM, Ratnala VR, Fung JJ, Zare RN, Kobilka B. Structure and conformational changes in the C-terminal domain of the beta2-adrenoceptor: insights from fluorescence resonance energy transfer studies. J Biol Chem. 2007;282:13895–13905. doi: 10.1074/jbc.M611904200. [DOI] [PubMed] [Google Scholar]
- Li JH, Han SJ, Hamdan FF, Kim SK, Jacobson KA, Bloodworth LM, Zhang X, Wess J. Distinct Structural Changes in a G Protein-coupled Receptor Caused by Different Classes of Agonist Ligands. J Biol Chem. 2007;282:26284–26293. doi: 10.1074/jbc.M704875200. [DOI] [PubMed] [Google Scholar]
- Vilardaga JP, Steinmeyer R, Harms GS, Lohse MJ. Molecular basis of inverse agonism in a G protein-coupled receptor. Nat Chem Biol. 2005;1:25–28. doi: 10.1038/nchembio705. [DOI] [PubMed] [Google Scholar]
- Armbruster BN, Li X, Pausch MH, Herlitze S, Roth BL. Evolving the lock to fit the key to create a family of G protein-coupled receptors potently activated by an inert ligand. Proc Natl Acad Sci USA. 2007;104:5163–5168. doi: 10.1073/pnas.0700293104. [DOI] [PMC free article] [PubMed] [Google Scholar]
- Coward P, Wada HG, Falk MS, Chan SD, Meng F, Akil H, Conklin BR. Controlling signaling with a specifically designed Gi-coupled receptor. Proc Natl Acad Sci USA. 1998;95:352–357. doi: 10.1073/pnas.95.1.352. [DOI] [PMC free article] [PubMed] [Google Scholar]
- Schulein R, Rutz C, Rosenthal W. Membrane targeting and determination of transmembrane topology of the human vasopressin V2 receptor. J Biol Chem. 1996;271:28844–28852. doi: 10.1074/jbc.271.46.28844. [DOI] [PubMed] [Google Scholar]
- Nakano Y, Nystedt S, Shivdasani AA, Strutt H, Thomas C, Ingham PW. Functional domains and sub-cellular distribution of the Hedgehog transducing protein Smoothened in Drosophila. Mech Dev. 2004;121:507–518. doi: 10.1016/j.mod.2004.04.015. [DOI] [PubMed] [Google Scholar]
- Zeng FY, McLean AJ, Milligan G, Lerner M, Chalmers DT, Behan DP. Ligand specific up-regulation of a Renilla reniformis luciferase-tagged, structurally unstable muscarinic M3 chimeric G protein-coupled receptor. Mol Pharmacol. 2003;64:1474–1484. doi: 10.1124/mol.64.6.1474. [DOI] [PubMed] [Google Scholar]
- Gales C, Rebois RV, Hogue M, Trieu P, Breit A, Hebert TE, Bouvier M. Real-time monitoring of receptor and G-protein interactions in living cells. Nat Methods. 2005;2:177–184. doi: 10.1038/nmeth743. [DOI] [PubMed] [Google Scholar]
- Vilardaga JP, Bunemann M, Krasel C, Castro M, Lohse MJ. Measurement of the millisecond activation switch of G protein-coupled receptors in living cells. Nat Biotechnol. 2003;21:807–812. doi: 10.1038/nbt838. [DOI] [PubMed] [Google Scholar]
- Angers S, Salahpour A, Joly E, Hilairet S, Chelsky D, Dennis M, Bouvier M. Detection of beta 2-adrenergic receptor dimerization in living cells using bioluminescence resonance energy transfer (BRET) Proc Natl Acad Sci USA. 2000;97:3684–3689. doi: 10.1073/pnas.060590697. [DOI] [PMC free article] [PubMed] [Google Scholar]
- Moreau CJ, Dupuis JP, Revilloud J, Arumugam K, Vivaudou M. Coupling ion channels to receptors for biomolecule sensing. Nat Nanotechnol. 2008;3:620–625. doi: 10.1038/nnano.2008.242. [DOI] [PubMed] [Google Scholar]
- Maggio R, Barbier P, Fornai F, Corsini GU. Functional role of the third cytoplasmic loop in muscarinic receptor dimerization. J Biol Chem. 1996;271:31055–31060. doi: 10.1074/jbc.271.49.31055. [DOI] [PubMed] [Google Scholar]
- Schoneberg T, Liu J, Wess J. Plasma membrane localization and functional rescue of truncated forms of a G protein-coupled receptor. J Biol Chem. 1995;270:18000–18006. doi: 10.1074/jbc.270.30.18000. [DOI] [PubMed] [Google Scholar]
- Zeng FY, Wess J. Identification and molecular characterization of m3 muscarinic receptor dimers. J Biol Chem. 1999;274:19487–19497. doi: 10.1074/jbc.274.27.19487. [DOI] [PubMed] [Google Scholar]
- Wess J, Blin N, Yun J, Schoneberg T, Liu J. G protein-coupled receptors: structural basis of receptor assemply and G protein recognition. In: Schwartz TW, Hjorth SA, Sandholm Kastrup J, editor. Alfred Benzon Symposium 39: Structure and Function of 7TM Receptors. Copenhagen: Blackwell Munksgaard; 1996. pp. 43–56. [Google Scholar]
- Wang XC, Yang J, Huang W, He L, Yu JT, Lin QS, Li W, Zhou HM. Effects of removal of the N-terminal amino acid residues on the activity and conformation of firefly luciferase. Int J Biochem Cell Biol. 2002;34:983–991. doi: 10.1016/S1357-2725(02)00019-5. [DOI] [PubMed] [Google Scholar]
- Conti E, Franks NP, Brick P. Crystal structure of firefly luciferase throws light on a superfamily of adenylate-forming enzymes. Structure. 1996;4:287–298. doi: 10.1016/S0969-2126(96)00033-0. [DOI] [PubMed] [Google Scholar]
- Lysikova M, Havlas Z, Tucek S. Interactions between allosteric modulators and 4-DAMP and other antagonists at muscarinic receptors: potential significance of the distance between the N and carboxyl C atoms in the molecules of antagonists. Neurochem Res. 2001;26:383–394. doi: 10.1023/A:1010951131496. [DOI] [PubMed] [Google Scholar]
- Spalding TA, Burstein ES. Constitutive activity of muscarinic acetylcholine receptors. J Recept Signal Transduct Res. 2006;26:61–85. doi: 10.1080/10799890600567349. [DOI] [PubMed] [Google Scholar]
- Berridge MJ. Rapid accumulation of inositol trisphosphate reveals that agonists hydrolyse polyphosphoinositides instead of phosphatidylinositol. Biochem J. 1983;212:849–858. doi: 10.1042/bj2120849. [DOI] [PMC free article] [PubMed] [Google Scholar]
- van Leeuwen W, Hagendoorn MJM, Ruttink T, van Poecke R, Plas LHW van der, Krol AR van der. The use of the luciferase reporter system for in planta gene expression studies. Plant Mol Biol Rep. 2000;18:143a–143t. doi: 10.1007/BF02824024. [DOI] [Google Scholar]
- Schoneberg T, Sandig V, Wess J, Gudermann T, Schultz G. Reconstitution of mutant V2 vasopressin receptors by adenovirus-mediated gene transfer. Molecular basis and clinical implication. J Clin Invest. 1997;100:1547–1556. doi: 10.1172/JCI119678. [DOI] [PMC free article] [PubMed] [Google Scholar]
Associated Data
This section collects any data citations, data availability statements, or supplementary materials included in this article.
Supplementary Materials
Description of control experiments. This file summarises all control experiments carried out.
Luciferase can be integrated into other GPCR (e.g. V2R) without loosing G protein-coupling abilities. COS-7 cells were transfected with wild type V2R and V2R-luci. 48 h after transfection cells were incubated with 100 nM arginine-vasopressin (AVP). Cyclic AMP levels were determined using the non-radioactive cAMP-determination kit (AlphaScreening technology, PerkinElmer). The cAMP level (atmol/cell) of two independent experiments performed in triplicate is given (means ± S.E.M.).
M3R ligands have no effect on soluble luciferase and V2R-luciferase fusion protein. COS-7 cells were transfected with luciferase (A) and V2R-luci (B). Increasing concentrations of CCh (square), atropine (open circle), scopolamine (filled circle) and butylscopolamine (diamond) were applied and luciferase activity was determined as described under Methods. The enzyme activities without ligands were 1,905,212 ± 172,463 AU (luciferase), 182,120 ± 18,188 AU (V2R-luci). Enzyme activity of the individual constructs without ligands was set 100%. All data are given as mean ± S.E.M. of three independent experiments each performed in triplicate.
Modulation of enzyme activity in M3R-luciferase fusion proteins by different receptor ligands. COS-7 cells transfected with M3R-luci and construct #8 were stimulated with the indicated ligands (100 μM) and luciferase activity was determined. The luminescence of the fusion constructs were 184,314 ± 75,049 AU (M3R-luci) and 140,452 ± 55,426 AU (construct #8). Enzyme activity of the individual constructs without ligands were set 100%. All data are given as mean ± S.E.M. of four independent experiments each performed in triplicate.
Primer used in this study. This table listes all primers used to generate the mutants of the M3R-luciferase fusion protein.
Kinetics of luciferase activity assay. Cells were transfected with M3R-luci and luciferase and the assay was performed as described in the Method section with the exception that the luciferase buffer was added at different incubation times after lysis. Data are given as mean ± S.D. of one experiment performed in triplicate.