Abstract
Purpose
Quantitative non-invasive biomarkers of hepatic steatosis are urgently needed for the diagnosis and management of non-alcoholic fatty liver disease. The purpose of this work was to develop a chemical-shift based imaging method for fat quantification that accounts for the complex spectrum of fat, and to compare this method with MR spectroscopy (MRS).
Materials and Methods
Hepatic steatosis was measured with “fat-fraction” images in 31 patients using a multi-echo chemical shift based water-fat separation method at 1.5T. Fat-fraction images were reconstructed using a conventional signal model that considers fat as a single peak at −210Hz relative to water (“single peak” reconstruction). Fat-fraction images were also reconstructed from the same source images using two methods that account for the complex spectrum of fat; pre-calibrated and self-calibrated “multi-peak” reconstruction. Single voxel MRS that was co-registered with imaging was performed for comparison.
Results
Imaging and MRS demonstrated excellent correlation with single peak reconstruction (r2=0.91), pre-calibrated multi-peak reconstruction (r2=0.94), and self-calibrated multi-peak reconstruction (r2=0.91). However, pre-calibrated multi-peak reconstruction demonstrated the best agreement with MRS with a slope statistically equivalent to one (0.96±0.04, p=0.4), compared to self-calibrated multi-peak reconstruction (0.83±0.05, p=0.001) and single peak reconstruction (0.67±0.04, p<0.001).
Conclusion
Accurate spectral modeling is necessary for accurate quantification of hepatic steatosis with MRI.
Keywords: Non-alcoholic fatty liver disease, hepatic steatosis, magnetic resonance imaging, IDEAL, MR spectroscopy, fat-water imaging, Dixon imaging
Introduction
Non-Alcoholic Fatty Liver Disease (NAFLD) is an emerging cause of chronic liver disease, and is considered to be the hepatic manifestation of the “metabolic syndrome”(1–3), affecting 30% of adults and 10% of children in the United States(4–7). It is increasingly prevalent, paralleling the current epidemics of diabetes and obesity. The underlying cause of NAFLD, insulin resistance, leads to intracellular accumulation of triglycerides in hepatocytes (steatosis)(3, 8). An important subset of NAFLD is non-alcoholic steatohepatitis (NASH)(9), which exhibits histologic markers of inflammation, fibrosis and steatosis. Alarmingly, NAFLD afflicts children at an escalating rate, likely related to the widespread increase in childhood obesity and diabetes(4–7). NAFLD leads to cirrhosis, hepatocellular carcinoma (HCC) and liver failure in a large number of these children as they mature into young adults(4–7).
Non-targeted biopsy, the current gold standard for the detection of steatosis, suffers from tremendous sampling variability(10) because NAFLD is inherently heterogeneous. The underlying assumption that biopsy, which samples 1/50,000th of the liver, is representative of the entire organ is being challenged. A recent study in 51 patients undergoing two closely localized biopsies angled 30–45° apart, demonstrated a κ-reliability score of 0.64 for grading steatosis, indicating poor agreement for reliable grading of NAFLD(11). Other studies have also shown similar sampling variability when more than one sample is analyzed(12–18).
The lack of a safe, inexpensive and non-invasive method for accurate identification and quantitative grading of NAFLD has been a major barrier to understanding its epidemiology and pathophysiology. Therefore, there has been recent interest in the development of non-invasive MRI methods for the detection and quantification of fatty liver(19–25). Unfortunately, the translation of these qualitative methods into quantitative methods for measuring hepatic fat content has been challenging, requiring correction and/or compensation for a variety of confounding factors including: T1 bias(21, 25), noise bias (21), and the effects of T2*(22, 25).
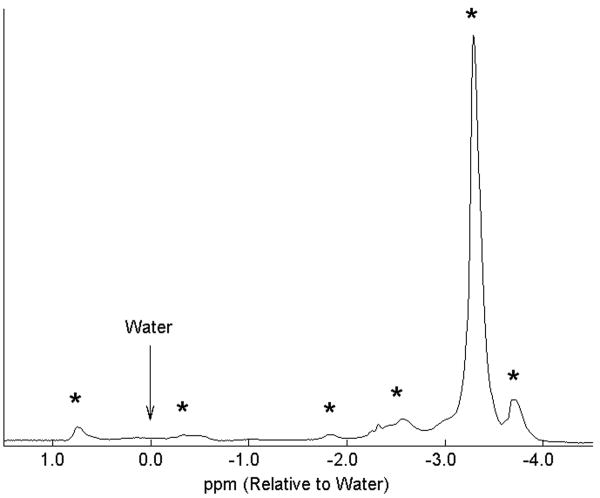
In addition, all chemical-shift MRI methods model the signal from fat as a single spectral peak at ~3.3ppm upfield from water (−210Hz at 1.5T, −420Hz at 3.0T). Unfortunately, fat contains multiple 1H peaks from the various chemical moieties of triglycerides, including olefinic groups with frequencies close to the water resonance(26). Figure 1 contains a single voxel spectrum of fat from the adipose tissue of a normal volunteer, explicitly showing the multiple resonance peaks of fat. In this work, we will demonstrate the importance of accurate spectral modeling for quantification of hepatic steatosis.
Figure 1.
Representative single voxel PRESS proton spectrum acquired from the subcutaneous tissue of a normal volunteer at 1.5T, demonstrating six discrete spectral peaks of fat (*). Considerable signal from fat protons originate at peaks other than the main peak, explaining why chemical-shift based water-fat separation methods that model fat as a single peak cannot achieve accurate separation of water and fat signals. These resonance peaks of fat correspond to frequencies of 47Hz, −23Hz, −117Hz, −159Hz, −210Hz, and −236Hz relative to water (arrow).
Accurate estimation of fatty liver with MRI requires an acquisition that is T1 independent, avoids noise related bias, corrects for T2* and accurately models the spectral complexity of fat. Although excellent correlation with gold standard measurements of fat can still be achieved if these factors are not considered (20, 27), the apparent fat concentration will not reflect the underlying biology (fat concentration). The apparent fat concentration will also be highly variable between scanners, because measurements will be dependent on specific imaging parameters and properties of the scanner, such as TR, TE, flip angle, number of echoes, echo spacing, field strength, etc. Widespread translation of an accurate fat quantification method should reflect the underlying biology and must be independent of scanning parameters and scanner properties, otherwise, it’s utility is greatly limited.
Steatosis represents the abnormal accumulation of intracellular triglycerides, which, unlike the lipid molecules bound in cellular membranes (cholesterols, sphingolipids, phospholipids, etc), are easily detected with conventional MRI and MRS techniques. Unlike MR imaging, MRS has been shown to correlate strongly with liver fat as measured by biopsy(28, 29), and MRS is considered by many as a non-invasive gold standard for quantifying hepatic fat. Unfortunately, MRS acquires signal from only a single, large voxel (8–10cc). However, the fact that MRS can quantify steatosis is highly motivating, because the underlying physics of MRS and MRI are the same. In this work we develop a chemical-shift water-fat separation method that improves the accuracy of hepatic steatosis quantification through accurate modeling of the multiple spectral peaks of fat and compare these “multi-peak” chemical-shift water-fat separation methods with conventional single peak methods and MR spectroscopy.
Materials and Methods
Patients
Our HIPAA-compliant study received approval from our institutional review board to scan both patients and volunteers. After obtaining informed consent, a total of 33 patients (1 normal volunteer, 11 with suspected steatosis, and 22 patients referred for MRI of the liver for unrelated reasons) were recruited for this prospective study. One patient was excluded due to very large body habitus, and a second patient due to a scan prescription error, which resulted in a gross misregistration between imaging and spectroscopy. Of the remaining 31 patients there were 15 men (average age=48.9±12, range=23–68) and 16 women (average age=49.0±12, range=21–71).
Imaging and Spectroscopy
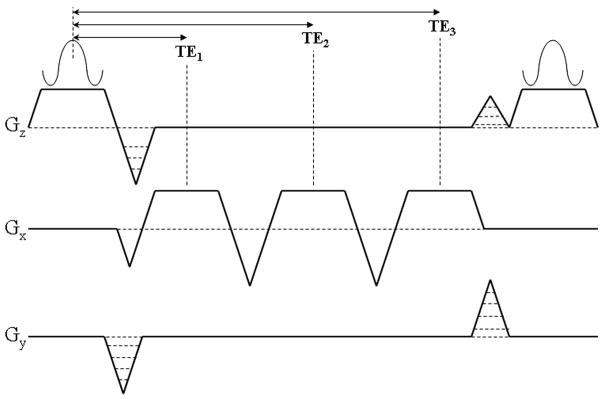
All imaging and spectroscopy was performed on a 1.5T Signa HDx scanner (GE Healthcare, Waukesha, WI) using an 8-channel cardiac coil. Imaging was performed with a chemical-shift based water-fat separation method known as IDEAL (Iterative Decomposition of water and fat with Echo Asymmetry and Least squares estimation)(30–32), combined with a 3D multi-echo spoiled gradient-echo (SPGR) acquisition using three flyback readout gradients (figure 2). Flyback gradients were used to avoid spatial misregistration of fat signal in the readout direction. When data are acquired with bipolar gradient waveforms, an artifact can result from the alternating chemical-shift direction(33).
Figure 2.
Schematic of the pulse sequence diagram of the three-echo spoiled gradient-echo IDEAL acquisition for fat-fraction measurement. The echo times (TE1, TE2, TE3) are carefully chosen to maximize the SNR performance of the acquisition for an effective signal averaging of 3.0 for all relative quantities of water and fat.
Echo times were carefully selected to maximize the SNR performance of the water and fat estimation with an effective signal averaging of 3.0 for all fractions of water and fat(30–32). Echo times were chosen to achieve a relative phase between water and fat (assuming a single peak for fat at −210Hz) such that the center echo was acquired in quadrature (π/2+πk, k=any integer) and the first and third echoes were acquired 2π/3 before and after the center echo, respectively. This combination of echo times achieves the best possible SNR performance for a single spectral peak model of fat(30, 32).
Complex images acquired at the optimized echo times were then processed with an on-line reconstruction algorithm that calculates separate water and fat images. Total reconstruction time for a 3D data set of fat-fraction images was approximately 1–2 minutes. After correcting the fat images for chemical-shift artifact in the readout direction(34) a fat-fraction image was calculated for each pixel,
| [1] |
The use of a fat-fraction image is necessary to remove the effects of coil sensitivity and to provide a quantitative value for local fat content of the tissue. A magnitude discrimination method was used to avoid noise bias that occurs at low fat fractions, when calculating fat-fraction images from separated magnitude water and fat images(21). Finally, a small flip angle (5°) was used to minimize bias in fat-fraction estimates that are related to differences in T1 between water and fat(21, 25).
Most chemical-shift based water-fat separation methods assume that water and fat can be modeled as single, narrow peaks, separated by a known chemical-shift. In such a model, the complex signal from a voxel containing water (W) and fat (F) acquired at echo time tn (n=1, …, N) can be written,
| [2] |
where Δf is the chemical-shift between water and fat (−210Hz at 1.5T) and ψ is the local field inhomogeneity map (Hz). This is a non-linear equation that can be solved in a variety of related methods(31, 35–37). After demodulation of the phase shifts caused by the field inhomogeneity map, estimates of water and fat are made using the matrix pseudoinverse multiplication to estimate water and fat in the least squares sense.
Modified signal models that accounts for multiple spectral peaks of different chemical species have been described for 13C chemical-shift imaging(38, 39), and this approach can be used for accurate spectral modeling of fat, accounting for signal from the multiple fat peaks(25, 40). For a species such as fat, that has multiple spectral peaks and relatively narrow NMR linewidth, the signal equation can be modeled as,
| [3] |
where is a complex term that is assumed to be known a priori, and is written for simplicity, with Δfp (p=1, …, P) representing the frequencies of the P spectral peaks of fat, and rp representing the relative amplitudes of these peaks, both of which are assumed to be known. In addition, the relative amplitudes, rp, are normalized such that so that the estimated value for fat (F) reflects the total signal from fat protons. Note that equation 3 is analogous to equation 2, but with the simple phasor term replaced with a sum of weighted phasors (cn). With this modified signal model, the field map, and subsequently water and fat signals, are estimated in the usual manner. The frequencies of the multiple fat peaks are easily determined using a single voxel NMR spectroscopic acquisition obtained as part of a calibration scan performed in a patient or volunteer from a separate examination. The frequencies of these peaks is relatively constant across different patients as well as different types of fat(26, 28, 41).
The relative amplitudes of the multiple spectral peaks can be determined using two approaches: 1) pre-calibration, where the relative amplitudes of the spectral peaks are measured from a 16-echo scan by fitting the signals to the six most prominent spectral peaks of fat, including correction for T2*, or 2) self-calibration, where the relative amplitudes of the three largest fat peaks (−210 Hz, −159 Hz, 47 Hz at 1.5T) are measured directly from the source data(40). Representative values for the relative amplitudes of fat peaks measured with the pre-calibrated and self-calibrated approaches were recently reported by Yu et al(40). Self-calibration approaches are attractive because they avoid concerns about variations in the relative amplitudes of the spectral peaks of fat for different tissues, as well as concerns over relative T1 and T2* weighting in the various spectral peaks when using different acquisition parameters.
Two self-calibration approaches can be used. A three-peak self-calibration method can be used for three-echo acquisitions, and models only the three largest spectral peaks of fat in the signal model, and requires the acquisition of only three images at different echo times(40). A second self-calibration method estimates the relative amplitudes of the six largest fat peaks and requires the acquisition of at least six images at different echo times(40). In this work, we will use the three-peak self-calibration method acquiring three images at different echo times.
It is important to realize that the three IDEAL reconstruction methods (single peak, pre-calibrated multi-peak and self-calibrated multi-peak) can all be performed using the same set of complex images. This has the advantage of direct comparison of the different methods using the same underlying source data. In this work, we compare the pre-calibrated and three-peak self-calibrated reconstruction with single peak (conventional) IDEAL to determine the importance of accurate spectral modeling for quantification of fat.
Image acquisition parameters for IDEAL included: 3 echoes per TR, TR=7.4ms, TE=2.0/3.6/5.2ms, BW=±143kHz, FOVx=35cm, FOVy=27–35cm, slice=8–10mm, 224–256×160–192 matrix, 18–22 slices, scan time=18–22s, acquired during a breath-hold. IDEAL fat-fraction images were reconstructed with the single-peak model, and then using the two multi-peak methods (pre-calibrated and self-calibrated). Figure 3 contains an example of a multi-echo IDEAL-SPGR data set acquired in a normal volunteer, showing the separated water and fat images, and the subsequent fat-fraction image, calculated according to equation 1 for each image pixel.
Figure 3.
Separated water, fat and calculated fat-fraction image acquired in a healthy volunteer acquired with the multi-echo acquisition in figure 2 and reconstructed with the conventional single peak IDEAL reconstruction, demonstrating how separated water and fat images are used to construct a fat-fraction image.
For comparison with IDEAL, a single voxel breath-held spectroscopic acquisition was performed using point resolved spectroscopy (PRESS)(42), without water suppression to measure a localized hepatic fat-fraction. A 2.0–2.5cm cubic volume (8.0–15.6cc) was selected, usually in the posterior segment of the right lobe of the liver in a location free from large vessels. Acquisition parameters for PRESS included: TR/TE=2500/25ms, BW=±2500Hz, 4 averages, readout points=2048, total scan time=20s during a single breath-hold.
Data Analysis
Raw spectroscopy data were post-processed (blinded to IDEAL results) using in-house analysis software (MATLAB v7.4.0, The Mathworks, Natick, MA) written to estimate the proton density from the area under the absorption spectrum of zeroth-order phase-corrected spectral data. Total areas under the water peak (including the small fat peaks at 47Hz and −23Hz from the water resonance) and the fat group were measured and the fat fraction calculated from the area under the fat group divided by the sum of water and fat groups(43). In addition, fat-fraction measurements were made from all three reconstructed IDEAL reconstruction methods (single peak, multi-peak pre-cal, and multi-peak, self-cal) using a square 2.0–2.5cm2 region of interest (ROI) chosen to match the location of the PRESS voxel and avoid large vessels. The ROI size was 164–334 pixels depending on the PRESS voxel size and image spatial resolution. Linear regression analysis between fat-fraction measurements from IDEAL and PRESS was performed for both conventional and multi-peak IDEAL reconstruction methods using Excel (v11.3.5, Microsoft, Redmond, WA). Perfect agreement between IDEAL and PRESS would yield a slope of 1.0 and intercept of 0.0, and linear regression was also used to test whether the slope and intercept were significantly different from these expected values. Only authors who were not employees of GE Healthcare had control of data and information that might have presented a conflict of interest.
Results
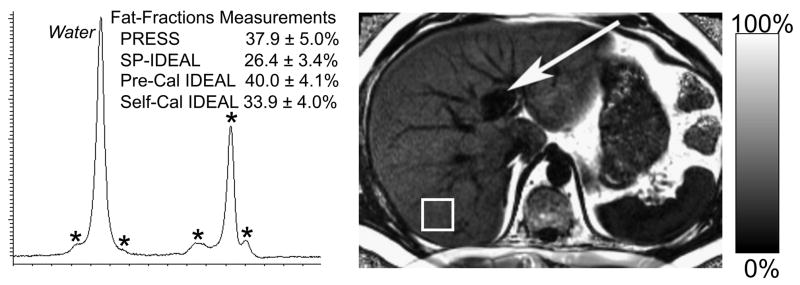
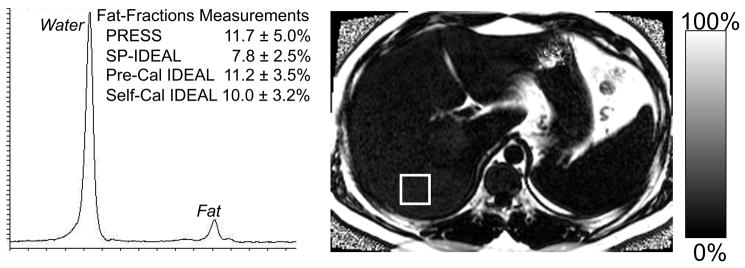
Figure 4 shows representative IDEAL fat-fraction images acquired in two patients with steatosis. Shown for comparison is the PRESS spectrum from the segment of the right lobe of the liver, demonstrating good agreement with IDEAL, when the two multi-peak reconstruction methods were used. In addition, the PRESS spectrum demonstrates the presence of multiple fat peaks (denoted with asterisks). Figure 4a also explicitly demonstrates the utility of imaging to characterize heterogeneity of steatosis, such as fatty sparing in segment 4, near the gall bladder fossa (arrow).
Figure 4.
Examples of IDEAL-fat fraction images (reconstructed using the pre-calibrated multi-peak algorithm) and the corresponding PRESS acquisition, in two patients with a) severe steatosis and b) mild steatosis. The squares shown on the fat-fraction images correspond to the location of the PRESS single voxel acquisition, and the asterisks are shown in the severe steatosis PRESS spectrum to explicitly denote the multiple peaks of fat. The agreement between IDEAL and PRESS improves when using the multi-peak reconstruction methods compared to the conventional single peak reconstruction. Note the fatty sparing near the gall bladder fossa in segment 4 (arrow).
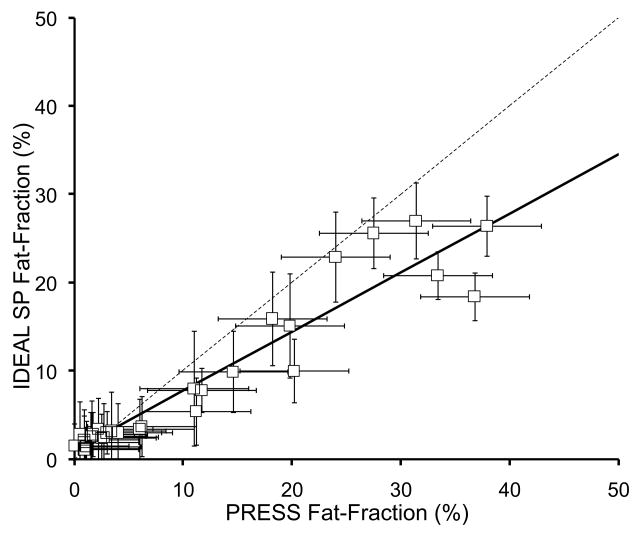
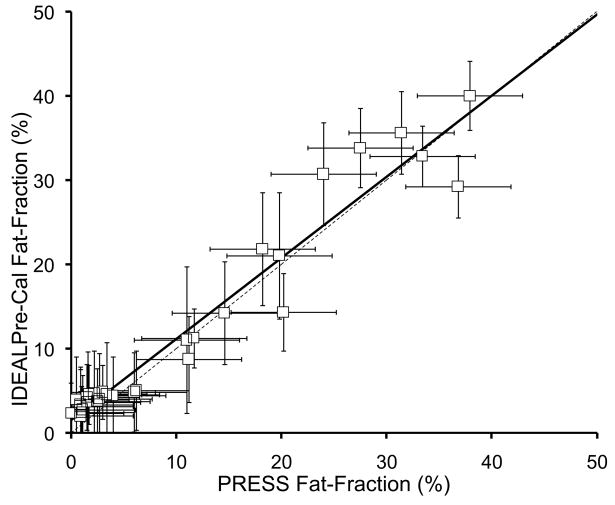
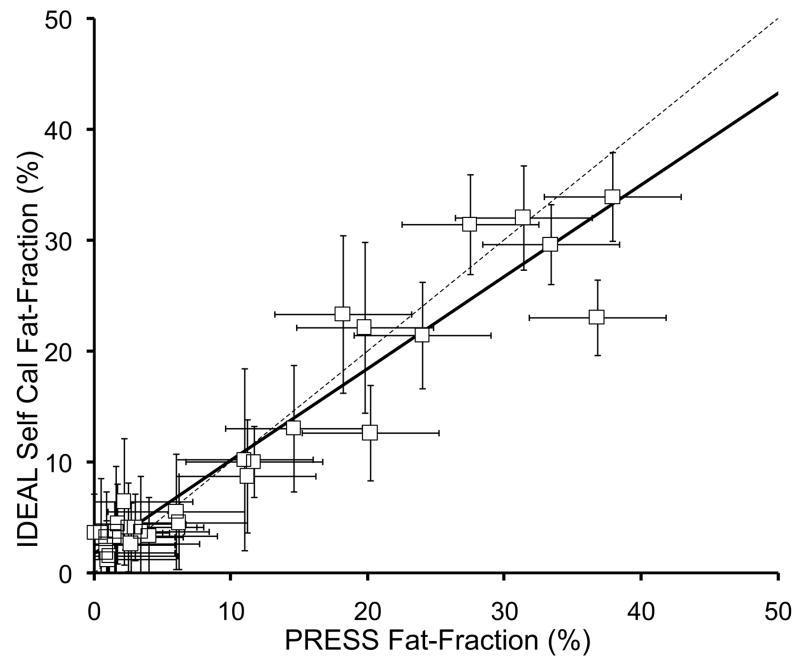
Figure 5 plots the fat-fraction measurements from both IDEAL and PRESS in all 31 patients, for both conventional (single peak) IDEAL and both multi-peak IDEAL reconstruction methods. Error bars on IDEAL fat-fraction measurements are based on the standard error from the ROI measurement, while the error bars on the PRESS fat-fraction measurements were estimated at approximately 5% (0.05) based on the variance in the fat fraction observed when manually adjusting the phasing of the spectral data. Table 1 summarizes the correlation coefficients, as well as the slopes and intercepts of the linear fitting and their statistical significance relative to the expected values of the slope (1.0) and intercept (0.0).
Figure 5.
IDEAL fat-fraction plotted against PRESS fat-fraction using a) conventional single peak (SP) reconstruction, b) multi-peak reconstruction with pre-calibration, and c) multi-peak reconstruction with three-point self-calibration. All IDEAL reconstruction methods show excellent correlation with spectroscopy (Table 1), however, the conventional IDEAL reconstruction underestimates the amount of fat, while both multi-peak reconstruction demonstrate close agreement with spectroscopy. The dashed line represents the line of unity.
Table 1.
Summary of linear regression results from IDEAL and PRESS data, comparing the three IDEAL reconstruction methods (single peak (SP), precalibrated multi-peak and self-calibrated multi-peak) with PRESS. All three methods are highly correlated with PRESS, although precalibrated MP-IDEAL shows the best overall agreement with a slope closest to one.
| r2 | Slope | Intercept | |
|---|---|---|---|
| SP-IDEAL vs PRESS | 0.91 | 0.67±0.04, p<0.001 | 1.02±0.65%, p=0.13* |
| Pre-cal MP-IDEAL vs PRESS | 0.94 | 0.96±0.04, p=0.4* | 1.52±0.71%, p=0.04 |
| Self-cal MP-IDEAL vs PRESS | 0.91 | 0.83±0.05, p=0.001 | 1.76±0.76%, p=0.03 |
indicates no statistically significant difference between the expected value of the slope (1.0) or intercept (0.0).
In all three cases, the IDEAL fat-fraction estimates and PRESS fat-fraction were highly correlated. For the pre-calibrated MP-IDEAL reconstruction, the slope was not significantly different from 1.0 (0.96±0.04, p=0.40), although there was a marginally significant bias at lower fat-fraction values with an intercept of 1.52±0.71% (p=0.04). For self-calibrated MP-IDEAL, both the slope (0.83±0.05, p<0.001) and intercept (1.76±0.76%, p=0.03) were statistically different than the expected values of 1.0 and 0.0, respectively. Although the intercepts for both multi-peak reconstruction methods were close to zero, they were slightly larger than zero with moderate statistical significance. This implies that there is a small but statistically significant bias when measuring fat at low fat-fraction using the three-echo IDEAL reconstruction method used in this work.
Discussion
In this work, we have demonstrated a high degree of correlation between IDEAL fat-fraction measurements and spectroscopy for the quantification of hepatic steatosis in patients with fatty infiltration of the liver. In addition, we have demonstrated the importance of accurate spectral modeling of fat, by modifying the IDEAL signal model to include multiple peaks of fat. Using either a pre-calibrated or self-calibrated multi-peak reconstruction method, excellent correlation between IDEAL and PRESS was observed, with a slope close to one, particularly for the pre-calibrated approach. Although the slope of the self-calibrated method improved performance, statistically it was significantly less than 1.0, indicating that the pre-calibration method provided superior agreement with PRESS than the three-point self-calibrated reconstruction. If one accepts MR spectroscopy as a non-invasive gold standard, this work suggests that IDEAL fat-fraction imaging using pre-calibrated multi-peak reconstruction can also provide accurate quantitative estimates of hepatic steatosis while offering complete volumetric assessment of the liver, which PRESS cannot offer.
It is necessary to remove potential sources of bias when developing quantitative biomarkers that attempts to measure hepatic steatosis, in a manner that is independent of specific imaging parameters. We have utilized approaches to avoid T1 related, as well as noise bias for low fat-fractions(21). In this work, we demonstrated the importance of accurate spectral modeling with multi-peak reconstruction, however, we have ignored the effects of T2* that can cause errors in the estimates of fat-fraction, particularly for short values of T2*. Shortened values of T2* can occur in patients with iron overload, which is common in patients with NAFLD(44, 45). Recently, a modified IDEAL algorithm that incorporates T2* into the IDEAL signal model in order to provide fat-fraction estimates corrected for the effects of T2* was described(22). This work demonstrated the need to acquire at least 6 echoes for optimal separation of water and fat signals with T2* correction, therefore, we did not include the effects of T2* in the fat-fraction measurements in this study. However, future work will explore the use of six (or more) echo acquisitions that allow correction for the effects of both T2* and the multiple spectral peaks of fat. Another publication has recently described related methods for avoiding the effects of T2* with a different multi-echo water-fat separation method(25). In our study, care was taken to avoid patients with known iron overload based on clinical history, serum lab values, and standard imaging sequences (T2 weighted imaging), although no such patients were encountered during recruitment. However, we hypothesize that the effects of T2* were responsible for the very small, but statistically significant bias that occurred at low fat-fractions.
For the PRESS measurements, we reduced T1 related bias in the fat-fraction measurements by choosing a TR (2500ms) about 4–5 times that of liver T1(46). Even though we minimized T2 effects by using the shortest possible TE (25ms), some T2 related bias from PRESS was unavoidable, because the T2 of liver is approximately 50ms(46). PRESS fat-fraction measurements were also biased slightly by the inclusion of the small fat peaks at 47Hz and −23Hz with the water peak measurement. This was unavoidable because the linewidth of a spectrum acquired in such a large voxel caused the water peak to engulf these small peaks, particularly at low fat-fractions. The relative total amplitude of these peaks are 0.14 (40), introducing a small degree of error. All other peaks of fat, however, were included in the fat signal measurement made from the PRESS spectra. Finally, noise bias is not a source of error when measuring fat-fraction from a phase-corrected real spectrum.
In this work, the multi-echo reconstruction relied on the a priori knowledge of the resonance frequencies of the various fat peaks. There are several implicit assumptions made when considering multiple spectral peaks. The spectrum that is observed with the PRESS sequence primarily comes from triglycerides in the tissue, and we have assumed that that fat spectrum measured from subcutaneous tissue is representative of fat in a steatotic liver. Although there are likely to be small differences between the spectral characteristics of triglycerides in different regions of the body, the gross characteristics of these spectra are very similar and differences between them are likely to have minimal impact on fat-fraction measurements. For example, a 20% error in a peak with relative amplitude of 0.1, would result, at most, in an absolute fat-fraction error of 2% in a liver with 20% fat.
Although our results indicate a significant difference between the single peak and multi-peak methods, there was no significant difference between the two multi-peak approaches. Regardless of small potential differences between the pre-calibration spectrum used for the multi-peak reconstruction and the true spectrum, this approach is certainly far more accurate than modeling fat as a signal discrete peak at −210Hz.
The superior performance of the pre-calibrated spectral modeling approach compared to the self-calibrated approach is likely due to the fact that the self-calibrated method only considered the largest three echoes(40). The self-calibrated method uses the different echoes to estimate the relative amplitudes of the fat peaks as independent chemical species. Therefore, an inherent limitation of the self-calibrated approach is that it can only estimate the relative amplitudes of as many peaks as there are echoes, which in this case is three. Thus, the self-calibrated approach likely does not provide as accurate spectral modeling as the pre-calibrated approach. In acquisitions that perform T2* correction, at least 6 echoes are acquired (25, 40). In this situation, all 6 of the fat peaks can be modeled in the self-calibrated approach. Therefore, further investigation into the self-calibrated approach, in comparison to the pre-calibrated method are warranted as part of additional studies that acquire larger numbers of echoes.
The echo times used in this study were based on the echo combination known to maximize SNR performance when fat is modeled as a single peak(30, 32). However, the inclusion of multiple peaks of fat into the signal model will alter this SNR performance slightly and a different combination of echo times may provide better SNR. We expect this effect to be small, because the −210Hz fat peak remains dominant. Fortunately, IDEAL can decompose water and fat signals over a wider range of echo times and small changes result in only slightly degraded SNR performance, without bias or other errors. Future work will perform a Cramér-Rao bound analysis to account for the multiple peaks of fat, to determine the maximum possible SNR performance and which combination of echoes are needed to achieve this upper limit.
Another implicit assumption that was made in this work, as well as by others using MRI fat-fraction as a measure of steatosis, is that the water content of the liver is unaltered by other processes such as inflammation and fibrosis. For example, it is conceivable that as fibrosis progresses, the additional extracellular matrix laid down by hepatic astrocytes could reduce the amount of free water in the liver. This would alter the apparent fat-fraction by reducing the amount of water signal in equation 1. We anticipate that this effect, if it occurs, would happen at later stages of fibrosis when detection and quantification of steatosis may be less clinically relevant. The effect of water content on fat-fraction measurements remains unknown and should be investigated in future studies.
Conclusive validation of fat-fraction measurements with MRI requires correlation with liver biopsy, although imaging-biopsy correlation is logistically more difficult. As discussed above, biopsy suffers from tremendous variability, and raises concerns about its use as a reliable gold standard. We believe that the imaging-spectroscopy correlation performed in this study demonstrates a very promising initial step towards the development and in vivo validation of quantitative biomarkers of hepatic steatosis. Future studies will investigate imaging-biopsy correlation for further validation of these new imaging methods.
Acknowledgments
SBR was supported by an RSNA Scholar Award and is suppoted in part by Support from the UW ICTR, funded through an NIH Clinical & Translational Science Award (1UL1RR025011)
References
- 1.Marchesini G, Brizi M, Bianchi G, et al. Nonalcoholic fatty liver disease: a feature of the metabolic syndrome. Diabetes. 2001;50:1844–1850. doi: 10.2337/diabetes.50.8.1844. [DOI] [PubMed] [Google Scholar]
- 2.Harrison SA, Neuschwander-Tetri BA. Nonalcoholic fatty liver disease and nonalcoholic steatohepatitis. Clin Liver Dis. 2004;8:861–879. ix. doi: 10.1016/j.cld.2004.06.008. [DOI] [PubMed] [Google Scholar]
- 3.Brunt EM. Pathology of nonalcoholic steatohepatitis. Hepatol Res. 2005 doi: 10.1016/j.hepres.2005.09.006. [DOI] [PubMed] [Google Scholar]
- 4.Nanda K. Non-alcoholic steatohepatitis in children. Pediatr Transplant. 2004;8:613–618. doi: 10.1111/j.1399-3046.2004.00241.x. [DOI] [PubMed] [Google Scholar]
- 5.Papandreou D, Rousso I, Mavromichalis I. Update on non-alcoholic fatty liver disease in children. Clin Nutr. 2007;26:409–415. doi: 10.1016/j.clnu.2007.02.002. [DOI] [PubMed] [Google Scholar]
- 6.Wieckowska A, McCullough AJ, Feldstein AE. Noninvasive diagnosis and monitoring of nonalcoholic steatohepatitis: Present and future. Hepatology. 2007;46:582–589. doi: 10.1002/hep.21768. [DOI] [PubMed] [Google Scholar]
- 7.Schwimmer JB. Definitive diagnosis and assessment of risk for nonalcoholic Fatty liver disease in children and adolescents. Semin Liver Dis. 2007;27:312–318. doi: 10.1055/s-2007-985075. [DOI] [PubMed] [Google Scholar]
- 8.Chitturi S, Farrell GC. Etiopathogenesis of nonalcoholic steatohepatitis. Semin Liver Dis. 2001;21:27–41. doi: 10.1055/s-2001-12927. [DOI] [PubMed] [Google Scholar]
- 9.Ludwig J, Viggiano T, DB M, Oh B. Nonalcoholic steatohepatitis: Mayo Clinic experience with a hitherto unnamed disease. Mayo Clin Proc. 1980;55:434–438. [PubMed] [Google Scholar]
- 10.Ratziu V, Charlotte F, Heurtier A, et al. Sampling variability of liver biopsy in nonalcoholic fatty liver disease. Gastroenterology. 2005;128:1898–1906. doi: 10.1053/j.gastro.2005.03.084. [DOI] [PubMed] [Google Scholar]
- 11.Ratziu V, Bonyhay L, Di Martino V, et al. Survival, liver failure, and hepatocellular carcinoma in obesity-related cryptogenic cirrhosis. Hepatology. 2002;35:1485–1493. doi: 10.1053/jhep.2002.33324. [DOI] [PubMed] [Google Scholar]
- 12.Abdi W, Millan JC, Mezey E. Sampling variability on percutaneous liver biopsy. Arch Intern Med. 1979;139:667–669. [PubMed] [Google Scholar]
- 13.Baunsgaard P, Sanchez GC, Lundborg CJ. The variation of pathological changes in the liver evaluated by double biopsies. Acta Pathol Microbiol Scand [A] 1979;87:51–57. doi: 10.1111/j.1699-0463.1979.tb00023.x. [DOI] [PubMed] [Google Scholar]
- 14.Bedossa P, Dargere D, Paradis V. Sampling variability of liver fibrosis in chronic hepatitis C. Hepatology. 2003;38:1449–1457. doi: 10.1016/j.hep.2003.09.022. [DOI] [PubMed] [Google Scholar]
- 15.Labayle D, Chaput JC, Albuisson F, Buffet C, Martin E, Etienne JP. [Comparison of the histological lesions in tissue specimens taken from the right and left lobe of the liver in alcoholic liver disease (author’s transl)] Gastroenterol Clin Biol. 1979;3:235–240. [PubMed] [Google Scholar]
- 16.Maharaj B, Maharaj RJ, Leary WP, et al. Sampling variability and its influence on the diagnostic yield of percutaneous needle biopsy of the liver. Lancet. 1986;1:523–525. doi: 10.1016/s0140-6736(86)90883-4. [DOI] [PubMed] [Google Scholar]
- 17.Olsson R, Hagerstrand I, Broome U, et al. Sampling variability of percutaneous liver biopsy in primary sclerosing cholangitis. J Clin Pathol. 1995;48:933–935. doi: 10.1136/jcp.48.10.933. [DOI] [PMC free article] [PubMed] [Google Scholar]
- 18.Regev A, Berho M, Jeffers LJ, et al. Sampling error and intraobserver variation in liver biopsy in patients with chronic HCV infection. Am J Gastroenterol. 2002;97:2614–2618. doi: 10.1111/j.1572-0241.2002.06038.x. [DOI] [PubMed] [Google Scholar]
- 19.Hussain HK, Chenevert TL, Londy FJ, et al. Hepatic fat fraction: MR imaging for quantitative measurement and display--early experience. Radiology. 2005;237:1048–1055. doi: 10.1148/radiol.2373041639. [DOI] [PubMed] [Google Scholar]
- 20.Qayyum A, Goh JS, Kakar S, Yeh BM, Merriman RB, Coakley FV. Accuracy of liver fat quantification at MR imaging: comparison of out-of-phase gradient-echo and fat-saturated fast spin-echo techniques--initial experience. Radiology. 2005;237:507–511. doi: 10.1148/radiol.2372040539. [DOI] [PubMed] [Google Scholar]
- 21.Liu CY, McKenzie CA, Yu H, Brittain JH, Reeder SB. Fat quantification with IDEAL gradient echo imaging: Correction of bias from T(1) and noise. Magn Reson Med. 2007;58:354–364. doi: 10.1002/mrm.21301. [DOI] [PubMed] [Google Scholar]
- 22.Yu H, McKenzie CA, Shimakawa A, et al. Multiecho reconstruction for simultaneous water-fat decomposition and T2* estimation. J Magn Reson Imaging. 2007;26:1153–1161. doi: 10.1002/jmri.21090. [DOI] [PubMed] [Google Scholar]
- 23.Bernard CP, Liney GP, Manton DJ, Turnbull LW, Langton CM. Comparison of fat quantification methods: a phantom study at 3.0T. J Magn Reson Imaging. 2008;27:192–197. doi: 10.1002/jmri.21201. [DOI] [PubMed] [Google Scholar]
- 24.Kim H, Taksali SE, Dufour S, et al. Comparative MR study of hepatic fat quantification using single-voxel proton spectroscopy, two-point dixon and three-point IDEAL. Magn Reson Med. 2008;59:521–527. doi: 10.1002/mrm.21561. [DOI] [PMC free article] [PubMed] [Google Scholar]
- 25.Bydder M, Yokoo T, Hamilton G, et al. Relaxation effects in the quantification of fat using gradient echo imaging. Magn Reson Imaging. 2008;26:347–359. doi: 10.1016/j.mri.2007.08.012. [DOI] [PMC free article] [PubMed] [Google Scholar]
- 26.Brix G, Heiland S, Bellemann ME, Koch T, Lorenz WJ. MR imaging of fat-containing tissues: valuation of two quantitative imaging techniques in comparison with localized proton spectroscopy. Magn Reson Imaging. 1993;11:977–991. doi: 10.1016/0730-725x(93)90217-2. [DOI] [PubMed] [Google Scholar]
- 27.Fishbein MH, Gardner KG, Potter CJ, Schmalbrock P, Smith MA. Introduction of fast MR imaging in the assessment of hepatic steatosis. Magn Reson Imaging. 1997;15:287–293. doi: 10.1016/s0730-725x(96)00224-x. [DOI] [PubMed] [Google Scholar]
- 28.Thomsen C, Becker U, Winkler K, Christoffersen P, Jensen M, Henriksen O. Quantification of liver fat using magnetic resonance spectroscopy. Magn Reson Imaging. 1994;12:487–495. doi: 10.1016/0730-725x(94)92543-7. [DOI] [PubMed] [Google Scholar]
- 29.Wong WF, Northrup SR, Herrick RC, Glombicki AP, Wood RP, Morrisett JD. Quantitation of lipid in biological tissue by chemical shift magnetic resonance imaging. Magn Reson Med. 1994;32:440–446. doi: 10.1002/mrm.1910320403. [DOI] [PubMed] [Google Scholar]
- 30.Reeder SB, McKenzie CA, Pineda AR, et al. Water-fat separation with IDEAL gradient-echo imaging. J Magn Reson Imaging. 2007;25:644–652. doi: 10.1002/jmri.20831. [DOI] [PubMed] [Google Scholar]
- 31.Reeder SB, Pineda AR, Wen Z, et al. Iterative decomposition of water and fat with echo asymmetry and least-squares estimation (IDEAL): application with fast spin-echo imaging. Magn Reson Med. 2005;54:636–644. doi: 10.1002/mrm.20624. [DOI] [PubMed] [Google Scholar]
- 32.Pineda AR, Reeder SB, Wen Z, Pelc NJ. Cramer-Rao bounds for three-point decomposition of water and fat. Magn Reson Med. 2005;54:625–635. doi: 10.1002/mrm.20623. [DOI] [PubMed] [Google Scholar]
- 33.Lu W, Reeder S, Daniel B, Hargreaves B. Chemical Shift Correction in Bipolar Multi-Echo Sequences for Water and Fat Separation; The International Society of Magnetic Resonance 15th Meeting, Book of Abstracts; 2007. p. 1622. [Google Scholar]
- 34.Yu H, Reeder S, Shimakawa A, Gold G, Pelc N, Brittain J. Implementation and Noise Analysis of Chemical Shift Correction for Fast Spin Echo Dixon Imaging; The International Society of Magnetic Resonance 12th Meeting; 2004. p. 2686. [Google Scholar]
- 35.Reeder SB, Wen Z, Yu H, et al. Multicoil Dixon chemical species separation with an iterative least-squares estimation method. Magn Reson Med. 2004;51:35–45. doi: 10.1002/mrm.10675. [DOI] [PubMed] [Google Scholar]
- 36.Hernando D, Haldar JP, Sutton BP, Ma J, Kellman P, Liang ZP. Joint estimation of water/fat images and field inhomogeneity map. Magn Reson Med. 2008;59:571–580. doi: 10.1002/mrm.21522. [DOI] [PMC free article] [PubMed] [Google Scholar]
- 37.Lu W, Hargreaves BA. Multiresolution field map estimation using golden section search for water-fat separation. Magn Reson Med. 2008;60:236–244. doi: 10.1002/mrm.21544. [DOI] [PubMed] [Google Scholar]
- 38.Reeder SB, Brittain JH, Grist TM, Yen YF. Least-squares chemical shift separation for (13)C metabolic imaging. J Magn Reson Imaging. 2007;26:1145–1152. doi: 10.1002/jmri.21089. [DOI] [PubMed] [Google Scholar]
- 39.Levin YS, Mayer D, Yen YF, Hurd RE, Spielman DM. Optimization of fast spiral chemical shift imaging using least squares reconstruction: application for hyperpolarized (13)C metabolic imaging. Magn Reson Med. 2007;58:245–252. doi: 10.1002/mrm.21327. [DOI] [PubMed] [Google Scholar]
- 40.Yu H, Shimakawa A, McKenzie CA, Brodsky E, Brittain JH, Reeder SB. Multiecho water-fat separation and simultaneous R2* estimation with multifrequency fat spectrum modeling. Magn Reson Med. 2008;60:1122–1134. doi: 10.1002/mrm.21737. [DOI] [PMC free article] [PubMed] [Google Scholar]
- 41.Cui M, Tomuta V, Segal-Isaacson C, Stein D, Hwang J. Abdominal fat measurement: MRS vs. MRI; The International Society of Magnetic Resonance 16th Meeting, Book of Abstracts; 2008. p. 866. [Google Scholar]
- 42.Bottomley PA. Spatial localization in NMR spectroscopy in vivo. Ann N Y Acad Sci. 1987;508:333–348. doi: 10.1111/j.1749-6632.1987.tb32915.x. [DOI] [PubMed] [Google Scholar]
- 43.Reeder S, Robson P, Agni R, et al. Quantification of Hepatic Steatosis with IDEAL-SPGR: Correlation with PRESS Spectroscopy and Biopsy; The International Society of Magnetic Resonance 15th Meeting, Book of Abstracts; 2007. p. 220. [Google Scholar]
- 44.George DK, Goldwurm S, MacDonald GA, et al. Increased hepatic iron concentration in nonalcoholic steatohepatitis is associated with increased fibrosis. Gastroenterology. 1998;114:311–318. doi: 10.1016/s0016-5085(98)70482-2. [DOI] [PubMed] [Google Scholar]
- 45.Bonkovsky HL, Jawaid Q, Tortorelli K, et al. Non-alcoholic steatohepatitis and iron: increased prevalence of mutations of the HFE gene in non-alcoholic steatohepatitis. J Hepatol. 1999;31:421–429. doi: 10.1016/s0168-8278(99)80032-4. [DOI] [PubMed] [Google Scholar]
- 46.de Bazelaire CM, Duhamel GD, Rofsky NM, Alsop DC. MR imaging relaxation times of abdominal and pelvic tissues measured in vivo at 3.0 T: preliminary results. Radiology. 2004;230:652–659. doi: 10.1148/radiol.2303021331. [DOI] [PubMed] [Google Scholar]


