Abstract
Purpose
To investigate degradation kinetics of oxytocin as a function of temperature and pH, and identify the degradation products.
Materials and Methods
Accelerated degradation of oxytocin formulated at pH 2.0, 4.5, 7.0 and 9.0 was performed at 40, 55, 70 and 80°C. Degradation rate constants were determined from RP-HPLC data. Formulations were characterized by HP-SEC, UV absorption and fluorescence spectroscopy. Degradation products were identified by ESI-MS/MS.
Results
The loss of intact oxytocin in RP-HPLC was pH- and temperature-dependent and followed (pseudo) first order kinetics. Degradation was fastest at pH 9.0, followed by pH 7.0, pH 2.0 and pH 4.5. The Arrhenius equation proved suitable to describe the kinetics, with the highest activation energy (116.3 kJ/mol) being found for pH 4.5 formulations. At pH 2.0 deamidation of Gln4, Asn5, and Gly9-NH2, as well as combinations thereof were found. At pH 4.5, 7.0 and 9.0, the formation of tri- and tetrasulfide-containing oxytocin as well as different types of disulfide and dityrosine-linked dimers were found to occur. Beta-elimination and larger aggregates were also observed. At pH 9.0, mono-deamidation of Gln4, Asn5, and Gly9-NH2 additionally occurred.
Conclusions
Multiple degradation products of oxytocin have been identified unequivocally, including various deamidated species, intramolecular oligosulfides and covalent aggregates. The strongly pH dependent degradation can be described by the Arrhenius equation.
KEY WORDS: aggregation, Arrhenius kinetics, degradation, mass spectrometry, oxytocin
INTRODUCTION
Oxytocin is a nonapeptidic hormone that is released from the posterior lobe of the pituitary gland of the hypothalamus. Therapeutically, it is used to induce or stimulate labor (1) and to prevent post-partum hemorrhage, which is a major cause of birth related maternal deaths in developing countries (2). In 1993 and 1994, the World Health Organization (WHO) supported a number of studies which demonstrated that oxytocin loses potency in field conditions, in particular in tropical climates (3,4). Prompted by the WHO, a program was initiated recently by Top Institute Pharma (The Netherlands) entitled: Hot medicines—breaking the cold chain requirement for polypeptide-based priority medicines. The principal aim of this project is the rapid development of heat-stable oxytocin formulations in addition to several other peptide/protein-based priority medicines for diseases including hepatitis B, diabetes and influenza. Integral to this work is the development of new analytical methods.
In order to be able to apply a scientific and intelligent approach to formulation development, a thorough knowledge of drug stability and degradation pathways is essential. Currently, there are only limited data available on oxytocin degradation and stability, despite oxytocin being a well-known and extensively studied peptide hormone. Almost 30 years ago, it was shown by Nachtmann et al. (1981) that oxytocin is most stable between pH 3 and 5, but only limiting data on degradation kinetics were given (5). In the following years, no relevant publications on degradation kinetics and pathways of oxytocin were published.
Because of the role oxytocin plays in the function of the central nervous system, research on its clinical application to treat anxiety- and depression-related diseases, as well as several neuropsychiatric disorders, including autism, obsessive-compulsive disorder, eating disorders and addiction is ongoing (6,7). These new fields of application might also require new and innovative oxytocin formulations.
Oxytocin consists of a six amino acid ring (Cys1, Tyr2, Ile3, Gln4, Asn5, Cys6) and a tail of three amino acids (Pro7, Leu8, Gly9-NH2). Asn5 and Tyr2 are the key moieties required for proper function at the active site of the uterine receptor and Ile3, Gln4, Pro7 and Leu8 are important for receptor binding (8). Any changes in the structure caused by chemical or physical instabilities can lead to loss of affinity to the receptor and/or altered biological activity. From an inspection of the amino acid sequence and chemical structure of oxytocin several sites are evident, which could be susceptible to degradation via deamidation, oxidation or thiol exchange. Gln4 and Asn5 within the macrocycle and the amidated C-terminal amino acid Gly9-amide are predisposed to deamidation. Under acidic conditions deamidation occurs mainly via acid catalyzed hydrolysis, i.e. RCONH2 ⇒ RCOOH (9). Hydrolysis at low pH can also cause fragmentation. Under neutral and alkaline conditions, deamidation proceeds via the formation of cyclic imide intermediates (9–11). Tyr2 and Cys1,6 are susceptible to oxidation, activated for example by the presence of oxygen, light and/or metal ions. A further consideration for oxytocin is the stability of its Cys1-Cys6 disulfide bridge with respect to thiol exchange. At neutral and alkaline conditions this occurs via nucleophilic attack of free thiolate on one of the sulfur atoms within the disulfide bridge. At low pH the disulfide exchange progresses via a sulfenium cation, formed following protonation of the disulfide bridge (9,12). In either case disulfide exchange can result in dimerization and progressive aggregation. Surprisingly, there is no detailed information about oxytocin degradation in therapeutic formulations available in the literature; this provoked us to undertake the study presented herein.
Our first objective was to analyze the kinetics of oxytocin degradation as a function of pH and temperature, an important step towards being able to predict the long-term stability of oxytocin at relevant storage temperatures. The second aim was to identify the degradation products and obtain insights into the degradation pathways, which would facilitate the rational design of heat-stable oxytocin formulations. In order to be able to identify and separate the various degradation products an optimized gradient RP-HPLC method was developed, based on the European Pharmacopoeia (13) and on the isocratic method described by Chaibva and Walker (14). In combination with high-resolution mass spectrometry, this enabled the identification of the main degradation products and provided mechanistic insight into the pathways leading to oxytocin degradation.
MATERIALS AND METHODS
Materials
Oxytocin acetate powder (Diosynth, Oss, The Netherlands) was dissolved in 50 mM phosphate buffer pH 2.0, 4.5, 7.0 and 9.0. The exact concentration was determined by UV absorption spectroscopy, using an extinction coefficient at 280 nm of 1.52 ml mg−1 cm−1 based on Gill and Hippel (15). The formulation buffers were prepared at a concentration of 50 mM using NaH2PO4*2H2O (Fluka, Zwijndrecht, The Netherlands), Na2HPO4*2H2O (Fluka, Zwijndrecht, The Netherlands) and ortho-phosphoric acid (Merck, Amsterdam, The Netherlands). All buffers were filtered through 0.2 μm pore PES-filters (Millipore, Amsterdam, The Netherlands). For HPLC analytics, HPLC grade acetonitrile (ACN) and formic acid were used.
Accelerated Stability Study of Oxytocin
Oxytocin was formulated at a concentration of 0.1 mg/ml in 50 mM phosphate at each of pH 2.0, 4.5, 7.0 and 9.0. About 9 ml of each formulation were stored in 10R glass type I vials either at 40°C in a stove or at 55°C, 70°C or 80°C in water baths of constant temperature. To study the concentration dependency of oxytocin degradation, control experiments at 70°C were performed for all pH conditions at oxytocin concentrations of 0.02, 0.1 and 0.5 mg/ml. The extent of degradation in each case was quantified by monitoring the disappearance of the main peak by RP-HPLC corresponding to oxytocin. During the stability studies the pH values of the formulations were controlled. They remained within ±0.1 pH units for pH 2.0, 7.0 and 9.0 formulations, and within ±0.2 pH units for pH 4.5 formulations.
UV Absorption Spectroscopy
UV spectroscopy was performed with an Agilent 8453 UV/VIS spectrometer (Agilent, Waldbronn, Germany). Two ml of the oxytocin solutions were measured in quartz cuvettes with a path length of 10 mm and the particular buffer spectrum subtracted. Spectra were recorded from 240 to 340 nm.
Fluorescence Spectroscopy
Steady state fluorescence spectra were measured with an FS920 fluorescence spectrometer (Edinburgh Instruments, Edinburgh, Scotland) in 96-well plates. To detect the formation of dityrosine, the undiluted formulations were measured using an excitation wavelength of 340 nm, emission and excitation slits of 5 nm, a dwell time of 0.5 s, steps of 0.5 nm and a cumulative addition of two scans for each spectrum. The spectra were corrected by subtracting the buffer spectra, measured under the same conditions.
Reversed Phase High Pressure Liquid Chromatography (RP-HPLC)
RP-HPLC was performed using an Alltima C18 RP-column, 5 μm particle size, inner diameter of 4.6 mm and length of 150 mm (Alltech, Ridderkerk, Netherlands), a Waters 600 controller with gradient pump, a Waters 717 autosampler, a Waters 2487 UV detector and helium sparge equipment (Waters, Milford Massachusetts, USA). Twenty μl of the samples were injected and the measurements were performed at a flow rate of 1.0 ml/min and UV detection at 220 nm and 280 nm. Gradient elution with 15% (v/v) ACN in 65 mM phosphate buffer pH 5.0 as solvent A and 60% (v/v) acetonitrile in 65 mM phosphate buffer pH 5.0 as solvent B was used. Within the gradient the ACN concentration was linearly increased from 15% at the beginning, to 20% at 10 min, to 30% at 20 min and finally to 60% at 25 min. Subsequently, the ACN concentration was lowered to 15% within 0.1 min and equilibrated for 10 min prior to the next injection. To determine the oxytocin concentration by RP-HPLC, a calibration curve with three oxytocin standards of known concentration (0.05, 0.1 and 0.15 mg/ml oxytocin when analyzing 0.1 mg/ml OT formulations) determined by UV absorption spectroscopy was prepared. Precision, linearity, limit of detection and limit of quantification of the method were determined according to the ICH guideline (16).
Size Exclusion HPLC (HP-SEC)
Size exclusion chromatography was performed using a Superdex peptide 10/300 GL column (GE Healthcare Inc., Brussels, Belgium) on an isocratic HPLC system with a Waters 515 pump, a Waters 717 plus autosampler, a Waters 474 fluorescence detector (Waters, Milford Massachusetts, USA) and a Shimadzu SPD UV/Vis detector (Shimadzu, Tokyo, Japan). Fifty μl were injected and separation was performed at a flow rate of 0.5 ml/min. Peaks were detected by UV absorption at 274 nm, as well as fluorescence detection working with an excitation wavelength of 274 nm and emission wavelength of 310 nm. Different mobile phases were evaluated for the separation: 50 mM phosphate with 150 mM NaCl, pH 2.0 or 5.0, and 30% ACN with 70% 0.04 M formic acid.
High Resolution Mass Spectrometry (MS)
All MS experiments were conducted in positive ion mode on a LTQ Orbitrap XL (Thermo Scientific, Bremen, Germany). For MS/MS experiments a normalized collision energy of 35% was used, the activation time was set to 30 ms and the activation parameter q = 0.25. RP-HPLC with UV and MS detection (LC-UV-MS) was performed on a Shimadzu Prominence LC-20A HPLC system equipped with an UV/VIS SPD-20A detector (Shimadzu Corporation, Kyoto, Japan) and an Alltima C18 RP-column, 5 μm particle size, inner diameter of 4.6 mm and length of 150 mm (Alltech, Ridderkerk, Netherlands). The HPLC system was coupled to a LTQ Orbitrap mass spectrometer equipped with an Ion Max electrospray ion source (Thermo Scientific, Bremen, Germany). The measurements were performed at a flow rate of 1.0 ml/min, which was split in a 33:67 ratio to the UV detector and the ESI-MS. The injection volume was 20 μl for all runs.
Gradient elution was done with 15% (v/v) ACN in 50 mM ammonium acetate pH 5.0 as solvent A and 60% (v/v) ACN in 50 mM ammonium acetate pH 5.0 as solvent B. The ACN concentration was linearly increased from 15% at 0 min, to 20% at 10 min, to 30% at 25 min and finally to 60% at 35 min. Subsequently, the ACN concentration was lowered to 15% within 0.1 min and equilibrated for 10 min prior to the next injection.
MS data were collected in data-dependent mode using Xcalibur 2.07 software. The precursor ion scan spectra (m/z 300–2,000) were acquired with a resolution of 30,000 at 400 m/z. The most abundant ions were isolated and fragmented in the linear ion trap by collisionally induced dissociation. The resulting fragmentation spectra were recorded with a LTQ detector. The instrument was calibrated externally according to the instructions of the manufacturer. The UV signal at 220 nm of the HPLC effluent was recorded using LCsolutions software version 1.22 (Shimadzu Corporation, Kyoto, Japan).
Direct infusion MS analysis of fractions from HP-SEC and RP-HPLC analysis was performed using a TriVersa NanoMate robot (Advion BioSystems Inc., Ithaca NY, USA). The precursor ion scan spectra (m/z 300–2,000) were acquired with resolution 100,000 at 400 m/z and MS/MS spectra with resolution 30,000. Fractions from RP-HPLC were analyzed as collected and after a reduction step. Reduction was performed by adding 10 mM dithiothreitol (DTT) in 200 mM ammonium bicarbonate for 10 min at room temperature. DTT was removed by solid phase extraction using 200 μl C18 Stage Tips (Proxeon, Odense, Denmark), wetted with 50% methanol/0.1% formic acid. The samples were loaded to the wetted Stage Tips, washed with 0.1% formic acid and eluted in 50% methanol/0.1% formic acid.
RESULTS AND DISCUSSION
Temperature- and pH-dependent Oxytocin Degradation Kinetics
To study oxytocin degradation a new gradient RP-HPLC method has been set-up based on the European Pharmacopoeia (13) and the isocratic method described by Chaibva and Walker (14). The validation showed that the limit of detection of the developed method for oxytocin was 0.7 ng and the limit of quantification 1.4 ng, when using the conditions as described in Materials and Methods. Linearity was given from 0.01 to 1.0 mg/ml when working with an injection volume of 20 μl. The relative standard deviation over a concentration range of 0.01 to 0.1 mg/ml was below 0.5% for measurements performed during the same day, and the day-to-day variation was less than 1.0%.
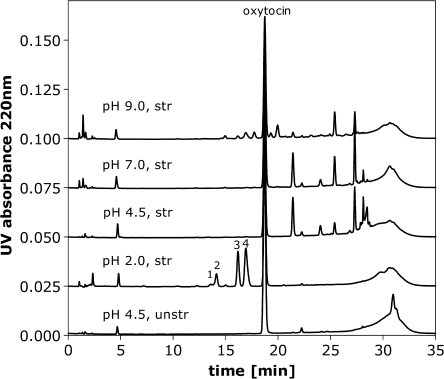
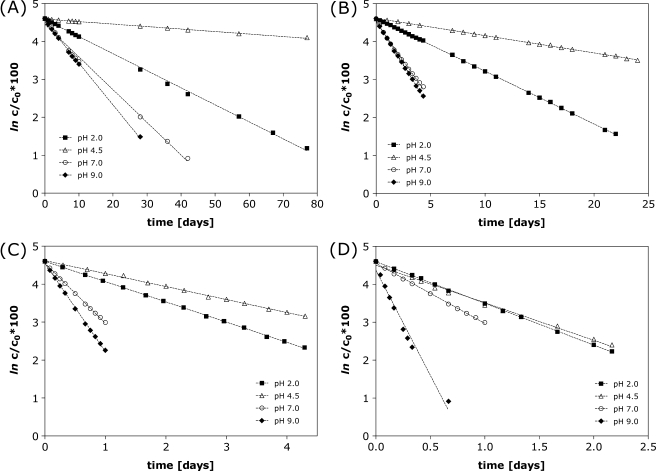
The impact of temperature and formulation pH on oxytocin degradation was studied, by monitoring the decrease in the area of the oxytocin peak (detection 220 nm) by RP-HPLC with respect to time. Temperatures included in the study were 40, 55, 70 and 80°C for 0.1 mg/ml oxytocin formulated in 50 mM phosphate at each of pH 2.0, 4.5, 7.0 and 9.0. Under these conditions adsorption of oxytocin to the glass vials was not observed and the loss of the oxytocin main peak could be ascribed to degradation. Depending on the formulation pH different degradation products were observed by RP-HPLC (Fig. 1). Interestingly, the disappearance of the oxytocin peak in RP-HPLC appeared to be (pseudo) first order kinetics at each pH, although various degradation products were formed. The (pseudo) first order kinetics can be seen from the linear relationship of ln c/c0 *100 versus time in Fig. 2. The slope of each linear fit (where r2 > 0.99) was determined as the observed degradation rate constant kobs from which the half life t1/2 in days was calculated (Table I). As expected, the observed t1/2 decreased with increasing incubation temperature. The oxytocin formulation at pH 4.5 was most stable at all temperatures.
Fig. 1.
Example RP-HPLC chromatograms of 0.1 mg/ml oxytocin standard and stressed formulations in 50 mM phosphate buffer pH 2.0, 4.5, 7.0 and 9.0 (UV signal at 220 nm) analyzed with mobile phase of ACN and phosphate buffer. The peaks eluting before 5 min are not related to oxytocin, but to the buffer.
Fig. 2.
Degradation of oxytocin over time at 40°C (A), 55°C (B), 70°C (C) and 80°C (D) for formulations with 0.1 mg/ml oxytocin at pH 2.0, 4.5, 7.0 and 9.0 determined by RP-HPLC. Linear fitting (where r2 > 0.99) showed the first order kinetics, with the slope of the resulting straight lines representing the degradation rate constant, kobs.
Table I.
Observed Degradation Rate Constants Kobs (n = 3) Derived from ln-plots of the Loss of the Main Oxytocin Peak in RP-HPLC from 0.1 mg/ml Oxytocin Formulations Over Time (r2 > 0.99) and t1/2 Calculated as ln2/kobs
| kobs at 40°C [day−1] | t1/2 at 40°C [days] | kobs at 55°C [day−1] | t1/2 at 55°C [days] | kobs at 70°C [day−1] | t1/2 at 70°C [days] | kobs at 80°C [day−1] | t1/2 at 80°C [days] | |
|---|---|---|---|---|---|---|---|---|
| pH 2.0 | 0.033 | 21.0 | 0.139 | 5.0 | 0.637 | 1.1 | 1.153 | 0.6 |
| pH 4.5 | 0.006a | 115.5b | 0.046 | 15.1 | 0.367b | 1.9b | 1.079a | 0.6a |
| pH 7.0 | 0.080 | 8.7 | 0.438 | 1.6 | 1.606 | 0.4 | 3.594a | 0.2a |
| pH 9.0 | 0.096a | 7.2a | 0.479 | 1.4 | 2.212a | 0.3a | 5.913 | 0.1 |
The relative standard deviation of three independent degradation experiments was below 5% if not marked otherwise in the table
aRelative standard deviation below 10%
bRelative standard deviation below 15%
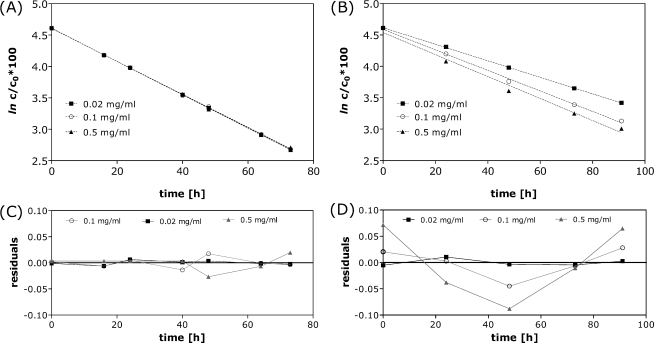
The degradation of oxytocin as a function of concentration was tested at 70°C for oxytocin formulated at 0.02 mg/ml, 0.1 mg/ml and 0.5 mg/ml over the pH range of 2.0 to 9.0. At pH 2.0 the degradation rate constant was clearly concentration independent (kobs of 0.63 day−1) and (pseudo) first order kinetics were found for all concentrations (Fig. 3A). However, for oxytocin formulations of pH 4.5, 7.0 and 9.0 the degradation rates increased with the concentration. This was particularly obvious for pH 4.5 formulations (Fig. 3B), for which kobs was 0.314 day−1 at 0.02 mg/ml, 0.391 day−1 at 0.1 mg/ml and 0.420 day−1 at 0.5 mg/ml. For the highest concentration of 0.5 mg/ml deviation from (pseudo) first order kinetics was evident. This was made more apparent by plotting the residuals of the linear fits (Fig. 3 C,D). A possible explanation for the concentration dependency of the degradation rate constants is that at higher concentrations aggregation competes with other degradation pathways as the dominant mechanism. Aggregation involves the interaction of at least two molecules and its progression is generally accelerated at higher concentrations. Evidence for the presence of aggregates in heat-stressed formulations is discussed later. Commercial oxytocin formulations maximally contain 10 I.U/ml, about 0.015 mg/ml for which aggregation is not likely to occur.
Fig. 3.
Concentration dependency of degradation over time at 70°C for formulations containing 0.02 mg/ml, 0.1 mg/ml and 0.5 mg/ml oxytocin at pH 2.0 (A) and pH 4.5 (B) determined by RP-HPLC and the residuals of the linear fit for pH 2.0 (C) and pH 4.5 (D).
For the formulations containing 0.1 mg/ml oxytocin we determined whether the relationship between the observed degradation rate constant kobs and the temperature obeys the Arrhenius equation (1),
 |
1 |
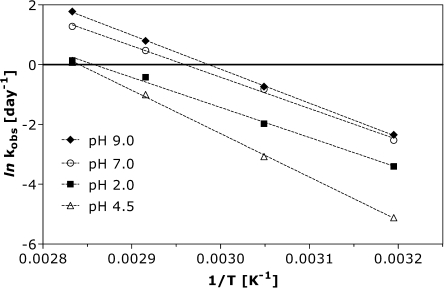
where kobs is the degradation rate constant in [day−1], A is the pre-exponential factor [day−1], Ea is the activation energy in [J mol−1], R the molar gas constant (8.314472 J K−1 mol−1) and T the temperature in [K]. For all formulations studied, the Arrhenius equation provides a good description of oxytocin degradation, as is evident from the linearity (r2 > 0.99) of the plots of ln kobsversus 1/T (Fig. 4).
Fig. 4.
Arrhenius plot for 0.1 mg/ml oxytocin formulations at pH 2.0, 4.5, 7.0 and 9.0 calculated from the data of Fig. 2.
The activation energy (Ea) for oxytocin degradation was calculated using equation (2).
 |
2 |
where m is the slope of the Arrhenius plot [K] and R the molar gas constant [8.314472 J K−1 mol−1].
For pH 4.5 the highest activation energy of 116.3 kJ/mol was calculated. Our finding that oxytocin degradation is slowest at pH 4.5 is in good agreement with the described stability optimum of oxytocin, i.e. in the pH range between 3 and 5 (5). We compared our results with data on oxytocin degradation available in the WHO report “Stability of injectable oxytocics in tropical climates” (4). Therein, the stability of commercial oxytocin preparations (10 and 5 IU/ml, corresponding to about 15 and 7.5 μg/ml, respectively formulated at pH 4.0–5.0) was monitored at 4, 21, 30, 40 and 50°C for 2 years by RP-HPLC (4). The WHO data also pointed at (pseudo) first order kinetics for oxytocin degradation. Our analysis of these published data yielded activation energies of 128 ± 3.8 kJ/mol for 10 IU/ml and 116 ± 5.4 kJ/mol for 5 IU/ml oxytocin, in excellent agreement with the value obtained for our formulation at pH 4.5 (116.3 kJ/mol). The WHO data indicate that Arrhenius behavior can also be assumed for oxytocin degradation below 40°C. These findings can facilitate future formulation development, as the Arrhenius behavior will allow extrapolation of the degradation kinetics from accelerated stability testing to lower storage temperatures.
Characterization of Stressed Oxytocin Formulations by UV Absorption and Fluorescence Spectroscopy
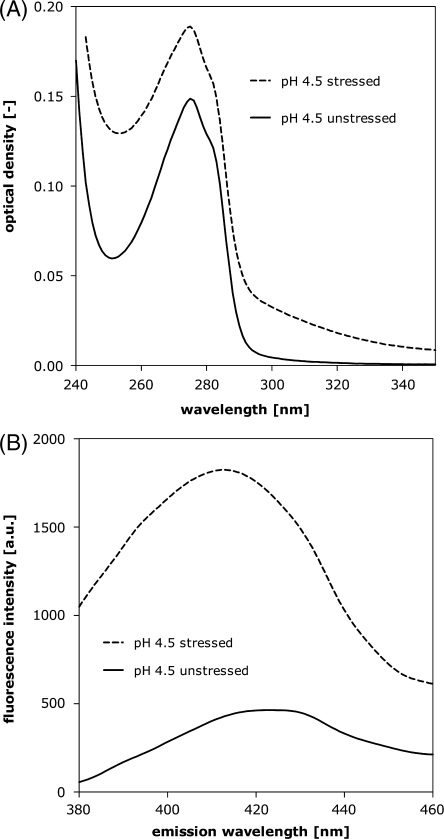
In UV spectroscopy, the formation of aggregates in oxytocin formulations can be monitored by an overall increase in optical density. This was the case for heat stressed oxytocin formulations and was particularly obvious for oxytocin formulated at pH 4.5, 7.0 and 9.0. An example is given in Fig. 5A for oxytocin formulated at pH 4.5. The increase in optical density can be attributed to light scattering because of the presence of large aggregates. In addition, the increase in optical density around 320 to 350 nm might in part be due to the presence of dityrosine (dimeric) species (17). Dityrosine formation was further confirmed by fluorescence spectroscopy. Upon excitation of the stressed pH 4.5, 7.0 and 9.0 formulations at 340 nm, fluorescence emission could be measured with a maximum at 410 nm, exemplarily shown for a stressed pH 4.5 formulation (Fig. 5B). The excitation spectrum was also found to vary as a function of pH (not shown). This is in line with behavior that has previously been reported for dityrosine (17).
Fig. 5.
UV absorption spectrum (A) and fluorescence emissions spectrum after excitation at 340 nm (B) of 0.1 mg/ml oxytocin pH 4.5 unstressed and stressed for 48 h at 70°C.
Oxytocin Aggregation Analyzed by HP-SEC
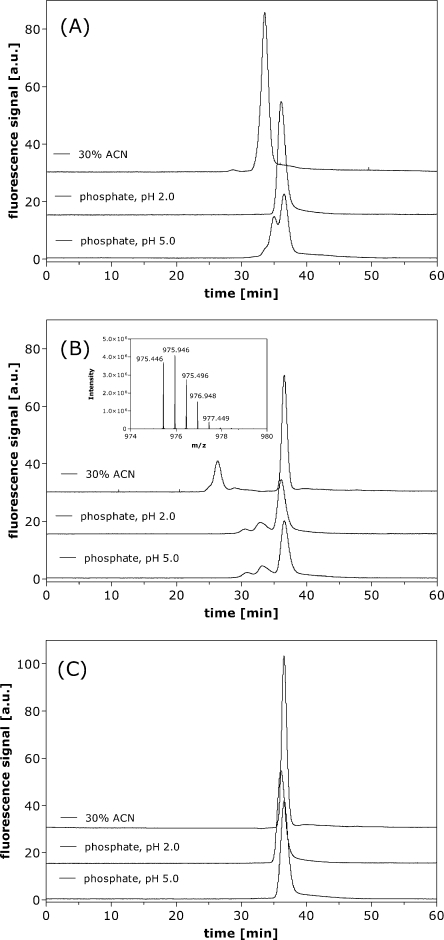
In HP-SEC the pH of the mobile phase was shown to influence significantly the separation of oxytocin in certain stressed formulations. This was particularly obvious for the stressed pH 2.0 oxytocin formulation (Fig. 6A). When using a mobile phase with a pH of 5.0, two shoulders were eluting prior to the monomer peak. RP-HPLC analysis of these fractions could assign those to deamidated oxytocin i.e. they corresponded to the peaks eluting prior to the oxytocin peak in RP-HPLC. This indicates that the separation with a mobile phase of pH 5.0 was not only based on size, but also on interactions of chemically changed oxytocin molecules with the agarose/dextran column material. When lowering the pH of the mobile phase to 2.0, only one peak was evident by HP-SEC for stressed pH 2.0 formulations. Fractionation of the HP-SEC chromatogram and analysis by RP-HPLC proved that monomeric oxytocin and the deamidated species co-elute in HP-SEC under acidic conditions. This behavior might be explained as an effect of electrostatic interactions between the deamidated peptides and the column. At pH 2.0, the carboxylic acids in deamidated oxytocin are protonated and the overall charge of the molecule is zero, whereas at pH 5.0, the deamidated species will carry a negative charge. For stressed pH 4.5 (Fig. 6B), 7.0 and 9.0 oxytocin formulations and for all unstressed formulations (Fig. 6C) the pH of the mobile phase had less influence on separation by HP-SEC. Higher molecular weight species were eluting prior to the monomer peak independent of the pH of the mobile phase, as shown for a stressed oxytocin formulation of pH 4.5 in Fig. 6B. The best separation could be achieved when using a mobile phase consisting of 30% ACN and 70% 0.04 M formic acid. In order to prove that the separation was based on size, fractions were collected from HP-SEC and analyzed by mass spectrometry. In this way, the main peak eluting at 36 min in HP-SEC could be attributed to oxytocin monomer ([M + H]+, m/z = 1,007.44). The HP-SEC UV peak at 26 min was shown to correspond to oxytocin dimers with a mass of 1,950.892 Da (charge 2+, m/z = 975.446) (see insert in Fig. 6B). The nature of the dimers is discussed later in this publication.
Fig. 6.
HP-SEC chromatograms of 0.1 mg/ml oxytocin formulations at pH 2.0 stressed for 24 h at 70°C (A) and at pH 4.5 for 48 h at 70°C (B) and an unstressed pH 4.5 formulation (C) analyzed with three mobile phases: 50 mM phosphate, 150 mM NaCl pH 5.0; idem pH 2.0; and 30% ACN, 70% 0.04 M formic acid. Insert shows the MS results of the dimer peak measured after fractionation.
Mass Spectrometric Identification of Oxytocin Degradation Products
High resolution ESI-MS and ESI-MS/MS were used to identify the oxytocin degradation products observed by RP-HPLC. The analyses were carried out on purified fractions corresponding to each of the major degradation peaks for pH 2.0, as well as by LC-coupled mass spectrometry for pH 4.5, 7.0 and 9.0 formulations. Simulation of the isotope patterns and calculation of the expected masses were done to verify our assignments.
A number of different degradation mechanisms are suggested to operate when oxytocin is subjected to thermal stress, mainly depending upon the formulation pH. In the stressed pH 2.0 formulations, the four main degradation peaks eluting before the oxytocin main peak in RP-HPLC (labeled 1–4 in Fig. 1) could be identified as various deamidated oxytocin species. Oxytocin contains three possible deamidation sites: the C-terminal amidated Gly9, as well as Asn5 and Gln4 in the cyclic portion of the molecule. One deamidation reaction (R-CONH2 → R-COOH) corresponds to a mass difference of +0.985 Da. Given differences in m/z relative to the parent ion of +0.985 for peaks 3 and 4 and +1.970 for peaks 1 and 2, the compounds were assigned as mono and bis-deamidated oxytocin, respectively.
In order to be able to elucidate the site(s) of deamidation within oxytocin, the individual RP-HPLC peak fractions were collected. The samples were then reduced with DTT to cleave the disulfide linkage, subjected to solid-phase extraction and analyzed using ESI-MS/MS. By the reduction the oxytocin molecule is linearized enabling a better identification of the fragmentation ions formed in MS/MS. From the fragmentation patterns, it was possible to show that peak 1 corresponded to Asn5 and Gly9-NH2 deamidation, peak 2 to Gln4 and Gly9-NH2 deamidation, peak 3 to Gln4 deamidation and peak 4 to deamidation at Gly9-NH2. A summary of the fragmentation ions and the analysis is shown in Table II.
Table II.
Identification of Deamidation sites by MS and MS/MS in RP-HPLC Peak Fractions of Heat Stressed Oxytocin Formulations of pH 2.0
| Peak | MS ion [m/z] | Key fragment ions [m/z] | |||
|---|---|---|---|---|---|
| b6-NH3a | y5 ionb | b4 ionc | Deamidation site | ||
| 1 (13.7 min) | 1,011.13 | 709.231 | 504.211 | 508.221 | Asn6 and Gly9 |
| 2 (14.2 min) | 1,011.40 | 709.232 | 503.227 | 509.205 | Gln4 and Gly9 |
| 3 (16.2 min) | 1,010.44 | 709.231 | 502.243 | 509.205 | Gln4 |
| 4 (16.9 min) | 1,010.44 | 708.248 | 503.227 | 508.221 | Gly9 |
| oxytocin (18.8 min) | 1,009.46 | 708.248 | 502.243 | 508.221 | – |
All samples were reduced with DTT
ab6–NH3 fragmentation ion contains the amino acids of the oxytocin ring Cys1-Tyr2-Ile3-Gln4-Asn5-Cys6 missing –NH3 and has a theoretical mass of 708.25 Da for intact oxytocin
by5-fragmentation ion contains the amino acids Asn5-Cys6-Pro7-Leu8-Gly9 and has a theoretical mass of 502.24 Da for intact oxytocin
cb4 fragmentation ion contains the amino acids Cys1-Tyr2-Ile3-Gln4 and has a theoretical mass of 508.22 Da for intact oxytocin
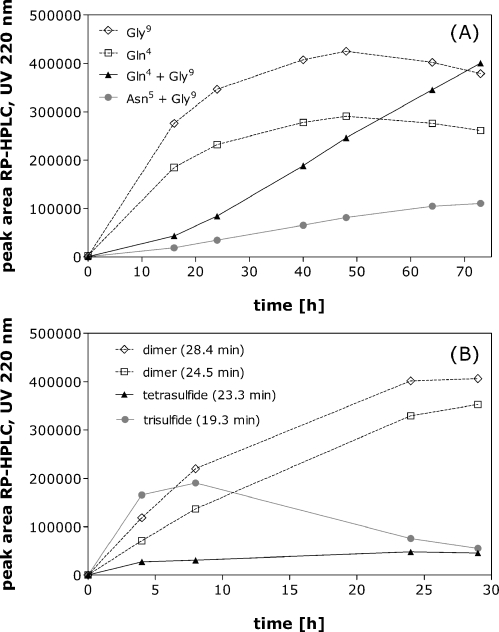
Fig. 7A shows the rates of formation of each of the deamidated species. Gly9-NH2 deamidates fastest followed by Gln4. Bis-deamidated species also form, whereas Asn5 deamidation is observed only to a minor degree. This might sound contrary to the literature, where asparagine deamidation is generally described as being faster than glutamine deamidation (18). However, within a more complex molecule like a protein or a peptide the conformation can also impact the rate and the likelihood of deamidation (19, 20). Structural studies on oxytocin have shown that the hydroxyl group of Tyr2 can form a hydrogen bond with the carboxamide in Asn5 (21,22), by which Asn5 could become less susceptible to deamidation.
Fig. 7.
Formation of different degradation products at 70°C measured by RP-HPLC: deamidated species formed at pH 2.0 (A) and trisulfide-, tetrasulfide containing oxytocin and dimers formed at pH 7.0 (B) are shown.
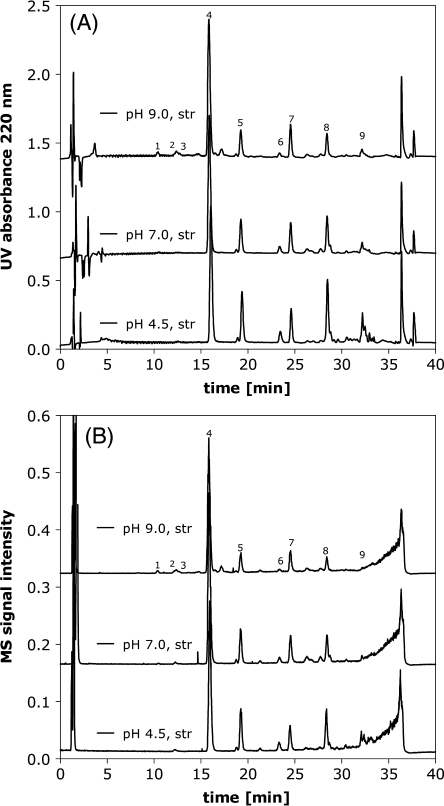
The LC-MS and LC-UV traces in Fig. 8 reveal that there is little qualitative difference in terms of the oxytocin degradation products formed upon thermal stress in pH 4.5, 7.0 or 9.0 formulations. The only significant difference is the presence of deamidation peaks in pH 9.0 formulations eluting prior to the oxytocin main peak in RP-HPLC. However, deamidation at pH 9.0 is less pronounced as compared to pH 2.0 and generally stops at mono-demidated oxytocin. This is presumably due to the different deamidation mechanisms at low and high pH. Above pH 3 deamidation is thought to proceed via the formation of cyclic imide intermediates for Asn and Gln, as well as base catalyzed hydrolysis, whereas proton-catalyzed hydrolysis dominates below pH 3 (9,10,23). It should be remembered that whilst the degradation profiles were comparable for pH 4.5, 7.0 and 9.0, the degradation kinetics differed significantly as discussed earlier. In order to reach about 50% degradation in RP-HPLC, it was necessary to stress oxytocin formulated at pH 4.5 for 48 h at 70°C, whereas at pH 9.0 only 6 h were needed.
Fig. 8.
RP-HPLC with UV (A) and MS (B) detection from heat stressed pH 4.5, 7.0 and 9.0 samples used for identification of degradation products.
Table III lists the retention times, the m/z of the parent ion, the charge and the assignment based on LC-MS for the highest intensity peaks in RP-HPLC identified in heat stressed pH 4.5, 7.0 and 9.0 oxytocin formulations (Fig. 8). The main degradation products were found to be tri- and tetrasulfide bridged oxytocin monomers, and sulfur-linked dimers. The nature of these dimers will be discussed further below. Larger aggregates were also observed at the end of the gradient, although they were not well separated under the used RP-HPLC conditions. Next to this, a number of minor degradation products were identified, in particular oxidation products either of cystein or tyrosine. However, these contribute less than 1% to the total area of all RP-HPLC peaks.
Table III.
Identification of Oxytocin Degradation Products for pH 4.5, 7.0 and 9.0 Formulations from LC-MS Data Shown in Fig. 8
| Peak number | Retention time [min] | m/z | Charge | Assignment |
|---|---|---|---|---|
| 1a | 10.4 | 1,008.42 | 1+ | Mono-deamidation at Asn6 or Gln4a |
| 2a | 12.3 | 1,008.42 | 1+ | Mono-deamidation at Gly9a |
| 3a | 12.6 | 1,008.42 | 1+ | Mono-deamidation at Asn6 or Gln4* |
| 4 | 15.9 | 1,007.44 | 1+ | Oxytocin |
| 5 | 19.3 | 1,039.41 | 1+ | Trisulfide |
| 6 | 23.3 | 1,071.38 | 1+ | Tetrasulfide |
| 7 | 24.5 | 975.44 | 2+ | Dimer, bis-deamidated, bis-β-eliminated |
| 8 | 28.4 | 975.44 | 2+ | Dimer, bis-deamidated, bis-β-eliminated |
| 9 | >30 | – | multiple | Larger aggregates and others |
aOnly present in pH 9 samples, assignment based on MS and MS/MS data
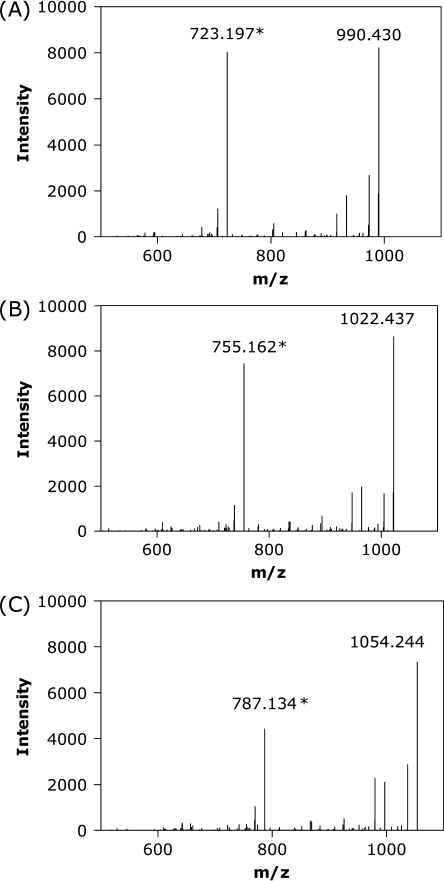
High resolution MS and MS/MS analysis provided convincing evidence for the assignment of peaks eluting at 19.3 and 23.3 min as tri- and tetrasulfide-containing degradation products, respectively (Fig. 8). The observed differences in m/z of 31.971 and 63.942 correspond to the addition of one and two sulfur atoms, respectively, to oxytocin. MS/MS analysis proved that the sulfur atoms are introduced into the ring portion of the molecule. The peak at m/z = 723.197 for oxytocin corresponds to a b6 fragment including the cyclic portion of oxytocin and m/z of 990.430 oxytocin lacking NH3 (Fig. 9A). The b6 fragments for the trisulfide (Fig. 9B) and tetrasulfide (Fig. 9C) have a difference in m/z relative to this of +31.971 and +63.942, due to the introduction of one and two sulfur atoms, respectively, into the oxytocin ring.
Fig. 9.
MS/MS results showing the b6-ion (marked with *) from LC-MS for the oxytocin main peak, retention time 15.9 min, m/z 1,007.44 (A), trisulfide-containing oxytocin, retention time 19.3 min, m/z 1,039.42 (B) and tetrasulfide-containing oxytocin, retention time 23.3 min, m/z 1,071.39 (C).
The identified trisulfide- and tetrasulfide-containing oxytocin degradation products are unusual peptides. Whilst trisulfide formation has been reported in the literature as a thermal decomposition product of the structurally similar peptide salmon calcitonin (24), this is to our knowledge the first reported instance of a tetrasulfide as a degradation product of a peptide or protein. Trisulfides are known to exist in nature as they have been observed in variants of recombinant proteins produced in E. coli like in methionyl human growth hormone (25), human growth hormone (26) and a recombinant truncated interleukin-6 mutein (27). Furthermore, trisulfides have been prepared synthetically, e.g. also for oxytocin and deaminooxytocin (28). Tetrasulfides can also be synthesized and are known to be formed as decomposition products following photolysis of cystein (29,30).
The mechanism by which these species form within oxytocin has not yet been fully elucidated. One possible explanation is the mechanism reported by Windisch et al. (1996) for the formation of a trisulfide-containing salmon calcitonin degradation product involving sequential dimerization, β-elimination and oxidation (24). A radical-based mechanism, as described for cystein (29) may also be postulated. However, this normally requires irradiation with light of an appropriate wavelength.
For heat stressed oxytocin, two dimeric products were evident by mass spectrometry, eluting at 24.5 and 28.4 min. High resolution MS showed the two peaks to be of identical mass, which corresponds to a sulfur-linked dimeric oxytocin species that has been doubly deamidated and which has lost two sulfur atoms through β-elimination. The measured m/z of 975.447 corresponds to the theoretical value of 975.447 calculated for the proposed species. It is difficult to understand why the dimer should be doubly deamidated given that no deamidation has been observed for monomeric oxytocin at either pH 4.5 or 7.0. It is postulated that β-elimination may result from an intramolecular reaction, most probably involving the Asn5 side-chain amide. The mechanism of degradation requires further investigation.
Finally, it is interesting to note from Fig. 7B, that the concentration of trisulfide reaches a maximum after about 8 h at 70°C and then decreases, whereas the concentration of all the other degradation products continues to increase. Kinetic analyses such as these can prove valuable in attempting to assign reaction mechanisms. A more thorough mechanistic investigation into oxytocin degradation is currently under investigation.
CONCLUSIONS
Within this study, oxytocin degradation and kinetics under conditions relevant for pharmaceutical formulations have been elucidated for the first time. From HP-SEC and RP-HPLC it is obvious that both chemical degradation and aggregation are dominating degradation mechanisms of oxytocin at elevated temperatures. The degradation mechanisms of oxytocin depend on the formulation pH. Various deamidated oxytocin molecules were identified at pH 2.0 and pH 9.0. At pH 4.5, 7.0 and 9.0 the formation of tri- and tetrasulfide-containing monomeric oxytocin, different oxytocin dimers and larger aggregates were identified. Oxytocin degradation in formulations between pH 2.0 and 9.0 follows Arrhenius kinetics, with the pH 4.5 formulation being most stable. This can be beneficial for formulation development as it can enable the prediction of long-term stability at lower temperature from accelerated stress testing.
Acknowledgements
The authors want to thank NV Organon for providing material for the study. This study was performed within the framework of Top Institute Pharma project: number D6–202.
Open Access This article is distributed under the terms of the Creative Commons Attribution Noncommercial License which permits any noncommercial use, distribution, and reproduction in any medium, provided the original author(s) and source are credited.
References
- 1.Meckenzie IZ. Induction of labour at the start of the new millennium. Reproduction 2006;131:989–98. doi:10.1530/rep.1.00709. [DOI] [PubMed]
- 2.van Dongen PWJ, van Roosmalen J, de Boer CN, van Rooy RJ. Oxytocics for the prevention of postpartum haemorrhages, a review. Pharm Weekbl [Sci] 1991;13:238–43. doi:10.1007/BF02015577. [DOI] [PubMed]
- 3.Hogerzeil HV, Walker GJA, de Goeje MJ. Stability of injectable oxytocics in tropical climates. WHO report WHO/DAP/93.6 (1993).
- 4.de Groot N, Hekster YA, Vree TB, Dongen PW. Oxytocin and desamino-oxytocin tablets are not stable under simulated tropical conditions. J Clin Pharm Ther. 1995;20:115–9. doi:10.1111/j.1365-2710.1995.tb00638.x. [DOI] [PubMed]
- 5.Nachtmann F, Krummen K, Maxl F, Reimer E. Oxytocin. Analytical profiles of drug substances. Anal Prof Drug Subst. 1981;10:563–600.
- 6.Neumann DI. Brain oxytocin: A key regulator of emotional and social behaviours in both females and males. J Neuroendocrinol. 2008;20:858–65. doi:10.1111/j.1365-2826.2008.01726.x. [DOI] [PubMed]
- 7.Marazziti D, Catena Dell’Osso M. The role of oxytocin in neuropsychiatric disorders. Curr Medical Chem. 2008;15:698–704. doi:10.2174/092986708783885291. [DOI] [PubMed]
- 8.Walter R, Schwartz IL, Darnell JH, Urry DW. Relation of the conformation of oxytocin to the biology of neurohypophyseal hormones. Proc Natl Acad Sci U S A 1971;68:1355–9. doi:10.1073/pnas.68.6.1355. [DOI] [PMC free article] [PubMed]
- 9.Manning MC, Patel K, Borchardt RT. Stability of protein pharmaceuticals. Pharm Res. 1989;6:903–11. doi:10.1023/A:1015929109894. [DOI] [PubMed]
- 10.Patel K, Borchardt RT. Chemical pathways of peptide degradation. III. Effect of the primary sequence on the pathway of deamidation of asparaginyl residues in hexapeptides. Pharm Res. 1990;7:787–93. doi:10.1023/A:1015999012852. [DOI] [PubMed]
- 11.Houchin ML, Heppert K, Topp EM. Deamidation, acylation and proteolysis of a model peptide in PLGA films. J Control Release. 2006;112:111–9. doi:10.1016/j.jconrel.2006.01.018. [DOI] [PubMed]
- 12.Benesch RE, Benesch R. The mechanism of disulfide interchange in acid solution; role of sulfenium ions. J Am Chem Soc. 1958;80:1666–9. doi:10.1021/ja01540a040. [DOI]
- 13.European pharmacopoeia 6th edition. Monography oxytocin, pp. 2953–2954 (2009).
- 14.Chaibva FA, Walker RB. Development and validation of a stability-indicating analytical method for the quantification of oxytocin in pharmaceutical dosage forms. J Pharm Biomed Anal. 2007;43:179–85. doi:10.1016/j.jpba.2006.07.002. [DOI] [PubMed]
- 15.Gill SC, von Hippel PH. Calculation of protein extinction coefficients from amino acid sequence data. Anal Biochem. 1989;182:319–326. doi:10.1016/0003-2697(89)90602-7. [DOI] [PubMed]
- 16.Q2(R1). Validation of analytical procedures: text and methodology. International conference on harmonisation of technical requirements for registration of pharmaceuticals for human use, November (2005).
- 17.Malencik DA, Sprouse JF, Swanson CA, Anderson SR. Dityrosine: preparation, isolation and analysis. Anal Biochem. 1996;242:202–213. doi:10.1006/abio.1996.0454. [DOI] [PubMed]
- 18.Robinson NE, Robinson AB. Molecular clocks: deamidation of asparaginyl and glytaminyl residues in peptides and proteins. Althouss Press, Cave Junction (2004).
- 19.Xie M, Schowen RL. Secondary structure and protein deamidation. J Pharm Sci. 1999;88:8–13. doi:10.1021/js9802493. [DOI] [PubMed]
- 20.Wright TE. Sequence and structure determinants of the nonenzymatic deamidation of asparagine and glutamine residues in peptides. Protein Eng. 1991;4:283–94. doi:10.1093/protein/4.3.283. [DOI] [PubMed]
- 21.Kato T, Endo S, Fujiwara T, Nagayama K. Oxytocin solution structure changes upon protonation of the N-terminus in dimethyl sulfoxide. J Biomol NMR. 1993;3:653–73. doi:10.1007/BF00198370. [DOI] [PubMed]
- 22.Turner RJ, Matsoukas JM, Moore GJ. Tyrosinate fluorescence liftetimes for oxytocin and vasopressin in receptor-simulating environments: relationship to biological activity and 1H-NMR data. Biochem Biophys Res Comm. 1990;171:996–1001. doi:10.1016/0006-291X(90)90782-I. [DOI] [PubMed]
- 23.Peters B, Trout BL. Asparagine deamidation: pH-dependent mechanism for density fuctional theory. Biochem. 2006;45:5384–5392. doi:10.1021/bi052438n. [DOI] [PubMed]
- 24.Windisch V, DeLuccia F, Duhau L, Herman F, Mencel JJ, Tang S, Vuilhorgne M. Degradation pathways of salmon calcitonin in aqueous solutions. J Pharm Sci. 1997;86:359–64. doi:10.1021/js9602305. [DOI] [PubMed]
- 25.Canova-Davis E, Baldonado IP, Chloupek RC, Ling VT, Gehant R, Olson K, Gillece-Castro BL. Confirmation by mass spectrometry of a trisulfide variant in methionyl human growth hormone biosynthesized in Escherichia coli. Anal Chem. 1996;68:4044–51. doi:10.1021/ac9605915. [DOI] [PubMed]
- 26.Andersson C, Edlund PO, Gellerfors P, Hansson Y, Holmberg E, Hult C, Johansson S, Kördel J, Lundin R, Mendel-Hartvig IB, Norén B, Wehler T, Widmalm G, Ohman J. Isolation and characterization of a trisulfide variant of recombinant human growth hormone formed during expression in Escherichia coli. Int J Pept Protein Res. 1996;47:311–21. [DOI] [PubMed]
- 27.Breton J, Avanzi N, Valsasina B, Sgarella L, La Fiura A, Breme U, Orsini G, Wenisch E, Righetti PG. Detection of traces of a trisulphide derivative in the preparation of a recombinant truncated interleukin-6 mutein. J Chromatograph A 1995;709:135–46. doi:10.1016/0021-9673(95)00108-Y. [DOI] [PubMed]
- 28.Chen L, Zoulíková I, Jirina Slaninová J, Barany G. Synthesis and pharmacology of novel analogues of oxytocin and deaminooxytocin: directed methods for the construction of disulfide and trisulfide bridges in peptides. J Med Chem. 1997;40:864–76. doi:10.1021/jm9607156. [DOI] [PubMed]
- 29.Asquith RS, Hirst L. The photochemical degradation of cystine in aqueous solution in the presence of air. Biochim Biophys Acta 1969;184:345–57. [DOI] [PubMed]
- 30.Fletcher JC, Robinson A. The occurrence of bis-(2-amino-2-carboxyethyl) trisulphide in hydrolysates of wool and other proteins. Biochim J. 1962;87:553–9. [DOI] [PMC free article] [PubMed]


