Abstract
Previous studies suggest that humans rely on geometric visual information (hallway structure) rather than non-geometric visual information (e.g., doors, signs and lighting) for acquiring cognitive maps of novel indoor layouts. This study asked whether visual impairment and age affect reliance on non-geometric visual information for layout learning. We tested three groups of participants—younger (< 50 years) normally sighted, older (50–70 years) normally sighted, and low vision (people with heterogeneous forms of visual impairment ranging in age from 18–67). Participants learned target locations in building layouts using four presentation modes: a desktop virtual environment (VE) displaying only geometric cues (Sparse VE), a VE displaying both geometric and non-geometric cues (Photorealistic VE), a Map, and a Real building. Layout knowledge was assessed by map drawing and by asking participants to walk to specified targets in the real space. Results indicate that low-vision and older normally-sighted participants relied on additional non-geometric information to accurately learn layouts. In conclusion, visual impairment and age may result in reduced perceptual and/or memory processing that makes it difficult to learn layouts without non-geometric visual information.
Keywords: spatial navigation, wayfinding, visual impairment, low vision, aging, virtual environments, geometric visual information, cognitive maps, landmarks, environmental learning
A typical building contains abundant visual features for aiding navigation, from geometric cues about the structural layout of the floor plan to cues unrelated to the layout geometry such as the presence of objects (e.g., pictures, water fountains) and image characteristics (e.g., textures, color and lighting). The current study addresses how two important participant characteristics, visual impairment and age, influence the types of visual information needed for developing an accurate mental representation of a novel virtual environment (VE). First, we ask whether rendering of purely geometrical information is sufficient for navigation in virtual buildings with visual impairment, and whether the addition of non-geometric visual features helps or hinders. Second, because the prevalence of visual impairment is much higher in old age, we ask whether age influences the use of geometric and non-geometric visual information.
Geometric and Non-geometric Cues
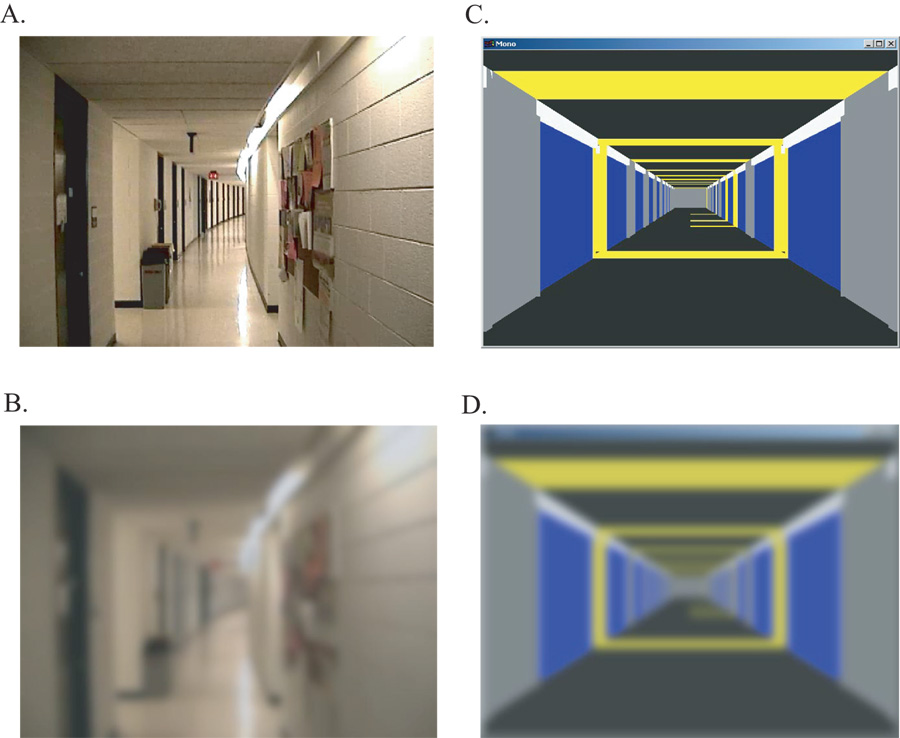
In this study, geometric cues refer to the spatial configuration of hallways, specifically their length and intersection connectivity. In Figure 1A, the geometric features are the hallways extending to the left, right, ahead, and behind. Non-geometric visual features are distinct from layout geometry, and in Figure 1A include the bulletin board with postings, the trash cans in the corridor, and the lighting patterns on the walls and floor.
Figure 1.
Example of a four-way hallway intersection as viewed normally (A) and with simulated visual impairment produced with blurring and contrast reduction (B). The geometric and non-geometric features depicted in A become less distinct in B with simulated visual impairment. In a virtual environment, geometric features can be displayed in high-contrast colors (C). Under reduced visual conditions, branching hallways are easier to detect in the virtual environment (D) compared to the real environment. Although these images do not necessarily simulate the subjective experience of people with low vision, they give some idea of the reduction of visual information associated with reduced spatial resolution or reduced contrast sensitivity.
Previous work on both animal and human spatial cognition suggests that information about layout geometry is preferentially encoded when learning a space. After exploring a rectangular box, rats look for the target the same percentage of time at the correct corner as at the geometrically-equivalent opposite corner, despite the presence of unique non-geometric cues (Cheng, 1986). Furthermore, pre-verbal human children tend to use geometric information to locate the position of a toy in a rectangular room even when wall color, a non-geometric feature, provides more specific information (Hermer & Spelke, 1996). These findings support the notion of a “geometric module” in the brain dedicated to using information about the relative position of surfaces in an environment to compute orientation (Gallistel, 1990).
Non-geometric cues are useful for learning environments when geometric cues are ambiguous. Monkeys and other species will rely more on non-geometric cues, such as cards with distinctive patterns, when the information they provide about target location conflicts with geometric cues (Gouteux & Thinus-Blanc, 2001; Kelly, Spetch, & Heth, 1998; Sovrano, Bisazza, & Vallortigara, 2002; Vallortigara, Zanforlin, & Pasti, 1990; see review by Cheng & Newcombe, 2005). However, these species are still able to use geometric information for localization when non-geometric information is not available.
There is also evidence that humans are biased towards using geometric information when navigating through more complex spaces, such as the inside of a building. Non-geometric information, such as large objects placed at various intersections, improves navigation efficiency (measured by the route-distance traveled) (Lessels & Ruddle, 2005; Ruddle, Payne, & Jones, 1997), and is useful for locating specific rooms and remembering where to make turns (Ruddle, et al., 1997). However, non-geometric information does not result in better knowledge of overall layout configuration (Ruddle, et al., 1997). Furthermore, participants demonstrate more accurate knowledge of geometric compared to non-geometric information, even during the first few exposures to a novel indoor environment (Stankiewicz & Kalia, 2007). These studies suggest that non-geometric cues provide some advantages when navigating through an environment, but they are not necessary for developing an accurate mental representation of layout information.
The current studies explored whether people with varying degrees of visual abilities and ages demonstrate similar use of non-geometric visual information when learning unfamiliar, large-scale layouts. Although previous studies suggest that younger, normally-sighted individuals do not rely on non-geometric cues to develop an accurate mental representation of a layout, it is not known whether the same is true for older adults or people with visual impairments. We tested this question by comparing learning of layouts in two types of virtual environments, one that displayed only geometric features (Sparse VE) and another that displayed both geometric and non-geometric features (Photorealistic VE). Like the studies by Lessels & Ruddle (2004, 2005), we did not select a single type of non-geometric feature to include in the virtual environments, because it was unclear which visual features humans choose to use in real spaces. Instead, the Photorealistic VE allowed participants to use the range of non-geometric information available in real environments.
Low Vision Navigation
The term “low vision” refers to any chronic visual impairment that affects everyday functioning and is not correctable by glasses or contact lenses. There are two distinct problems associated with navigating with low vision: obstacle avoidance and wayfinding. Much attention has been given to the problem of how specific visual impairments make it difficult to detect and avoid obstructions along a path (Kuyk & Elliott, 1999; Marron & Bailey, 1982; Turano, et al., 2004; West, et al., 2002). The current study focuses on wayfinding behavior in people with low vision, including their ability to learn unfamiliar layouts and then to use this information to plan and execute paths between specific locations.
Low vision may influence wayfinding and the building of accurate mental spatial representations in two ways. First, it can be more challenging to visually extract layout geometry, making it more difficult to navigate between locations. If so, wayfinding should be improved by enhancing the saliency of geometric visual features in a layout. Virtual environments can accomplish this by, for example, depicting hallways and intersections in high-contrast colors. In Figure 1, the intersecting hallways are more salient in the virtual environment (1D) than in the real environment (1B) under conditions of blur and reduced contrast. Secondly, people with low vision may rely less on non-geometric information if reduced acuity, reduced field or low contrast sensitivity makes it difficult to resolve and identify these features. If such objects are hard to recognize, they might even act as distracting clutter which interferes with the extraction of cues to the geometrical layout. Thus, we might expect little or no improvement in wayfinding when non-geometric features are present in an environment. Based on these predictions, we hypothesized that low-vision participants would learn layouts better in the Sparse VE, which displayed only high-contrast geometric information, compared to the Photorealistic VE, which displayed additional non-geometric information.
This study also addressed the practical question of whether low-vision individuals can use enhanced computer displays to learn a layout of a building prior to visiting the real space. Pre-journey learning, using maps on a digital touchpad augmented with auditory cues, has proven useful for blind individuals when navigating in the real environment (Holmes, Jansson & Jansson, 1996). The current study investigated whether the same is true for visual representations displayed on a computer, such as maps or first-person virtual environments.
Aging and Navigation
The leading causes of vision impairment in the U.S. are due to age-related eye diseases, such as age-related macular degeneration, cataract, diabetic retinopathy and glaucoma (Eye Diseases Prevalence Research Group, 2004). It is estimated that in the year 2000 there were approximately 3.3 million individuals older than 40 with visual disabilities, with prevalence growing significantly with age (Eye Disease Prevalence Research Group, 2004). It is likely that age and visual impairment interact in their effects on spatial navigation. Consequently, our study also explores how age influences the use of geometric and non-geometric visual information when learning novel indoor layouts.
Several studies have shown that navigating in novel layouts becomes more difficult with age. A recent study by Sjölinder, Hook, Nilsson, and Andersson (2005) had younger (mean age = 25.5) and older (mean age = 66.9) individuals navigate through a virtual grocery store by simulating the real-world task of searching for items on a shopping list. The virtual rendering included visual details such as store shelves with different products and textured walls and floors. The older participants spent more time and were less efficient at finding the grocery items in the virtual store compared to the younger participants. They also developed less accurate survey knowledge of the store layout, and particularly overestimated distances between locations. Another study demonstrated that older (> 65.1 years) participants take more time and exhibit more errors when learning a route in a visually-rich virtual environment compared to younger participants (Moffat, Zonderman, & Resnick, 2001). This is despite controlling for other factors such as computer experience and gender. Animal research on the use of place cells to encode spatial information also indicates that older rats have difficulty developing spatial representations for new environments and associating target locations with visual cues (Rosenzweig, Redish, McNaughton, & Barnes, 2003; Wilson, et al., 2004).
Age may also affect the ability to use geometric visual information during spatial learning. In a study by Moffatt & Resnick (2002), younger (25–45 years), middle-aged (45–65 years), and older (65–93 years) adults were trained to locate a hidden platform by virtually swimming in a Morris Water Maze. The circular pool, viewed from a first-person perspective on a desktop computer, was surrounded by walls with an irregular shape as well as distinct objects that served as non-geometric cues. When asked to draw a map of the environment, older participants were less accurate at depicting the outer wall but were able to reproduce the non-geometric features of the environment. Furthermore, the older participants had difficulty locating the target with respect to the geometric cues provided by the shape of the walls compared to younger participants, but no differences between age groups were found when non-geometric cues were available. Older adults also exhibit more error than younger adults when using a geometric representation of a route (a map consisting only of layout geometry) to navigate inside a building (Wilkniss, Jones, Korol, Gold, & Manning, 1997). These results suggest that older individuals may rely more on non-geometric rather than geometric cues when learning locations within a space. Accordingly, in the current study we hypothesize that older adults will have a less accurate representation of layouts learned in the Sparse VE, which only depicts layout geometry, compared to younger adults, but both age groups will perform similarly in the Photorealistic VE.
Current Study
To summarize, the current study addressed whether non-geometric visual information usefully supplements (or, in the case of low vision, obscures) geometric information for learning novel indoor layouts. We tested the effects of two participant characteristics on the use of geometric and non-geometric information: 1) visual impairment, and 2) age. Participants learned layouts in two types of environments displayed on a desktop computer, a Sparse VE depicting only information about layout geometry (hallway length and intersections), and a Photorealistic VE displaying a full range of visual features, such as posters on the walls, color and lighting patterns, in addition to geometric information. For comparison, participants also learned layouts using two common methods, a Map and by exploring a Real building.
We measured two aspects of learning, the rate of acquisition of layout information and the accuracy of the resulting mental representation. The rate of acquisition was measured by how much exploration was needed to learn the locations of several targets. Target localization and map drawing were used to measure the accuracy of the resulting mental representation and whether it contained the minimal information required to travel between locations (route-based knowledge), or additional information about the overall configuration of the layout (survey knowledge). Experiment 1 tested young adults with normal vision, Experiment 2 tested a heterogeneous group of low-vision individuals, and Experiment 3 tested older people with normal vision.
EXPERIMENT 1
This experiment tested how well young, normally-sighted individuals learned layouts in four presentation modes: two virtual environments (Sparse and Photorealistic) displayed from a first-person viewpoint, a Map, and a Real building. The Sparse and Photorealistic VEs were used to manipulate the non-geometric visual information available when learning layouts. The main goal of this experiment was to replicate previous findings that non-geometric visual information does not improve the accuracy of mental representations of space, but may aid other aspects of navigation for younger normally-sighted individuals.
Two control conditions were included in this experiment. The Map condition assessed learning when global information about the layout was available. The Real building condition provided an ecologically valid control for comparison, and also indicated whether non-visual cues are crucial for learning layouts. In this paper, non-visual cues refer to proprioceptive and vestibular information. Previous studies suggest that non-visual information allows for more accurate spatial updating as measured by judgments of the direction to objects (Chance, Gaunet, Beall, & Loomis, 1998; Waller, Loomis, & Haun, 2004) or to a starting location (Klatzky, Loomis, Beall, Chance, & Golledge, 1998). Also, non-visual information increases the efficiency of searching for targets in both a visually-sparse and a photorealistic VE (Ruddle & Lessels, 2006). By testing participants in these four conditions, we compared how acquisition and accuracy of layout knowledge is effected by the information available about the layout during learning.
Method
Participants
Sixteen undergraduate students (mean age = 19, SD = 1, 8 males, 8 females) from an introductory psychology course participated in the experiment. Eleven of the 16 participants were located and surveyed four years after the study on their video game experience. Six of the eleven did not have experience with video games at the time of the study; the other five spent 0.5 to 3 hours per week playing video games that involved navigating through virtual environments. Participation was voluntary and was compensated with extra credit or monetary payment. All participants had normal or corrected-to- normal visual acuity and had little to no exposure to the building layouts tested in the experiment. Participants also provided informed consent.
Materials
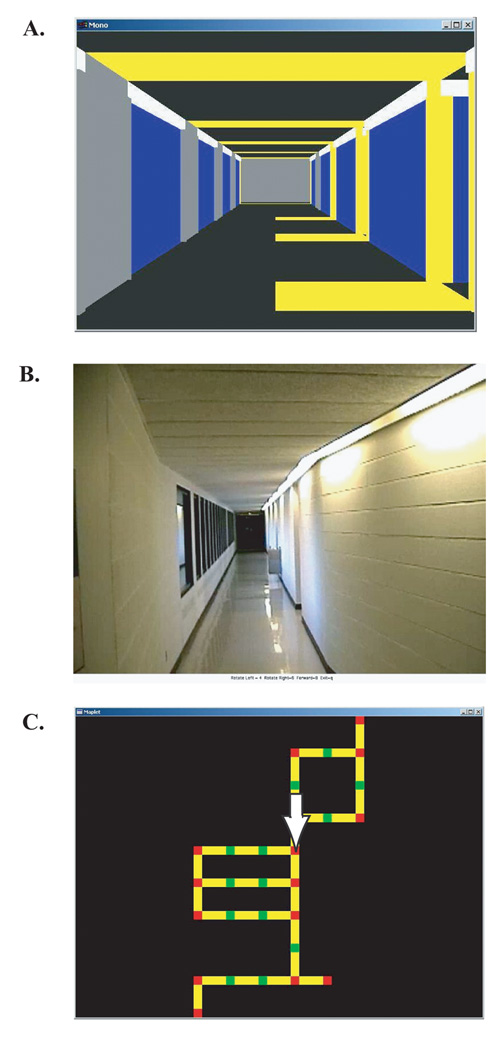
The layouts used for testing were obtained from several topologically-distinct floors in the psychology building at the University of Minnesota. Computer representations of these layouts were created by mapping them onto a grid of nodes connected by line segments (see Figure 2C as an example). Each node represented a possible position in the computer-based virtual environment and only discrete moves between nodes were allowed. Each line segment represented a hallway unit connecting one node to another, which corresponded to an approximate distance of 4.6 m (15 feet) in the real layout. Thus, for both virtual environments and the Map displayed on the computer, participants moved from one node to another, or the equivalent of 4.6 m, every time they made a forward key press.
Figure 2.
Examples of the same layout rendered in the A) Sparse VE, B) Photorealistic VE, and C) Map presentation modes. The views in A and B are from the same location and orientation as indicated by the white arrow in C (the arrow is enlarged for this illustration). In A, the yellow markings on the right side of the floor and wall indicate a hallway going to the right at the next three intersections.
Each layout contained four target locations represented acoustically but not visually. We have no reason to believe that memory for auditory versus visual targets is different since previous work has shown that spatial representations acquired visually or verbally are functionally similar (review by Loomis, Klatzky, Avraamides, Lippa & Golledge, 2007). When participants reached a target location, a computer voice stated the name of the target (e.g. “Target Cat”). The speech output was adjusted beforehand for all participants to ensure that it was highly intelligible. The targets were located either at dead ends or intersections and were chosen to be spread out across the floor. This required participants to explore most of the layout in order to find all target locations.
The same keystroke interface was used to move in all three computer-simulated environments (Sparse VE, Photorealistic VE, and Map conditions). Participants used key presses on the number keypad to either translate forward one hallway segment (key “8”), rotate 90 degrees to the right (“4”) or rotate 90 degrees to the left (“6”). In the Map condition, the keystrokes moved a cursor that provided a visual indicator of the participant’s current location (see below).
The Map and Sparse environments were viewed on PCs with 18 inch (45.7 cm) screens (ViewSonic E90f and MultiSync FE950+) and the Photorealistic environments were viewed on a Macintosh with a 17-inch (43.2 cm) screen (Apple Studio Display). Different computers, and therefore screens, were used because of the software requirements of the virtual environment programs. The room lights remained on during testing because it was more comfortable for visually-impaired (Experiment 2) and older (Experiment 3) participants and made the experiment less intimidating.
Sparse VE
In the Sparse condition, participants were presented with a virtual representation of the real floor viewed from a first-person perspective. These sparse virtual layouts were created on a rectangular grid and only rendered the hallways and intersections of the floor; they did not include non-geometric features.
To simplify the rendering, curved hallways were approximated as straight hallways. It is likely that modest curvature is a feature that humans do not typically preserve in their cognitive maps of a space. People typically encode environments as having a grid-like structure, with 90 degree intersections, even if the real environment deviates from a grid structure (Tversky, 1981). It remains possible that even if hallway curvature is not represented geometrically, it could be encoded as a non-geometric image feature based on effects of shading, contour or occlusion associated with the curvature.
Hallways were rendered with contrasting blue and yellow color patterns on the walls and ceiling; additional yellow markings on the wall and floor indicated the presence of intersecting hallways (Figure 2A). Virtual movement from one node to the next was continuous and included optic flow cues, thereby simulating real movement. Translations and rotations took about 1.3 seconds. These environments were generated using Virtual Reality Modeling Language (VRML), and were displayed using Virtual Reality Utility (VRUT; University of California, Santa Barbara).
Photorealistic VE
The virtual environments in this condition were also rendered from a first-person perspective, but they included both the geometric and non-geometric cues available in the real environment (Figure 2B). The environments were created using movies of real space recorded by mounting a camera on a robot arm attached to a moving cart. The eye height of the camera was approximately 1.5 meters (5 feet) off the ground. For rotations, the arm was turned at a controlled pace, taking approximately 1.7 seconds for a 90° rotation. For translations, the cart was pushed a distance of about 4.6 m in 7.3 seconds. The movie was broken into clips simulating every possible forward move between nodes and every 90-degree rotation at intersections. Key presses generated the corresponding movie of the translation or turn.
Translational and rotational speed in the Photorealistic VE was slower than the Sparse VE because of the physical limitation of moving the cart. The difference in movement speeds in the two VEs did not affect participants’ perception of distance, as measured by a distance estimation task not reported in this paper.
Map
Participants learned one layout using a map displayed on a computer screen (Figure 2C). The map displayed nodes connected by yellow segments and each segment represented 4.6 m in the real layout. The nodes were green if they were located within a continuing hallway and red if they were at a dead end or an intersection. The display also included a white arrow indicating the participant’s current position and heading. Participants explored the layout by moving the arrow with key presses that indicated movement with respect to the arrow. For example, if the arrow was facing down on the screen, pressing “4” (the left turn key) would turn the arrow left with respect to its initial direction, meaning the arrow would point towards the right side of the screen. The reason for making movements with respect to the arrow, the participant’s projected location, was to be consistent with exploration in the Sparse and Photorealistic VEs in which key presses correspond to egocentric movements from a first-person perspective.
Procedure
Participants were tested in a within-subjects design by learning a different layout in all four conditions. They went through the procedure a total of five times, once for practice at the beginning of the experiment and then once for each of the four conditions. The order of the conditions as well as the layout-condition pairings were counterbalanced across participants with the restriction that only two of the four layouts could be learned in the Photorealistic condition (due to availability of materials). The layouts were quite different with the intention that learning would not transfer.
First, participants practiced moving in each type of environment using key presses and were told that each forward move was equivalent to moving fifteen feet (4.6 m) in the real building. Then they learned a practice layout and performed tests assessing layout knowledge described below.
Acquisition of Layout Knowledge
Each of the four experimental conditions started with an exploration period of a novel layout. Participants were explicitly told to explore until they definitively knew the locations of the targets and were familiar with the layout, but perfect knowledge of layout topology was not required. The exploration period ended when participants indicated they knew the target locations or they reached a maximum number of forward moves (determined by the size of the layout). Participants then performed a learning test that required them to navigate to each of the four target locations within a maximum number of forward moves (twice the number of moves needed to take the shortest path) in the same presentation mode as during exploration. The purpose of the learning test was to have participants achieve a common level of learning before they were assessed on their knowledge of the layouts. If participants did not pass this criterion level of learning, they resumed exploration. Participants were allowed to explore the layout for a maximum of four iterations to pass the learning test.
The rate of acquisition of layout knowledge was measured by recording the total number of forward moves used by the participant to explore the layout before passing the learning criterion. The acquisition score was calculated as the proportion of the number of moves used to the total number allowed in four possible exploration periods. For example, if the total number of moves allowed, summed over four exploration periods, was 200, and the participant used a total of 150 moves, the acquisition score would be 150/200 = 0.75. A low score indicated that layout information was attained with little exploration, whereas a score of 1.0 indicated that participants used all the exploration time allowed by the experimenter.
Assessment of Layout Knowledge
Participants performed two tasks to test the accuracy of the knowledge acquired during the exploration session. Participants first made maps of the layouts, which assessed whether they had a survey understanding of the environment. The second task was to find routes between target locations in the real space; this assessed transfer of layout knowledge to the real building.
Map Drawing
Participants were given a 16 × 16 grid of dots, and were asked to draw a map of the layout by connecting the dots with lines representing fifteen-foot (4.6 m) hallway segments. They also labeled the positions of the targets.
The accuracy of the map drawings was determined using a method adapted from Waller, Knapp, & Hunt (2001). This method only assessed the accuracy of target placement on the maps relative to each other and thus did not consider how accurately the corridor network was depicted.
Error (E) was the sum of the distances, measured in hallway units, of the estimated locations of targets from their actual locations (Equation 1 from Waller, et al. (2001)). The vectors ξ and ψ were the coordinates of the actual locations of targets for each map and vectors x’ and y’ were the coordinates of the estimated locations of targets on the corresponding participant maps. The coordinates for actual and estimated target locations were centered relative to the average of these coordinates (Equation 2 adapted from Waller, et al. (2001)). The participant target placements were also rotated and scaled to produce a minimum error score for each map.
| Equation 1 |
| Equation 2 |
Target Localization
Participants were instructed to find the locations of targets in the real building layout corresponding to the virtual layout they had explored. They navigated to targets in an order determined by the experimenter. If participants incorrectly localized a target, they were taken to the correct location to start the next trial. This method prevented errors made on a single trial from affecting performance on subsequent trials. Acoustic information about target locations was not available during this test. Participants received a score for target localization accuracy for each of the four layouts learned. This score was calculated as the proportion of targets correctly located out of the total number of targets (four per layout).
Data Analysis
Learning was assessed by measuring both the acquisition rate and the accuracy of spatial knowledge when participants explored layouts in the four presentation modes. Repeated measures analyses of variance (ANOVA) were conducted for acquisition rate and map error measures. Friedman tests (the nonparametric version of the Repeated Measures ANOVA) were conducted for target localization performance since the data for this measure were non-normal and could not be sufficiently corrected with transformations. Bonferroni-corrected pairwise tests determined which presentation modes accounted for significant differences in performance. Effect size, or how much the variance in the data was accounted for by presentation mode, was measured by partial eta squared (ηp2).
Results
Acquisition of Layout Knowledge
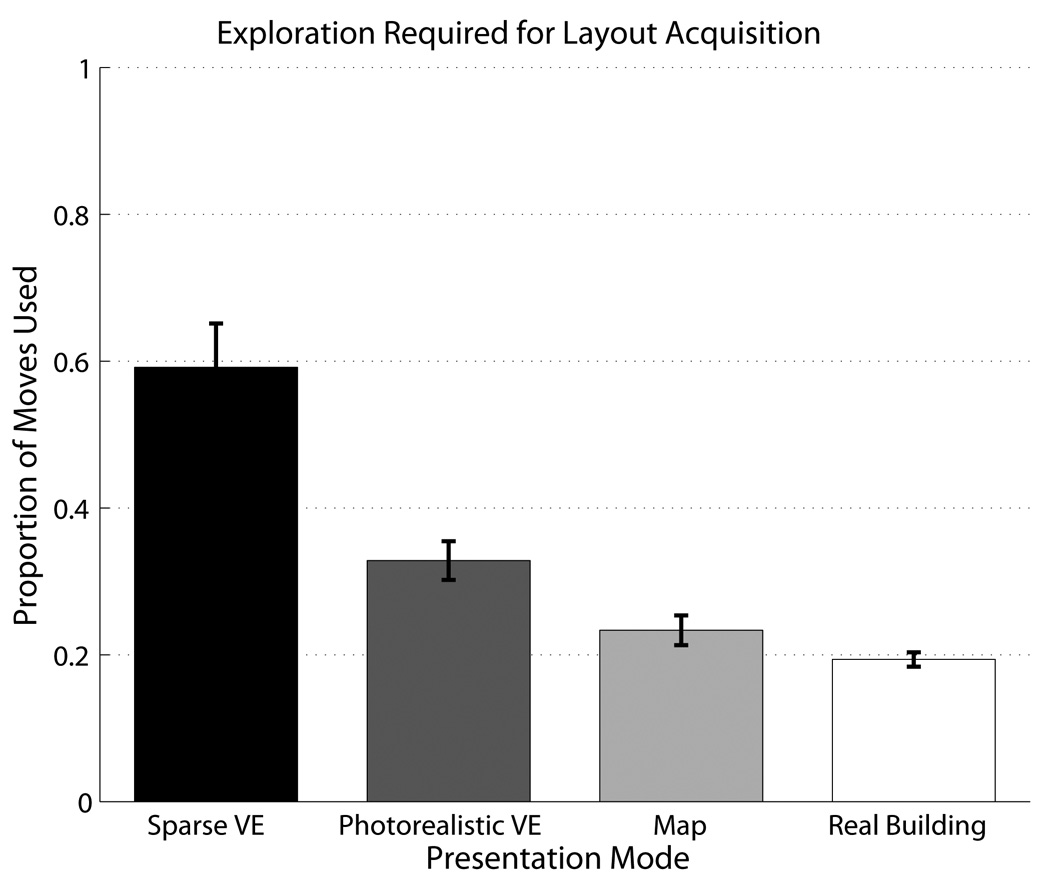
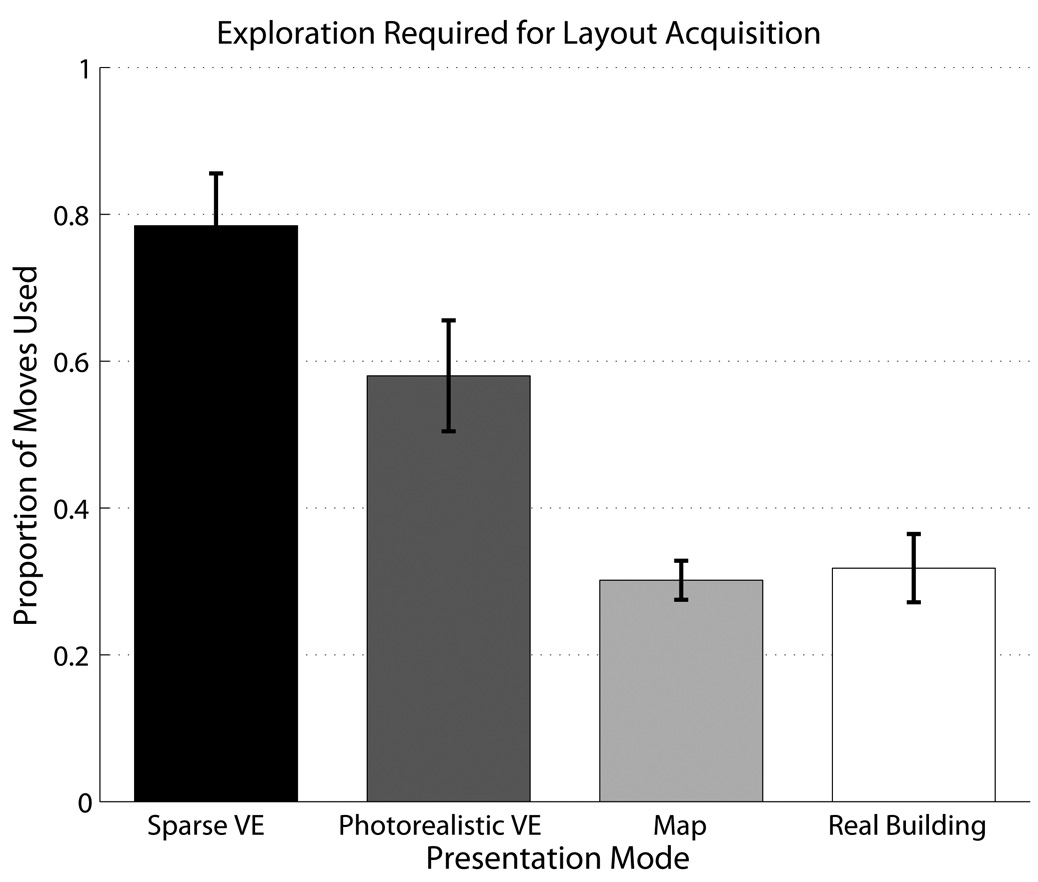
There was a significant effect of Presentation Mode on the rate of acquisition of layout knowledge (F(3, 45) = 28.785, p < 0.001, ηp2 = 0.66). As shown in Figure 3, acquisition was significantly faster (i.e., fewer moves were required to reach criterion learning) in the Photorealistic VE than in the Sparse VE (p = 0.003). The Map and Real building conditions also required significantly less exploration compared to the Sparse VE (Map and Real building: p < 0.001). Three participants included in this analysis did not pass the learning criterion in the Sparse VE condition, but the accuracy of their layout knowledge was still assessed. These data are included in the following analyses because excluding them did not alter the pattern of results.
Figure 3.
Mean proportion of moves used by younger normally-sighted participants to reach criterion learning in four presentation modes. Error bars indicate +/− 1 standard error. The proportion of moves used is calculated as the number of moves used divided by the total number of moves allowed to reach criterion learning.
Accuracy of Layout Knowledge
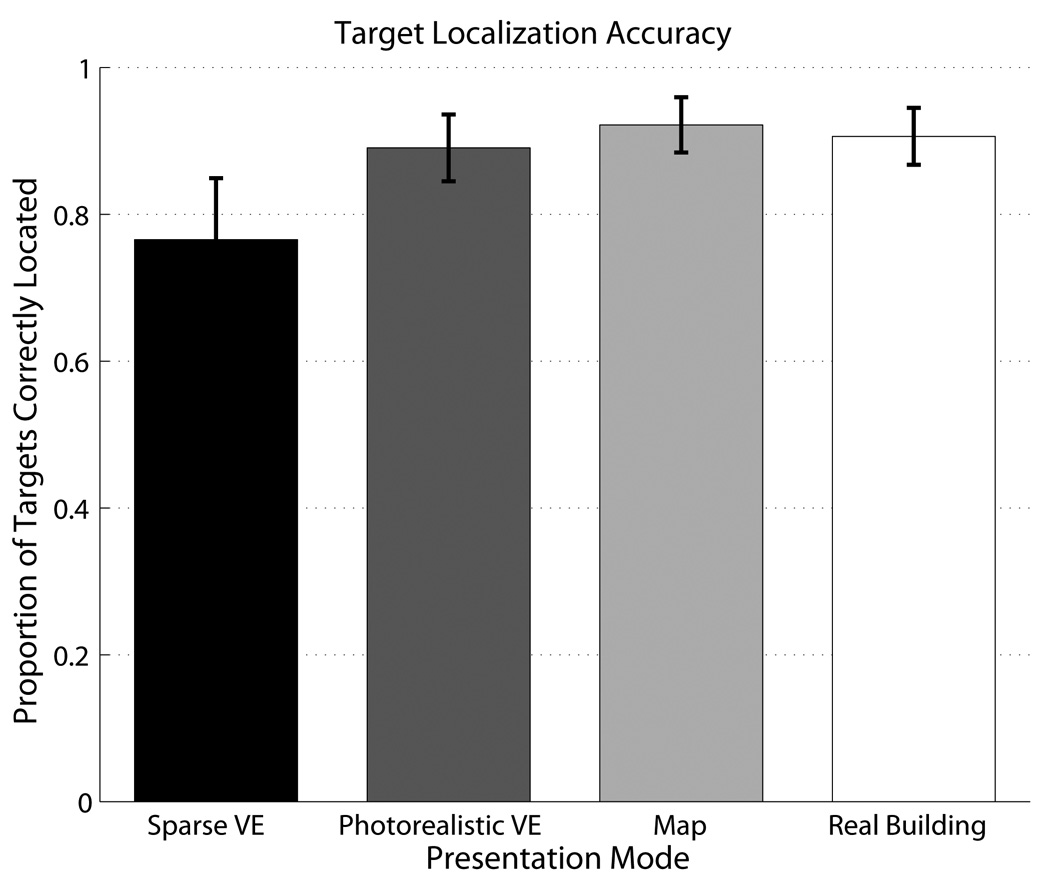
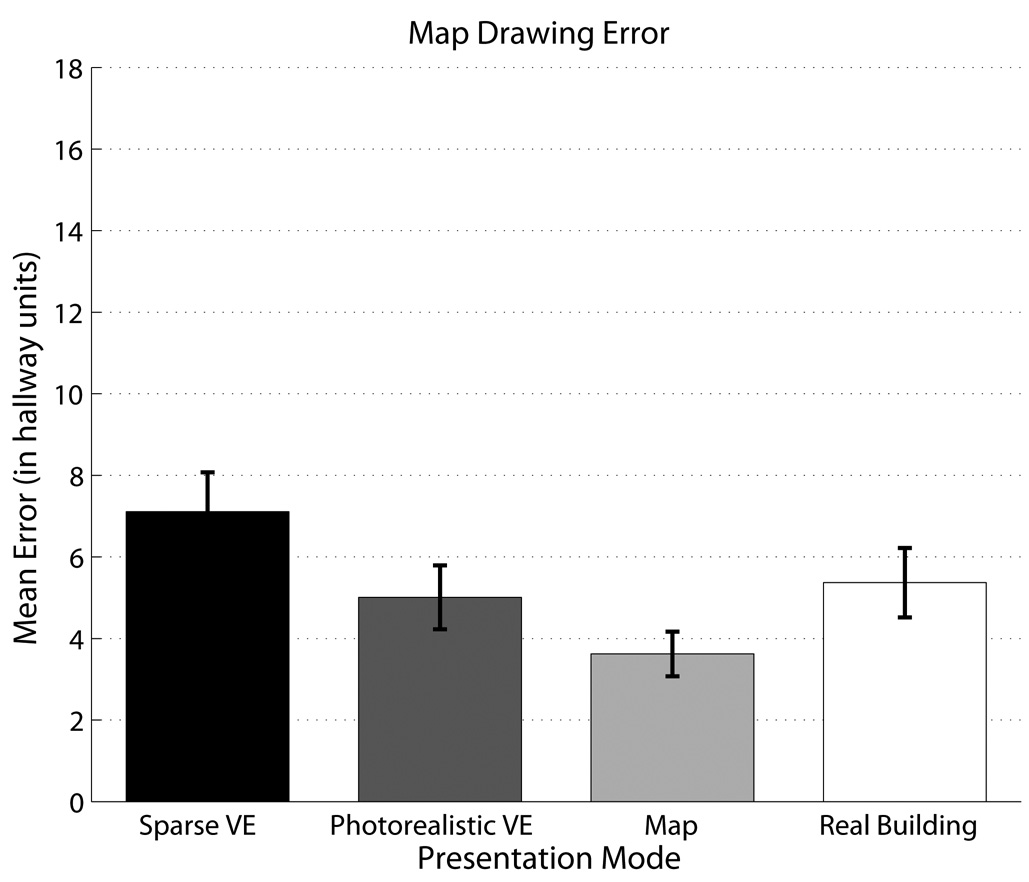
No significant difference was found in target localization performance between the four presentation modes (ηp2 = 0.09) (Figure 4). Although a significant difference was found in map drawing error (F(3, 45) = 4.497, p = 0.008, ηp2 = 0.23), pairwise comparisons were not significant (Figure 5). Individual scores on the target localization and map drawing tasks averaged across conditions were significantly correlated (p < 0.001) with a correlation coefficient of −0.838. The overall trend for both tasks was that performance was least accurate in the Sparse VE condition. Interestingly, a high proportion of targets were correctly located in the real space after learning in all presentation modes, indicating that the visual information provided in each condition, even the Sparse VE, was sufficient for learning to navigate between targets.
Figure 4.
Mean proportion of targets correctly localized by younger normally-sighted participants in four presentation modes. Error bars indicate +/− 1 standard error.
Figure 5.
Mean error (measured in number of 15-foot hallway units) in the map drawing task by younger normally-sighted participants in four presentation modes. Error bars indicate +/− 1 standard error.
The Effect of Video Game Experience on Performance
Considering the age range of these participants, it is possible that video game experience influenced performance in the virtual environments. Games such as first-person action and driving/racing games require navigating from a first-person perspective through virtual environments that are visually sparse, at least at the time of testing (ca., 2004). Participants who played these types of games may have exhibited better performance in the Sparse VE compared to people without video game experience. Therefore, we conducted a post-experiment survey to evaluate the video game experience of our participants four years after they were tested. We were able to obtain data for only eleven of the sixteen participants. Six of these participants did not have experience with video games at the time of the study; the other five spent at least half an hour per week playing video games that involved navigating through virtual environments.
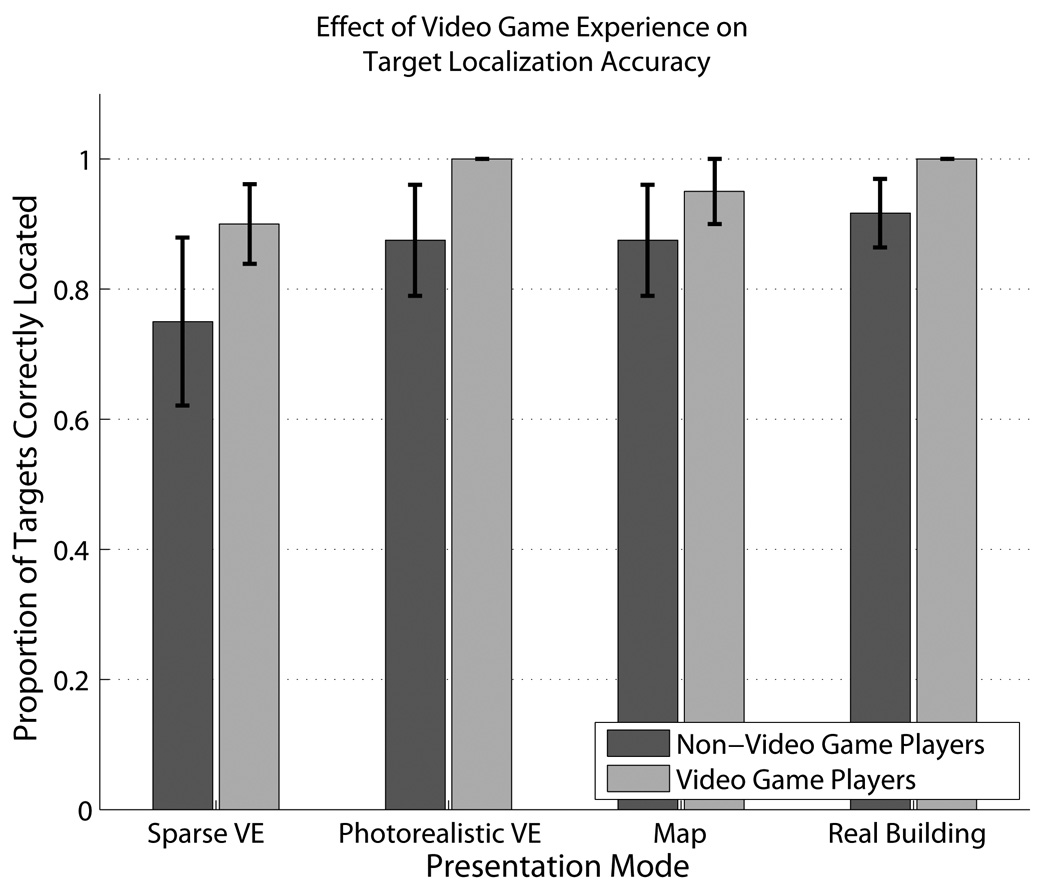
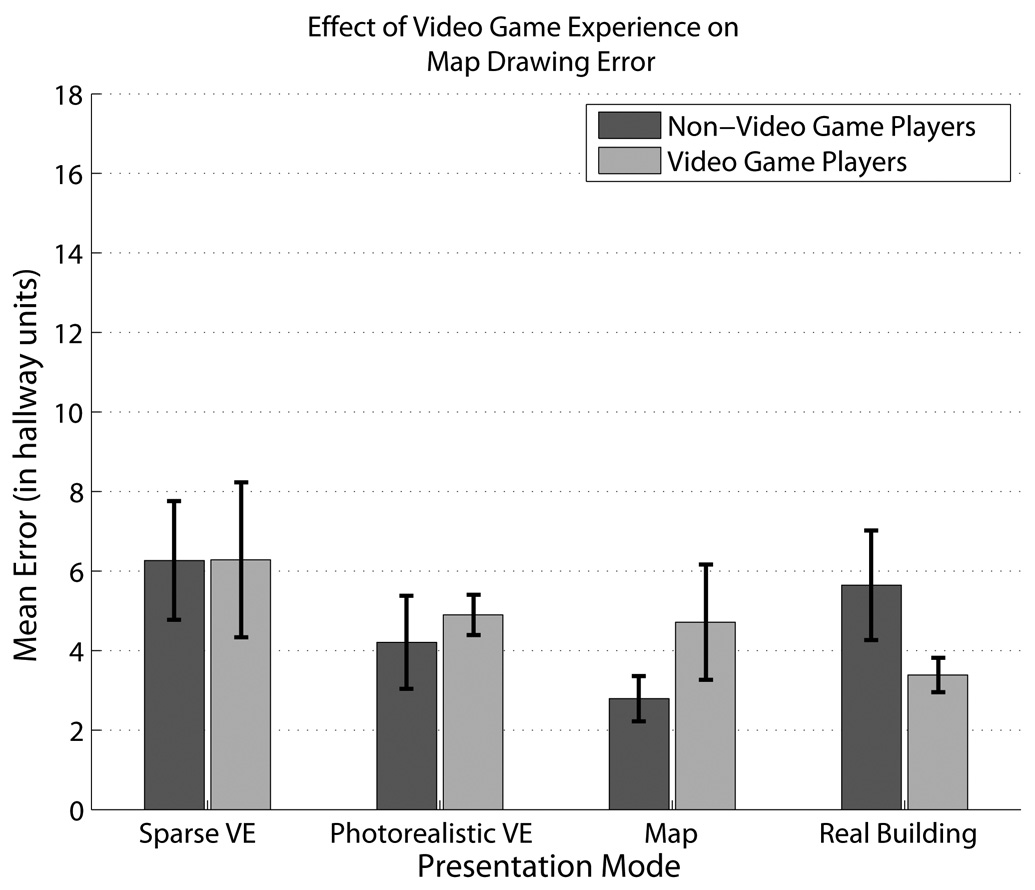
The target localization performance and map drawing error of the video game players and non-video game players are shown in Figure 6 and Figure 7. Wilcoxon Rank Sum tests (the nonparametric version of the independent samples t-test) did not reveal significant differences across conditions between participants with and without video game experience in either the target localization or map drawing tasks. We acknowledge a trend that video game players have higher target localization accuracy in all conditions compared to non-video game players, as shown in Figure 6, but this difference was not significant. Because we were specifically interested in whether video game experience accounted for similar performance in the Sparse and Photorealistic VEs, we conducted a Wilcoxon Signed Rank Test (the nonparametric version of the matched-samples t-test) to compare performance in the VEs of the non-video game players. We did not find significant differences in either target localization accuracy or map drawing error, suggesting that video game experience did not selectively improve performance in the Sparse VE.
Figure 6.
Mean proportion of targets correctly localized by younger normally-sighted participants with and without video game experience. Error bars indicate +/− 1 standard error.
Figure 7.
Mean error (measured in number of 15-foot hallway units) in the map drawing task by younger normally-sighted participants with and without video game experience. Error bars indicate +/− 1 standard error.
Discussion
For the normally-sighted young adults tested in this experiment, the type of visual information rendered in the first-person virtual environments significantly affected the acquisition rate but not the accuracy of layout knowledge. Non-geometric cues accelerated the acquisition of layout information; significantly less exploration was needed in the Photorealistic VE compared to the Sparse VE to learn the locations of targets in the layout. However, participants demonstrated similar layout knowledge after learning in either the Sparse or Photorealistic VE, which supports previous findings that non-geometric cues do not improve the accuracy of the acquired mental representation (Ruddle, et al., 1997; Thompson, et al., 2004). We interpret these results as showing that non-geometric information speeds up acquisition of layout knowledge for novel environments, but is not necessary for developing an accurate mental representation of the space.
Learning layouts in the Map and Real building conditions did not significantly improve performance compared to learning in the Photorealistic VE, indicating no advantage of having global layout information or non-visual cues. It is possible that the localization task was not challenging enough to distinguish performance between the Photorealistic VE, Map, and Real building conditions. Also, the types of VEs or tasks used to measure performance may influence these results. Previous studies in photorealistic VEs found that non-visual cues increase the efficiency of navigational search (Ruddle & Lessels, 2006) and the ability to accurately point to targets in a layout (Waller, et al., 2004). Non-visual information also aids spatial updating when only sparse visual information is available (Chance, et al., 1998; Klatzky, et al., 1998). Like the current study, Ruddle & Peruch (2004) found that non-visual information did not improve target localization, measured as the distance travelled to targets, in mazes that included non-geometric cues. Our study is in agreement with this finding that non-visual information may not be useful for learning the locations of targets when non-geometric visual information is available.
Video game experience did not account for comparable layout knowledge after learning in the Sparse and Photorealistic VEs. It is known that action video games improve perceptual abilities such as the capacity, spatial distribution, and temporal characteristics of visual attention (Green & Bavelier, 2003), but their influence on spatial navigation abilities needs further investigation. Studies that have examined the effect of prior computer experience and attitudes towards computers on virtual environment learning have found mixed results (Waller, 2000; Waller, et al., 2001); therefore, it is still unclear how computer experience might influence performance.
Experiment 1 replicated previous findings that non-geometric information does not improve the accuracy of mental representations of building layouts for younger, normally-sighted individuals. The next experiment investigated whether the same is true for people with visual impairments.
EXPERIMENT 2
In Experiment 2, we predicted that low-vision participants would acquire more accurate cognitive maps when learning in the Sparse VE compared to the Photorealistic VE because critical geometric information was rendered with high-contrast features, and extraneous non-geometric cues were removed. The presence of non-geometric features could hinder learning if they are hard to identify or are treated as visual clutter rather than useful information. The idea of contrast enhancement for low vision is incorporated into closed-circuit TV (CCTV) magnifiers (Lund & Watson, 1997) and has been explored in image-enhancement algorithms for face recognition (Peli, Lee, Trempe, & Buzney, 1994) and TV images (Peli, 2005).
A practical goal of this experiment was to assess the potential utility of virtual visual displays as navigation aids for low vision. Blind individuals can use tactile maps (Holmes, et al., 1996) and verbal descriptions of layout geometry (Giudice, 2004; Giudice, Bakdash, & Legge, 2007) to learn a layout before visiting it. Sparse VEs that display high-contrast renderings of geometrical information may also be useful low-vision aids if they improve wayfinding.
Methods
Experiment 2 followed the same procedure as Experiment 1 except for the alterations discussed below.
Participants
Thirteen people with low vision (mean age = 41, SD = 18, 6 males, 7 females) were recruited from the community. Participants had a wide range of visual characteristics as described in Table 1. Visual acuity was measured using the Lighthouse Distance Visual Acuity Chart. Contrast sensitivity was measured with the Pelli-Robson Chart. Diagnosis and field status were obtained from reports supplied by the participant’s ophthalmologist or optometrist. The participants were not familiar with the psychology building where testing occurred and received monetary compensation for their time.
Table 1.
Description of thirteen low-vision participants tested in Experiment 2. Central field loss is scotoma within 5 degrees of the fovea. Peripheral field loss is scotoma anywhere outside 5 degrees from the fovea.
| Participant | Age | Gender | Diagnosis | LogMAR Acuity | Log Contrast Sensitivity | Field Loss |
|---|---|---|---|---|---|---|
| 1 | 25 | F | Aniridia | 0.78 | 1.65 | None |
| 2 | 20 | M | Retinitis pigmentosa | 1.34 | 1.35 | Peripheral |
| 3 | 29 | F | Albinism | 0.9 | 1.5 | Peripheral |
| 4 | 31 | M | Retinitis pigmentosa | 0.58 | 0.9 | Peripheral |
| 5 | 52 | F | Retinopathy of prematurity, nystagmus | 0.96 | 1.05 | Peripheral |
| 6 | 24 | F | Retinopathy of prematurity | 1.18 | 0.9 | None |
| 7 | 38 | M | Stargardts disease | 1.04 | 1.05 | Central |
| 8 | 53 | F | Optic atrophy, no vision in left eye | 1.52 | 0.3 | Details not available |
| 9 | 18 | M | Scotoma caused by brain tumor | 1.02 | 1.2 | Details not available |
| 10 | 67 | M | Macular degeneration in left eye, cataracts in both | 0.88 | 0.9 | Central |
| 11 | 51 | M | Macular degeneration (Doynes’ Macular Dystrophy) | 1.04 | 1.65 | Central |
| 12 | 66 | F | Cone-rod dystrophy | 0.70 | 1.20 | Central |
| 13 | 62 | F | Retinitis pigmentosa | 1.24 | 0.45 | Peripheral with spread to central |
We were non-selective in the nature of the visual conditions of the participants because our focus was on the general effect of low vision rather than specific types of visual impairment. Enrollment was restricted to individuals with no known cognitive deficits or physical deficits limiting mobility, and to individuals with vision adequate enough to perceive the features in the virtual environments necessary for the navigation tasks. The experiments were time consuming, requiring five to six hours for each participant. Because of the length and demands of the testing paradigm, our sampling of low-vision participants was skewed towards younger individuals with long-standing forms of visual impairment.
Materials
The environments displayed on a computer were the same as in Experiment 1 with one exception. In the Map condition, the cursor was an enlarged, blinking, white and black triangle embedded in a gray square. The size of the triangle could be altered for each participant to ensure that its position and pointing direction could be seen.
Procedure
Participants were trained in each presentation mode displayed on the computer. The experimenter described in detail the features displayed on the computer screen (e.g., doors, windows, and lighting reflections in the Photorealistic VE) and verified that participants could see and describe the geometry of nearby intersections as rendered on the screen. Next, participants practiced moving through the layout using key presses, and followed a series of directions given by the experimenter (e.g. “Turn at the next intersection”). Participants had to successfully follow the experimenter’s directions before continuing with testing.
Map Drawing
Low-vision participants used Legos to create a map of each layout. They were instructed to build hallways by connecting Lego pieces on a 15 × 15 grid of nodes. Each Lego piece represented one fifteen-foot (4.6 m) hallway segment in the real environment. Participants also pointed to the target locations on their Lego map.
Results
Acquisition of Layout Knowledge
The rate of acquisition was significantly affected by Presentation Mode (F(3, 36) = 19.107, p < 0.001, ηp2 = 0.61); participants spent significantly more time exploring in the Sparse VE than either with the Map or in the Real building (p < 0.001) (Figure 8). However, there was not a significant difference in exploration time between the Sparse and Photorealistic VEs. Five of the eleven participants used as many or more moves to explore the Photorealistic VEs compared to the Sparse VEs. Therefore, acquisition of layout information was not necessarily easier with non-geometric information than with only geometric information, but varied by individual.
Figure 8.
Mean proportion of moves used by low-vision participants to reach criterion learning in four presentation modes. Error bars indicate +/− 1 standard error.
Six participants (from Table 1 participants 5, 7, 8, 10, 12 and 13) did not pass the learning test in the Sparse VE, and of them, two (8 and 10) did not pass criterion in the Photorealistic VE. Also, there was a significant order effect (F(3, 36) = 4.847, p = 0.006, ηp2 = 0.29), but pairwise comparisons did not reveal significant differences between conditions.
Accuracy of Layout Knowledge
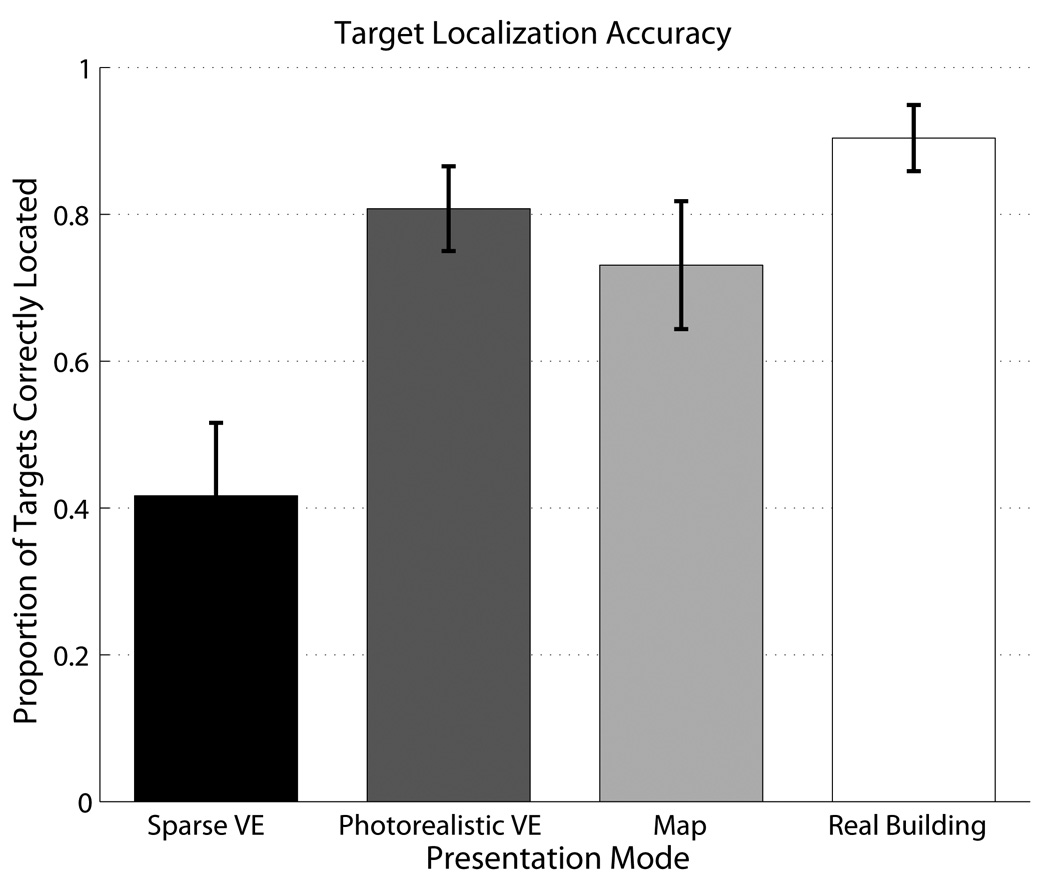
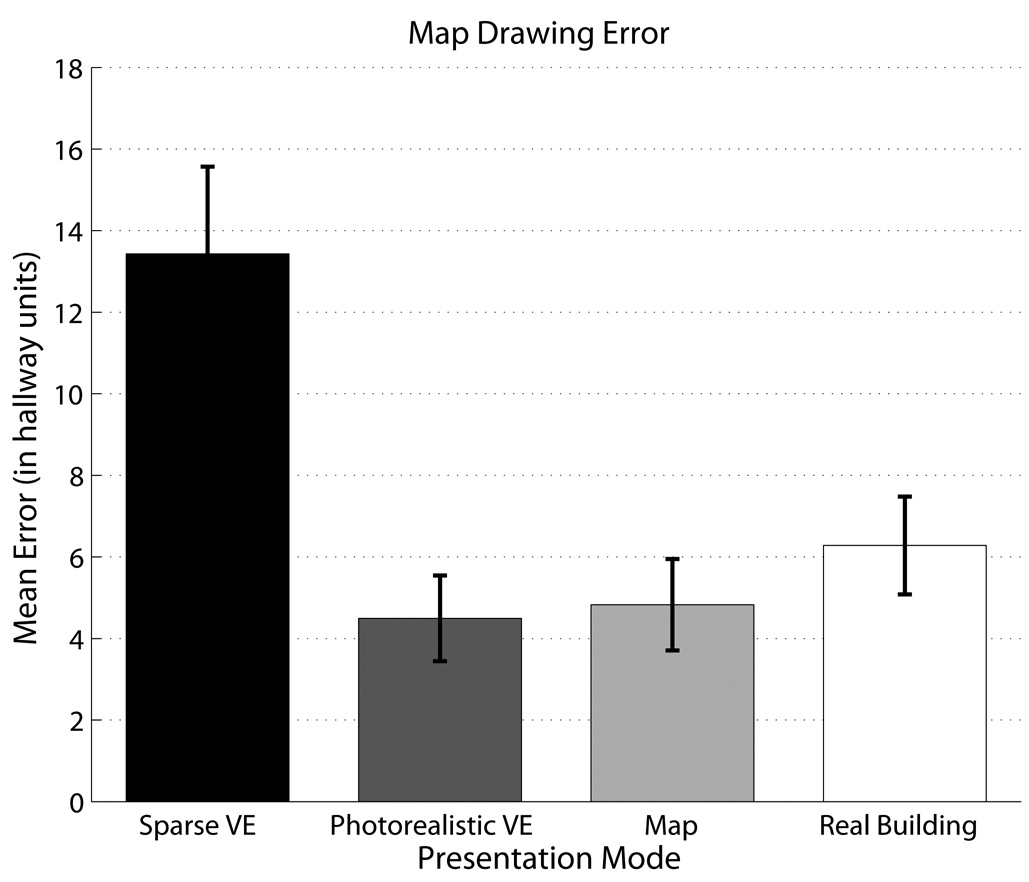
Significant differences were found in both target localization accuracy (χ2(3) = 18.73, p < 0.001, ηp2 = 0.48) and map drawing error (F(3, 33) = 9.503, p < 0.001, ηp2 = 0.46). These results are presented in Figure 9 and Figure 10. Performance in both tasks after learning in the Photorealistic VE was better compared to the Sparse VE (p < 0.01), but similar to learning in the Map and Real building conditions. These findings suggest that, contrary to our prediction, low-vision participants developed more accurate mental representations of layouts in the Photorealistic VE compared to the Sparse VE. Furthermore, target localization was less accurate in the Sparse VE condition compared to the Map (p = 0.002) and Real building (p < 0.001) conditions. Map drawing error was also greater after learning in the Sparse VE compared to learning in the Map condition (p = 0.007).
Figure 9.
Mean proportion of targets correctly localized by low-vision participants in four presentation modes. Error bars indicate +/− 1 standard error.
Figure 10.
Mean error (in hallway units) in the map drawing task by low-vision participants in four presentation modes. Error bars indicate +/− 1 standard error.
Relationship between Performance and Ocular Factors
Learning by participants in the virtual environments may be related to the nature of their visual impairment. Although we did not select participants with the goal of linking their performance to ocular factors, we did examine the relevant correlations to determine what relationships might exist. Also, because we recruited participants who had enough vision to see the VEs, there is likely a restriction in the range of acuity, contrast sensitivity, and field loss of those tested.
Acuity did not correlate with any of the performance measures for either the Sparse or Photorealistic VE. Strong correlations were found between the proportion of moves used during learning and log threshold contrast sensitivity in both the Sparse VE (r = −0.696, p = 0.008) and the Photorealistic VE (r = −0.700, p = 0.008). Previous research has also shown that contrast sensitivity has a greater impact on orientation and mobility than acuity (Marron & Bailey, 1982). We did not have sufficient information on visual-field status to compute correlations, but previous studies indicate that visual field loss is associated with increased errors in obstacle avoidance (Turano, et al., 2004). Field loss from eye disease (Rieser, Hill, Talor, Bradfield, & Rosen, 1992) or artificial restriction (Mason, 2002) also results in decreased wayfinding performance.
Discussion
Contrary to our prediction, low-vision participants demonstrated more accurate layout knowledge after learning with non-geometric information than with only high-contrast geometric information. Performance after learning in the Photorealistic VE was equivalent to learning with a map or in a real building. Yet, acquisition of layout knowledge required similar amounts of exploration in both types of VEs.
Many participants did not pass the learning criterion with only geometric information. Given more exploration time, a difference might have emerged in the acquisition rate between the two VEs, and the difference in the accuracy of layout knowledge may have disappeared. Either scenario indicates that acquiring layout knowledge is more difficult with only geometric visual information.
Because performance in the Photorealistic VE was comparable to learning with a Map or in the Real building, difficulty acquiring layout knowledge in the Sparse VE cannot be attributed to a lack of familiarity with first-person virtual environments or with the keystroke interface. Therefore, the results must be due to the visual information provided in these displays and how they are used to learn the layout.
Experiment 2 also demonstrated that people with low vision can use visual displays to learn novel layouts; learning with a map or a Photorealistic VE was comparable to learning by walking around in the real space. Both types of computer displays could potentially be used for pre-journey exploration and familiarization with buildings. High-contrast visual maps could be used on-the-fly during travel using a laptop or PDA. Also, low-vision participants performed better with maps than in the Photorealistic VE, a result found previously with normally-sighted participants (Farrell, et al., 2003). This result and the fact that it is easier and less costly to generate maps of buildings suggest that maps are more practical as a visual navigation aid than VEs for the visually impaired.
The broad age distribution of the low-vision participants may be a contributing factor to the reduced performance in the Sparse VE. Our low-vision group included seven participants younger than 50 and six older than 50. All but one of the participants who did not pass the learning test in the Sparse VE were older than 50 years old. This observation suggests that older participants may have had more difficulty acquiring layout knowledge in the Sparse VE. The goal of Experiment 3 was to test the effects of age on our navigation tasks, which helped in interpreting the low-vision results in Experiment 2.
EXPERIMENT 3
Visual impairments are more common among the older population, largely because of the prevalence of age-related eye diseases. Non-visual age-related factors might contribute to the ability to use only geometric or additional non-geometric information when learning indoor layouts, as suggested previously by Moffatt & Resnick (2002). Therefore, in Experiment 3 we tested a group of older participants (ages 50–70) with normal vision to explore whether age affects the ability to learn layouts in the Sparse and Photorealistic VEs.
Methods
Participants
We tested four males and four females between the ages of 50 and 70 (mean age = 60, SD = 5), all with normal or corrected-to-normal vision. All participants passed the Mini-Mental State Exam (scores ranged from 29–30 out of 30), designed to assess general cognitive functioning. Participants were also asked to rate their health status (1 = poor, 5 = very healthy, median participant rating = 4.5), level of activity (1 = not active, 5 = very active, median rating = 4), driving experience (1 = never drive, 4 = drive daily, median rating = 4), and computer experience (1 = never use computer, 4 = use computer daily, median rating = 3). Participants were not familiar with the psychology building where testing occurred and were monetarily compensated for their time.
Procedure
The materials and procedure were identical to those used in Experiment 1 except that participants were not tested in the Map condition because the primary purpose was to assess how age affects performance in the Sparse and Photorealistic VE conditions.
Results
Acquisition of Layout Knowledge
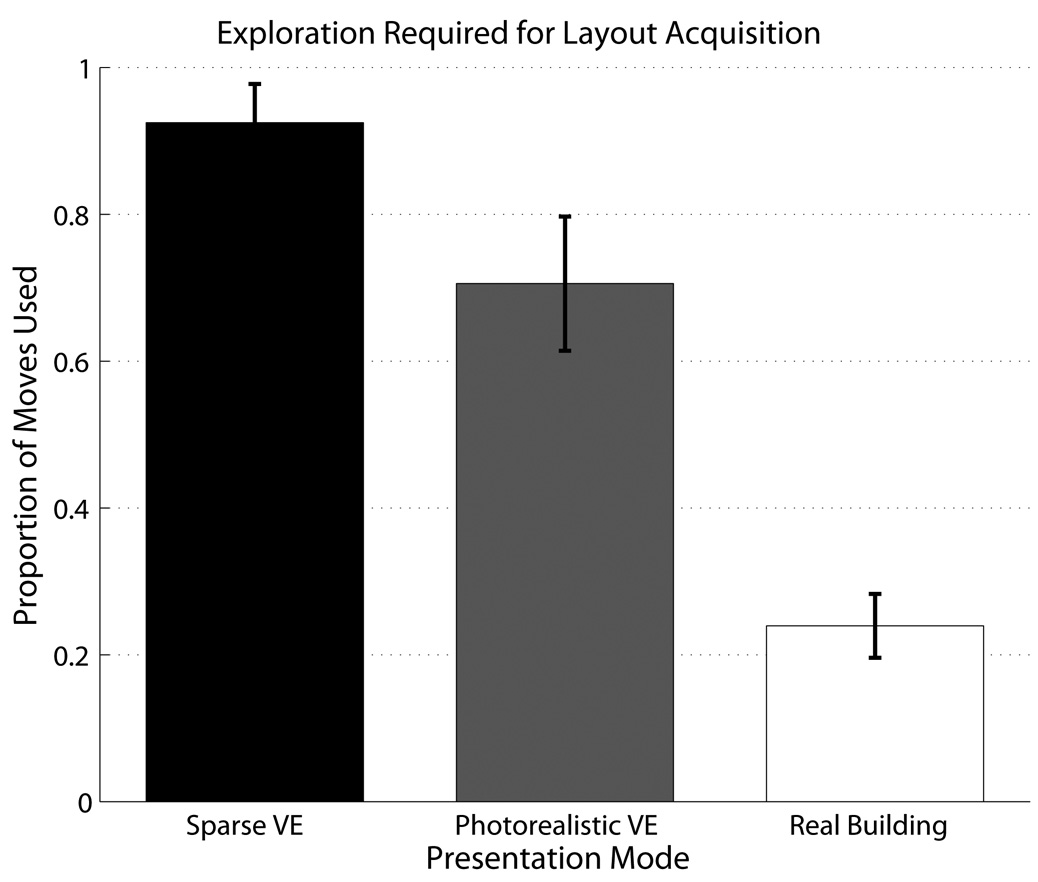
Rates of acquisition varied significantly by Presentation Mode (F(2, 14) = 27.973, p < 0.001, ηp2 = 0.80). Significantly more exploration was required in the Sparse and Photorealistic VEs compared to the Real building (p < 0.01) as shown in Figure 11. However, there was no difference in exploration time between the two virtual environments. Furthermore, six participants were not able to pass the learning criterion in the Sparse VE, and four of these participants also did not pass in the Photorealistic VE. This indicates that some participants found it particularly difficult to learn layouts using desktop virtual environments.
Figure 11.
Mean proportion of moves used by older normally-sighted participants to reach criterion learning in three presentation modes. Error bars indicate +/− 1 standard error.
Accuracy of Layout Knowledge
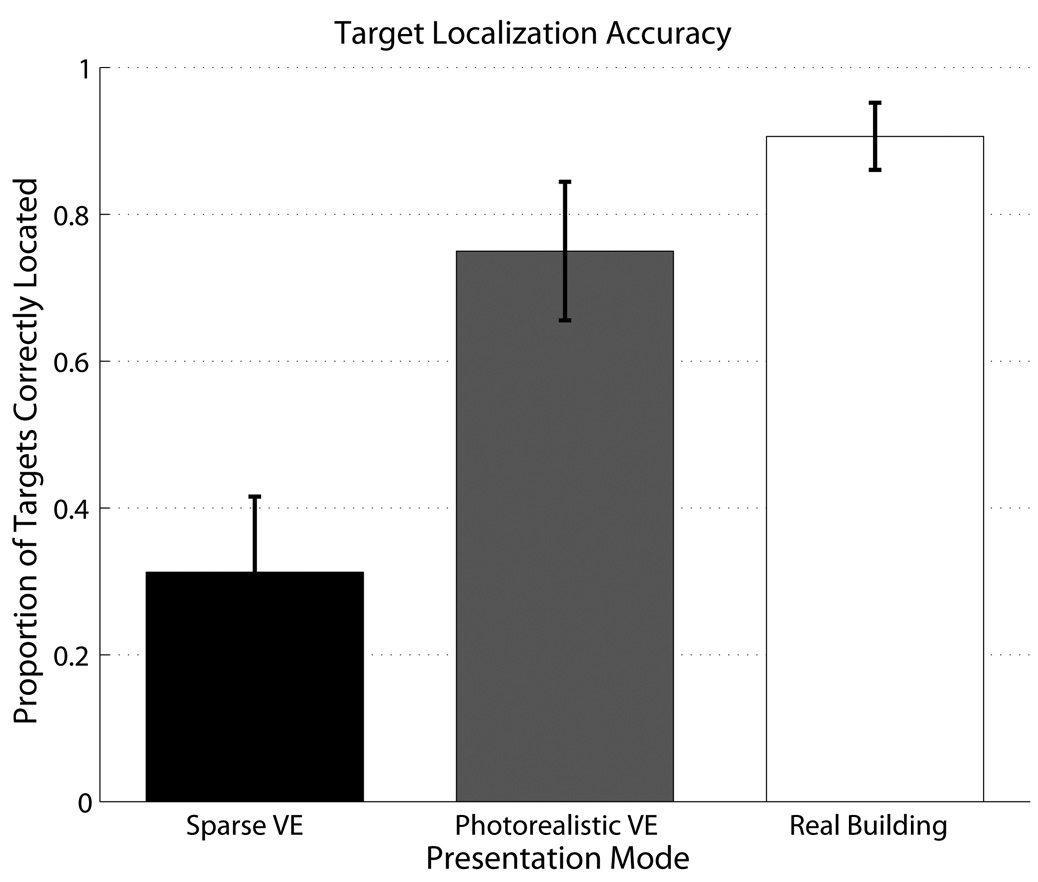
Performance on target localization varied significantly with Presentation Mode (χ2(2) = 11.12, p = 0.004, ηp2 = 0.70). As depicted in Figure 12, performance was significantly worse after learning in the Sparse VE than either the Photorealistic VE (p = 0.012) or the Real building (p = 0.003). Similar to the low-vision participants, non-geometric visual information was useful for encoding and representing the correct locations of targets in memory. Map drawing performance did not reveal significant differences between presentation modes (F(2, 14) = 3.263, p = 0.069, ηp2 = 0.32), although the trend was still that layout knowledge was least accurate in the Sparse VE (Figure 13). There were no significant correlations between individual ratings of computer ability and acquisition rate or accuracy of layout knowledge.
Figure 12.
Mean proportion of targets correctly localized by older normally-sighted participants in three presentation modes. Error bars indicate +/− 1 standard error.
Figure 13.
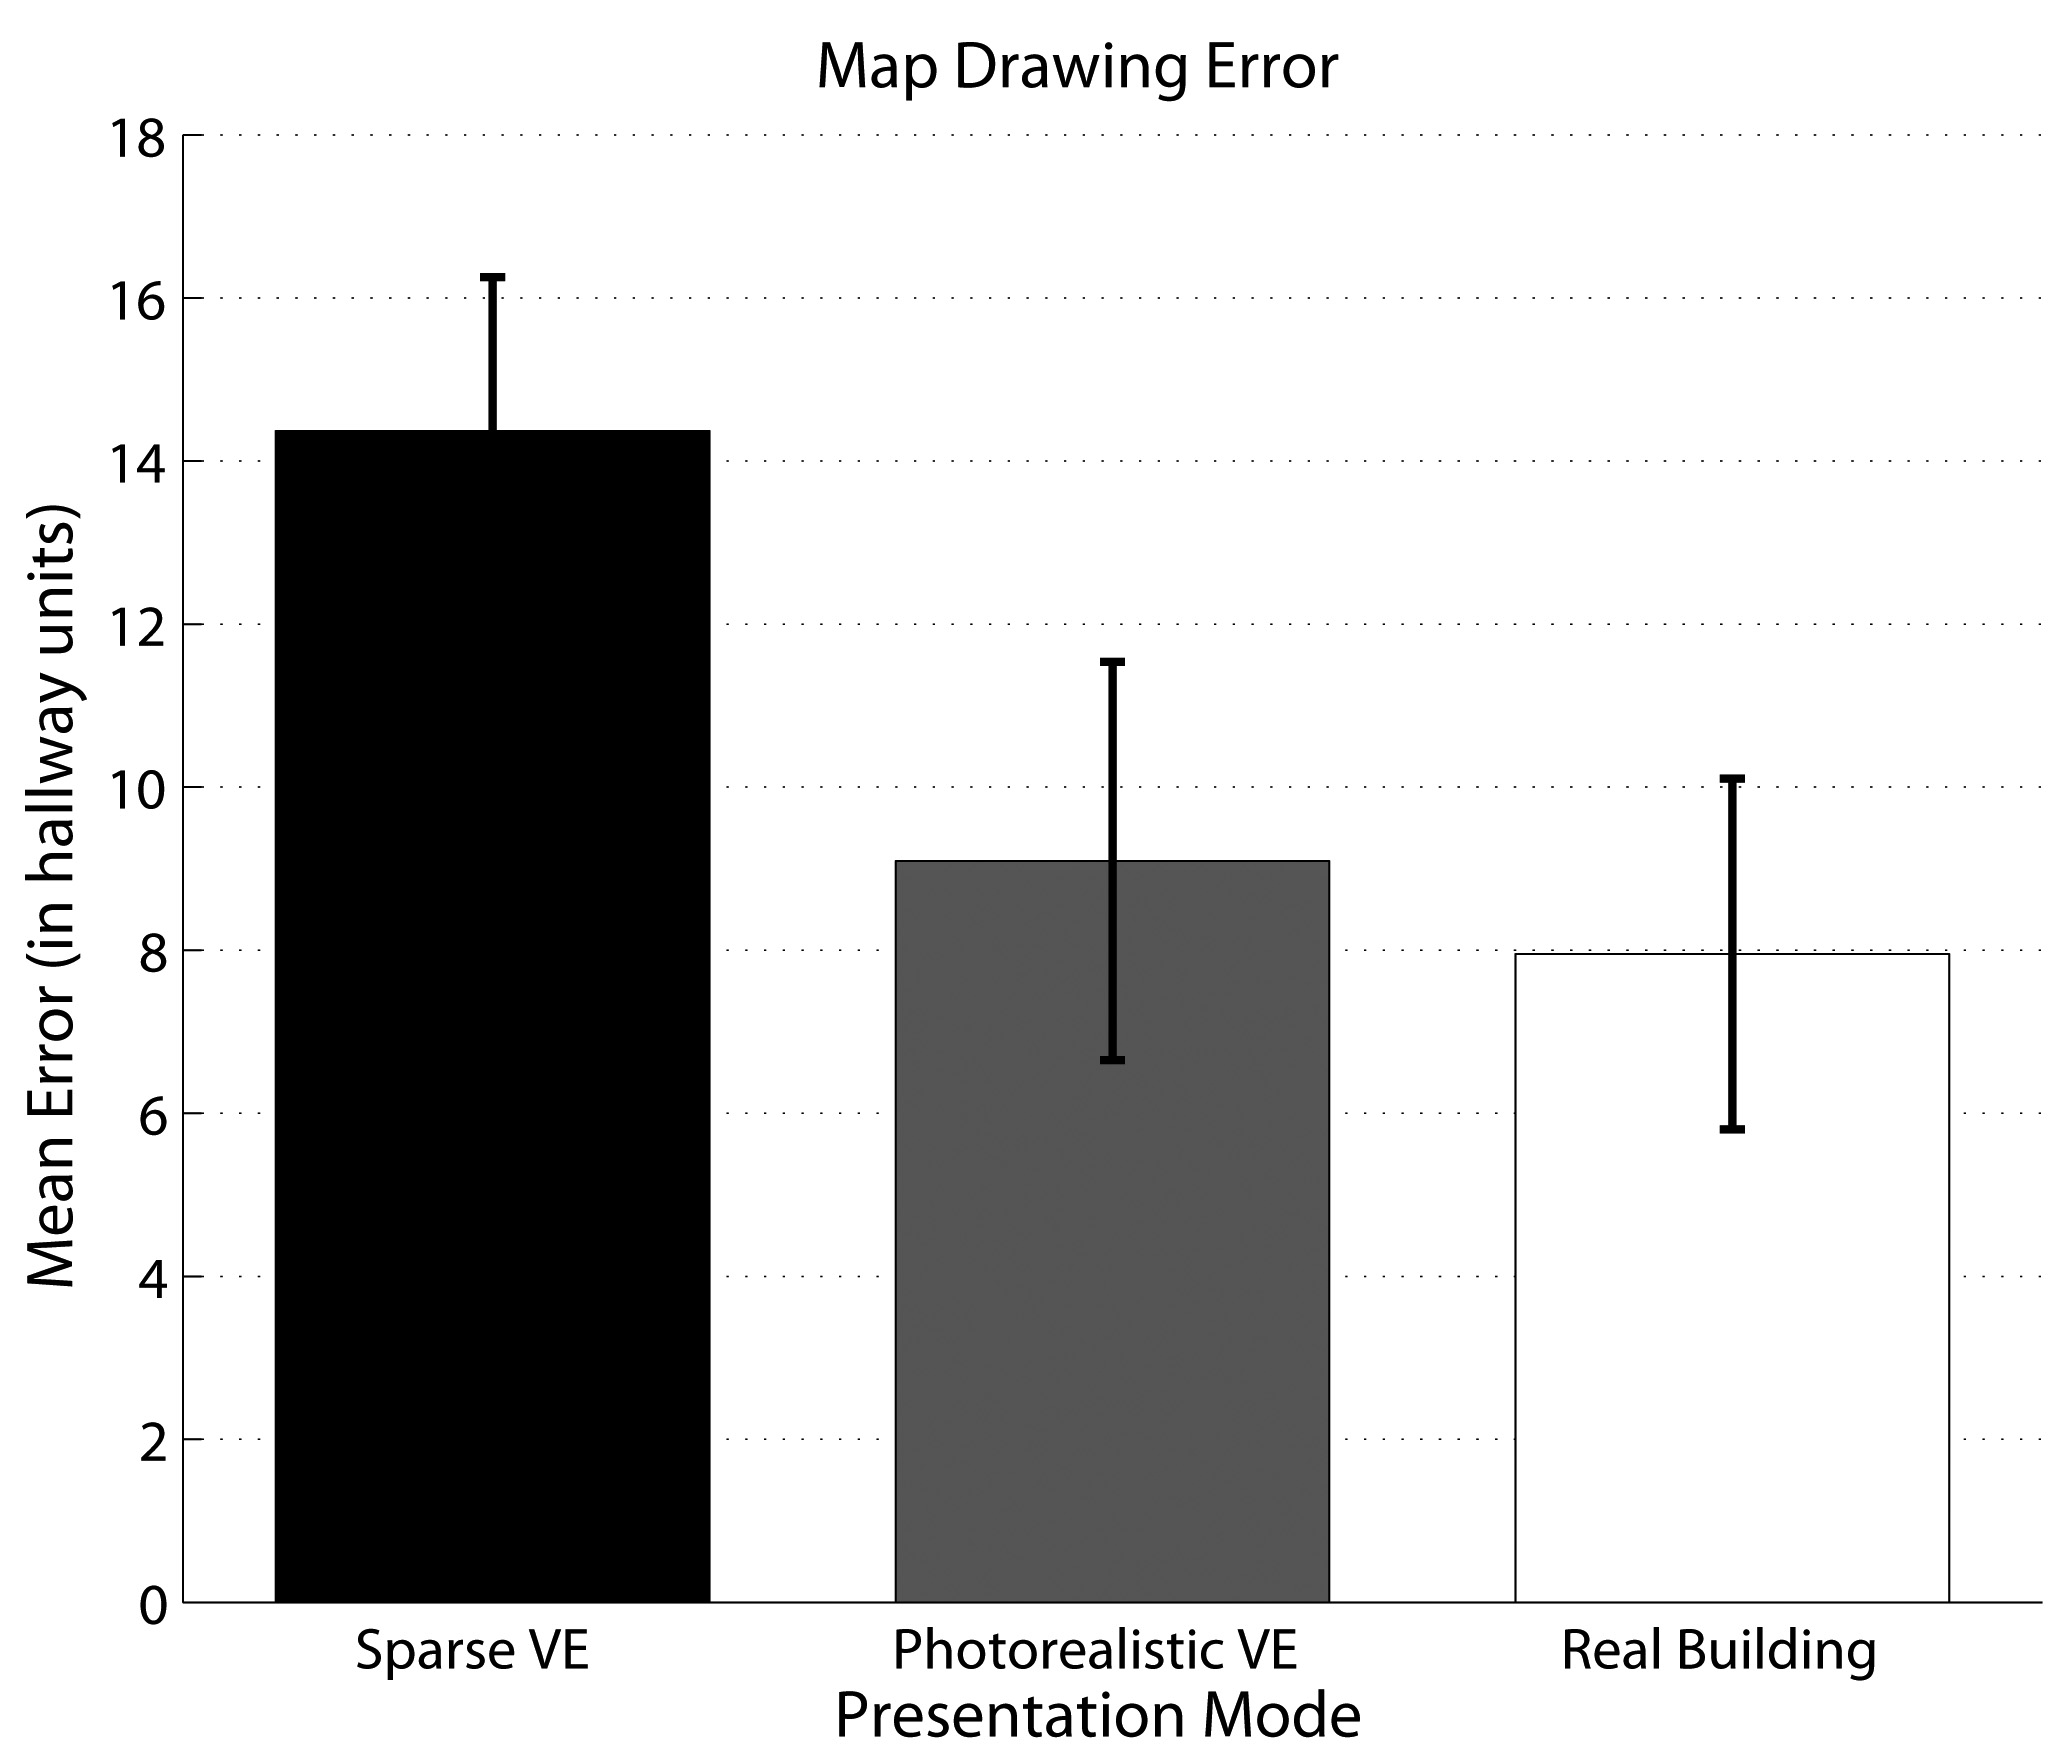
Mean error (in hallway units) in the map drawing task by older normally-sighted participants in three presentation modes. Error bars indicate +/− 1 standard error.
Comparing the Effects of Visual Impairment and Age on Performance
The results of the older normally-sighted adults showed a similar pattern to the low-vision group (Experiment 2). The acquisition rates for both groups showed that the Sparse VE required the most exploration to pass the learning criterion, but not significantly more than the Photorealistic VE. Furthermore, both the low-vision and older groups demonstrated significant differences in overall layout knowledge between presentation modes. Target localization accuracy was most affected by the visual information available during learning; both groups performed significantly worse after learning in the Sparse VE compared to the Photorealistic VE.
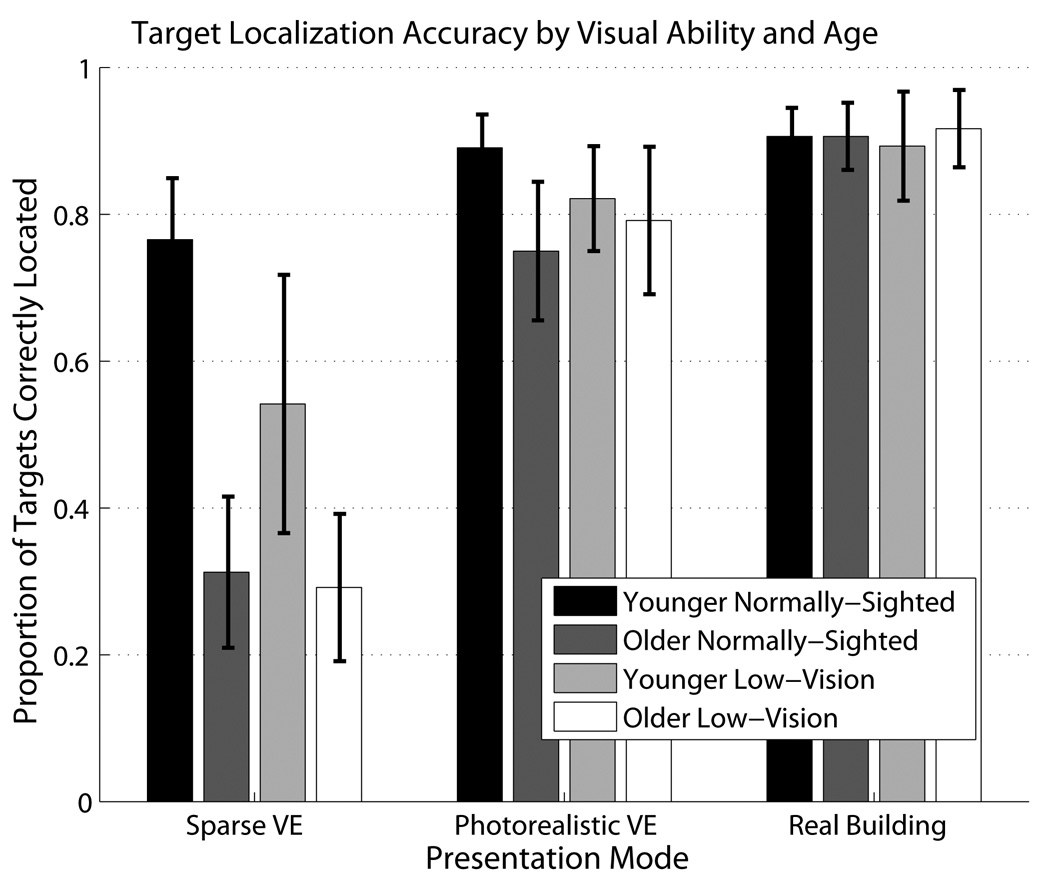
Figure 14 combines target localization data from all three experiments in a plot of performance by visual ability and age. It indicates that individuals in the same age group had similar target localization scores regardless of visual ability. We performed Wilcoxon Rank Sum tests to evaluate the effects of Visual Condition and Age, and a Friedman test to evaluate the effect of Presentation Mode. The results revealed a significant effect of Age (p = 0.011) but not Visual Condition. There was also a highly significant effect of Presentation Mode (χ2(2) = 26.14, p < 0.001) with significant differences between the Sparse VE and the other conditions (Bonferronized pairwise comparisons: p < 0.001). Wilcoxon Rank Sum tests between the performance of younger and older individuals in the three Presentation Modes only revealed a significant effect in the Sparse VE (p = 0.002) but not in the other conditions. Together, these results suggest that age, rather than the conjunction of age and vision loss, drives performance in the Sparse and Photorealistic VEs. Older people find it much more difficult to learn layouts based solely on geometrical information, and therefore seem to benefit more from the addition of non-geometrical cues.
Figure 14.
Mean proportion of targets correctly localized (+/− 1 SE) for younger and older adults with normal and low vision.
Discussion
These results indicate that age does influence the ability to learn layouts in virtual environments. Older participants had difficulty on tasks assessing layout knowledge, especially target localization, after learning in the Sparse VE, which is consistent with previous studies (Moffatt & Resnick, 2002). This indicates that the decreased performance of low-vision participants in the geometrical environments (Experiment 2) could be at least partially due to the inclusion of older participants.
Aging is related to declines in declarative learning, which is influenced by working memory capability (Kirasic, Allen, Dobson, & Binder, 1996). The demands of trying to disambiguate position with only geometric visual information may impose more cognitive load than can be handled by older people, resulting in a decreased ability to encode layout information. Previous research has demonstrated that even younger adults exhibit less than optimal navigation performance compared to an ideal observer because of limitations in remembering their path in geometric environments (Stankiewicz, Legge, Mansfield, & Schlicht, 2006). Older individuals may be even more affected by memory limitations while navigating and may rely more on non-geometric cues that require fewer cognitive resources when encoding locations in a mental representation of a layout. This coincides with the results of previous experiments that have suggested that older adults reproduce target locations more accurately with object landmark information than with only geometric information (Moffatt & Resnick, 2002).
Non-visual information, associated with walking in the real building, was advantageous for older normally-sighted adults, allowing them to learn layouts more quickly. These cues seem to facilitate memory for spatial layout, perhaps by reducing the cognitive load required to integrate information over multiple views in the vision-only environments.
GENERAL DISCUSSION
These experiments investigated the types of visual information needed by younger and older normal and low-vision individuals when learning novel indoor layouts. By comparing performance in Sparse and Photorealistic VEs, we specifically tested whether geometric information by itself (Sparse VEs) was sufficient for learning layouts from a first-person perspective or whether the rendering of additional non-geometric information (Photorealistic VEs) was advantageous. We measured both the acquisition and accuracy of layout knowledge after learning in the different presentation modes (Sparse VE, Photorealistic VE, Map, and Real building).
Resolving Ambiguous Geometric Visual Information
All groups of participants found it more difficult to learn layouts with only geometric information; the addition of non-geometric information improved acquisition and/or accuracy of layout knowledge. Geometric visual renderings can result in ambiguity about locations in a layout. For example, the rectangular environments described in the Introduction had identical geometric structure at opposite corners that were easily confusable for rats (Cheng, 1986) or children (Hermer & Spelke, 1996). The same geometrical ambiguities can exist in more complex environments. For example, suppose a layout, rendered only with geometrical hallway structure, has two T-junctions. When you arrive at a T-junction, how do you know which one it is?
Consider two options for resolving the ambiguity: 1) Perceptual solution: The two T-intersections may differ in the distances to adjacent intersections and the branching patterns at the adjacent intersections. If you encoded geometric information to this level of detail during layout acquisition, you can use it to resolve the ambiguity; 2) Path memory: You can resolve the ambiguity if you remember your previous location and the path taken to reach the current T-junction, assuming a unique path is required to reach each T-junction from the previous location. Both of these techniques provide means for spatial updating within purely geometrical layouts, but require demanding perceptual encoding and/or memory processes.
It is plausible that impaired vision or natural aging could reduce the capacity to accomplish perceptually or cognitively demanding spatial updating. Individuals with visual impairments may not be able to detect perceptual differences in layout structure, and older adults may have reduced memory capacity. If so, a third kind of mechanism, the presence of additional redundant non-geometrical cues could be helpful. For instance, one of the two T-intersections might have a water fountain that could resolve the geometrical ambiguity if either of the two strategies just outlined could not be used. Thus, non-geometric information may be especially useful for people with visual impairment or who are older.
Conclusions
The acquisition of layout knowledge was clearly influenced by the visual information available during exploration for all groups of participants. Non-geometric visual cues reduced the amount of exploration needed to learn a novel layout, especially for younger normally-sighted individuals.
Non-geometric information improved the accuracy of layout knowledge for both the low-vision and older normally-sighted groups, but not for younger normally-sighted individuals. Low-vision and older sighted people especially benefited when localizing targets in the real building after learning layouts with non-geometric information.
It is likely that age was a contributing factor in explaining the relatively poor performance of the low-vision participants when only geometric information was available during learning, as indicated by Figure 14. One implication is that degradation in visual function does not necessarily lead to reduced performance. Also, considering that the low-vision population is older, this age effect is important in determining the types of visual displays that will be useful navigation aids for people with low vision.
We also compared learning in the first-person VEs to learning with Maps and in a Real building. Learning in the Map condition resulted in similar performance compared to the Photorealistic VE and the Real building in all three experiments, suggesting no advantage to having global layout information when visually-rich information from a first-person perspective is available. Non-visual information was only advantageous for older normally-sighted adults.
Finally, we demonstrated that people with low vision can learn layouts as effectively using Maps and Photorealistic VEs displayed on a desktop computer as walking through a real building. Yet, older individuals may not learn as quickly in VEs as in real buildings.
In conclusion, this study showed that information about layout geometry is sufficient for learning complex indoor layouts, at least by younger individuals with normal vision. Additional non-geometric information aids learning by low-vision and older people. The reason for this reliance on non-geometric information may be due to the increased cognitive demands required to create and use cognitive maps with only geometrical information. A positive practical outcome was that individuals with low vision can use virtual displays to learn layouts prior to going to a real building, which may have applications for developing indoor navigation aids.
Acknowledgments
This project was funded by NIH grants T32 HD007151 (Interdisciplinary Training Program in Cognitive Science) and T32 EY07133 to Amy Kalia, EY02857 and EY017835 to Gordon Legge, and T32 EY07133 to Nicholas Giudice.
We thank Brian Stankiewicz and Paul Beckmann for allowing us to use the Photorealistic virtual environments which they created.
Contributor Information
Amy A. Kalia, Department of Psychology, University of Minnesota Twin-Cities.
Gordon E. Legge, Department of Psychology, University of Minnesota Twin-Cities.
Nicholas A. Giudice, Department of Psychology, University of California Santa Barbara.
References
- Chance SS, Gaunet F, Beall AC, Loomis JM. Locomotion mode affects the updating of objects encountered during travel: The contribution of vestibular and proprioceptive inputs to path integration. Presence. 1998;7(2):168–178. [Google Scholar]
- Cheng K. A purely geometric module in the rat's spatial representation. Cognition. 1986;23:149–178. doi: 10.1016/0010-0277(86)90041-7. [DOI] [PubMed] [Google Scholar]
- Cheng K, Newcombe NS. Is there a geometric module for spatial orientation? Squaring theory and evidence. Psychonomic Bulletin & Review. 2005;12(1):1–23. doi: 10.3758/bf03196346. [DOI] [PubMed] [Google Scholar]
- Eye Disease Prevalence Research Group. Causes and prevalence of visual impairment among adults in the United States. Archives of Ophthalmology. 2004;122:477–485. doi: 10.1001/archopht.122.4.477. [DOI] [PubMed] [Google Scholar]
- Farrell MJ, Arnold P, Pettifer S, Adams J, Graham T, MacManamon M. Transfer of route learning from virtual to real environments. Journal of Experimental Psychology: Applied. 2003;9(4):219–227. doi: 10.1037/1076-898X.9.4.219. [DOI] [PubMed] [Google Scholar]
- Gallistel CR. The Organization of Learning. Cambridge, MA: MIT Press; 1990. [Google Scholar]
- Giudice NA. Navigating novel environments: A comparison of verbal and visual learning. (Doctoral dissertation, University of Minnesota, 2004) Dissertation Abstracts International B. 2004;65:6064. [Google Scholar]
- Giudice NA, Bakdash JZ, Legge GE. Wayfinding with words: Spatial learning and navigation using dynamically-updated verbal descriptions. Psychological Research. 2007;71(3):347–358. doi: 10.1007/s00426-006-0089-8. [DOI] [PubMed] [Google Scholar]
- Gouteux S, Thinus-Blanc C. Rhesus monkeys use geometric and non-geometric information during a reorientation task. Journal of Experimental Psychology: General. 2001;130(3):505–519. doi: 10.1037//0096-3445.130.3.505. [DOI] [PubMed] [Google Scholar]
- Green CS, Bavelier D. Action video game modifies visual selective attention. Nature. 2003;423:534–537. doi: 10.1038/nature01647. [DOI] [PubMed] [Google Scholar]
- Hermer L, Spelke E. Modularity and development: the case of spatial reorientation. Cognition. 1996;61:195–232. doi: 10.1016/s0010-0277(96)00714-7. [DOI] [PubMed] [Google Scholar]
- Holmes E, Jansson G, Jansson A. Exploring auditorily enhanced tactile maps for travel in new environments. New Technologies in the Education of the Visually Handicapped. 1996;237:191–196. [Google Scholar]
- Kelly D, Spetch M, Heth C. Pigeons’ (Columba livia) encoding of geometric and featural properties of a spatial environment. Journal of Comparative Psychology. 1998;112(3):259–269. [Google Scholar]
- Kirasic KC, Allen GL, Dobson SH, Binder KS. Aging, cognitive resources, and declarative learning. Psychology and Aging. 1996;11(4):658–670. doi: 10.1037//0882-7974.11.4.658. [DOI] [PubMed] [Google Scholar]
- Klatzky RL, Loomis JM, Beall AC, Chance SE, Golledge RG. Spatial updating of self-position and orientation during real, imagined, and virtual locomotion. Psychological Science. 1998;9(4):293–298. [Google Scholar]
- Kuyk T, Elliott JL. Visual factors and mobility in persons with age-related macular degeneration. Journal of Rehabilitation Research & Development. 1999;36(4):303–312. [PubMed] [Google Scholar]
- Lessels S, Ruddle RA. Changes in navigational behaviour produced by a wide field of view and a high fidelity visual scene. Proceedings of the 10th Eurographics Symposium on Virtual Environments (EGVE'04); 2004. pp. 71–78. [Google Scholar]
- Lessels S, Ruddle RA. Movement around real and virtual cluttered environments. Presence: Teleoperators and Virtual Environments. 2005;14:580–596. [Google Scholar]
- Loomis JM, Klatzky RL, Avraamides M, Lippa Y, Golledge RG. Functional equivalence of spatial images produced by perception and spatial language. In: Mast F, Jäncke L, editors. Spatial Processing in Navigation, Imagery, and Perception. New York: Springer; 2007. pp. 29–48. [Google Scholar]
- Lund R, Watson GR. The CCTV Book: Habilitation and rehabilitation with closed circuit television systems. Frolund, Norway: Synsforum; 1997. [Google Scholar]
- Marron JA, Bailey IL. Visual factors and orientation-mobility performance. American Journal of Optometry and Physiological Optics. 1982;59(5):413–426. doi: 10.1097/00006324-198205000-00009. [DOI] [PubMed] [Google Scholar]
- Mason SJ. Unpublished Honors thesis. Minneapolis: University of Minnesota; 2002. Indoor way-finding with restricted visual fields. [Google Scholar]
- Moffat SD, Resnick SM. Effects of age on virtual environment place navigation and allocentric cognitive mapping. Behavioral Neuroscience. 2002;116(5):851–859. doi: 10.1037//0735-7044.116.5.851. [DOI] [PubMed] [Google Scholar]
- Moffat SD, Zonderman AB, Resnick SM. Age differences in spatial memory in a virtual environment navigation task. Neurobiology of Aging. 2001;22(5):787–796. doi: 10.1016/s0197-4580(01)00251-2. [DOI] [PubMed] [Google Scholar]
- Peli E. Recognition performance and perceived quality of video enhanced for the visually impaired. Ophthalmic Physiological Optics. 2005;25(6):543–555. doi: 10.1111/j.1475-1313.2005.00340.x. [DOI] [PMC free article] [PubMed] [Google Scholar]
- Peli E, Lee E, Trempe CL, Buzney S. Image enhancement for the visually impaired: The effects of enhancement on face recognition. Journal of the Optical Society of America. 1994;11(7):1929–1939. doi: 10.1364/josaa.11.001929. [DOI] [PubMed] [Google Scholar]
- Rieser JJ, Hill EW, Talor CR, Bradfield A, Rosen S. Visual experience, visual field size, and the development of nonvisual sensitivity to the spatial structure of outdoor neighborhoods explored by walking. Journal of Experimental Psychology: General. 1992;121(2):210–221. doi: 10.1037//0096-3445.121.2.210. [DOI] [PubMed] [Google Scholar]
- Rosenzweig ES, Redish AD, McNaughton BL, Barnes CA. Hippocampal map realignment and spatial learning. Nature Neuroscience. 2003;6(6):609–615. doi: 10.1038/nn1053. [DOI] [PubMed] [Google Scholar]
- Ruddle RA, Lessels S. For efficient navigational search humans require full physical movement but not a rich visual scene. Psychological Science. 2006;17:460–465. doi: 10.1111/j.1467-9280.2006.01728.x. [DOI] [PubMed] [Google Scholar]
- Ruddle RA, Payne SA, Jones DM. Navigating buildings in “desk-top” virtual environments: Experimental investigations using extended navigational experience. Journal of Experimental Psychology: Applied. 1997;3(2):143–159. [Google Scholar]
- Ruddle RA, Peruch P. Effects of proprioceptive feedback and environmental characteristics on spatial learning in virtual environments. International Journal of Human Computer Studies. 2004;60:299–326. [Google Scholar]
- Sjölinder M, K. Hook K, Nilsson L, Andersson G. Age differences and the acquisition of spatial knowledge in a three-dimensional environment: Evaluating the use of an overview map as a navigation aid. International Journal of Human-Computer Studies. 2005;63(6):537–564. [Google Scholar]
- Sovrano V, Bisazza A, Vallortigara G. Modularity and spatial reorientation in a simple mind: Encoding of geometric and non-geometric properties of a spatial environment by fish. Cognition. 2002;85:B51–B59. doi: 10.1016/s0010-0277(02)00110-5. [DOI] [PubMed] [Google Scholar]
- Stankiewicz BJ, Kalia AA. Acquisition of structural versus object landmark knowledge. Journal of Experimental Psychology: Human Perception & Performance. 2007;33(2):378–390. doi: 10.1037/0096-1523.33.2.378. [DOI] [PubMed] [Google Scholar]
- Stankiewicz BJ, Legge GE, Mansfield JS, Schlicht EJ. Lost in Virtual Space: Studies in Human and Ideal Spatial Navigation. Journal of Experimenal Psychology: Human Perception & Performance. 2006;32(3):688–704. doi: 10.1037/0096-1523.32.3.688. [DOI] [PubMed] [Google Scholar]
- Thompson WB, Willemsen P, Gooch AA, Creem-Regehr SH, Loomis JM, Beall AC. Does the quality of the computer graphics matter when judging distance in visually immersive environments? Presence: Teleoperators and Virtual Environments. 2004;13:560–571. [Google Scholar]
- Turano KA, Broman AT, Bandeen-Roche K, Munoz B, Rubin GS, West SK. Association of visual field loss and mobility performance in older adults: Salisbury Eye Evaluation Study. Optometry & Vision Science. 2004;81(5):298–307. doi: 10.1097/01.opx.0000134903.13651.8e. [DOI] [PubMed] [Google Scholar]
- Tversky B. Distortions in memory for maps. Cognitive Psychology. 1981;13:407–433. [Google Scholar]
- Vallortigara G, Zanforlin M, Pasti G. Geometric modules in animals' spatial representations: A test with chicks (Gallus gallus domesticus) Journal of Comparative Psychology. 1990;104(3):248–254. doi: 10.1037/0735-7036.104.3.248. [DOI] [PubMed] [Google Scholar]
- Waller D. Individual differences in spatial learning from computer-simulated environments. Journal of Experimental Psychology: Applied. 2000;6(4):307–321. doi: 10.1037//1076-898x.6.4.307. [DOI] [PubMed] [Google Scholar]
- Waller D, Knapp D, Hunt E. Spatial representations of virtual mazes: The role of visual fidelity and individual differences. Human Factors. 2001;43(1):147–158. doi: 10.1518/001872001775992561. [DOI] [PubMed] [Google Scholar]
- Waller D, Loomis JM, Haun DBM. Body-based senses enhance knowledge of directions in large-scale environments. Psychonomic Bulletin & Review. 2004;11:157–163. doi: 10.3758/bf03206476. [DOI] [PubMed] [Google Scholar]
- West SK, Rubin GS, Broman AT, Munoz B, Bandeen-Roche K, Turano K. How does visual impairment affect performance on tasks of everyday life? Archives of Ophthalmology. 2002;120:774–780. doi: 10.1001/archopht.120.6.774. [DOI] [PubMed] [Google Scholar]
- Wilkniss SM, Jones MG, Korol DL, Gold PE, Manning CA. Age-related differences in an ecologically based study of route learning. Psychology and Aging. 1997;12(2):372–375. doi: 10.1037//0882-7974.12.2.372. [DOI] [PubMed] [Google Scholar]
- Wilson IA, Ikonen S, Gureviciene I, McMahan RW, Gallagher M, Eichenbaum H, et al. Cognitive aging and the hippocampus: how old rats represent new environments. Journal of Neuroscience. 2004;24(15):3870–3878. doi: 10.1523/JNEUROSCI.5205-03.2004. [DOI] [PMC free article] [PubMed] [Google Scholar]


