Abstract
This paper extends previous work on the Darwinian evolutionary fitness effect of the fixation of deleterious mutations by incorporating compensatory mutations, which are mutations (deleterious by themselves) that ameliorate other deleterious mutations, thus reducing the genetic load of populations. Since having compensatory mutations essentially changes the distributional shapes of deleterious mutations, the effect of compensatory mutations is studied by comparing distributions of deleterious mutations without compensatory mutations to those with compensatory mutations. The effect of effective population size (Ne), fitness distributional shape, and mutation rate on population fitness reduction is studied. Results indicate that, first, the smaller a population’s Ne, the larger the effect of compensatory mutations on fitness recovery, and the compensatory effect increases sharply with decreasing Ne. Second, the larger the squared coefficient of variation in the fitness effect of deleterious mutations, the larger the effect of compensatory mutations. Third, for fixed Ne, the higher the rate of deleterious mutations, the more effective compensatory mutation is in fitness recovery, and this effect is more pronounced for smaller Ne.
The distribution of the fitness effects of spontaneous mutations is an important subject that has many implications. For example, in conservation biology, knowing the distribution of the fitness effects of naturally occurring mutations in a species will help researchers understand the speed of fitness decay of the population due to the fixation of deleterious mutations and help theoretical estimation of the critical population size that is required to prevent the so-called “mutational meltdown” and thus achieve the conservation goal (Lande, 1998; Lynch et al., 1993; Whitlock, 2000). The distribution of mutation fitness effects also has an important effect on the amount of genetic load that human and other species have to bear. In fact, it is the calculation of the genetic load that led population geneticists to realize that despite the fact that the detailed distributional shape of mutation fitness effects harbored in the population is unknown, most of the mutations cannot be too deleterious because otherwise the genetic load would have been so unbearable that we and other species would not have been able to survive (Kimura, 1968).
The commonly accepted notion is that most of the spontaneous mutations are deleterious (i.e., have negative fitness effects on the survival of the individuals who carry them) and only a small fraction of them are beneficial. Mutagenesis and mutation-accumulation experiments suggest that the majority of deleterious mutations have very small fitness effects, with an average effect of only about 1% or less (Davies et al., 1999; Estes et al., 2004; Keightley, 1994; Vassilieva et al., 2000). To date, there has been a number of studies computationally estimating the distributional shapes of the fitness effects of deleterious mutations in different species (Eyre-Walker et al., 2006; Nielsen and Yang, 2003; Piganeau and Eyre-Walker, 2003; Sanjuan et al., 2004; Yampolsky et al., 2005). No single continuous distribution type has been found to be descriptive for all observations in different species. So far, a variety of continuous distributions (some of which are a special case of others) have been suggested and applied in the literature to quantify the fitness effect of deleterious mutations, including normal, exponential, gamma, and log-normal distributions.
However, compared with the research directed towards characterizing deleterious mutations, an important class of mutations, compensatory mutations, is relatively neglected. These mutations are also deleterious by themselves, however, they can compensate for the negative effect of other deleterious mutations when they appear together with the deleterious mutations. Empirical studies of compensatory mutations are largely owing to the studies of RNA structures. It is well known that the folding of RNA molecules into the stem-loop structure requires base pair matching in the stem part of the molecule, and mutations occurring to one segment of the stem part will disrupt the matching, and therefore, have a deleterious effect on the folding and stability of the molecule. It has been observed that mutations in the complementary segment can rescind the deleterious effect by mutating into a base pair that matches the already mutated base, thus recovering the fitness of the original molecule (Kelley et al., 2000; Wilke et al., 2003). Other direct empirical observations of compensatory mutations include the fitness recovery in RNA virus (Burch and Chao, 1999), DNA Bacteriophage phiX174 (Poon and Chao, 2005; 2006), and the compensatory effect of molecular chaperones (Fares et al., 2002).
Theoretical studies on compensatory mutations are few and far between. Poon and Otto (2000) recently adopted Fisher’s geometrical model of adaptation to study the population fitness effect of the fixation of deleterious mutations in small populations with the consideration of compensatory mutations. They found that the fixation of deleterious mutations causing extinction of a small population becomes increasingly unlikely when the scope of compensatory mutations increases, contradictory to what previous studies claim about the high likelihood of extinction of small populations due to mutational meltdown (Lynch et al., 1993). Similarly, Whitlock (2000) considered the effect of beneficial mutations on fitness recovery of small populations. However, Whitlock’s model does not incorporate the effect of compensatory mutations explicitly; instead, he considered two classes of mutations, deleterious and beneficial. There should be an important distinction between compensatory mutations and beneficial mutations. Beneficial mutations are mutations that have positive fitness effect on the individuals that carry them, whereas compensatory mutations should be deleterious by themselves, and only become beneficial or reduce the negative fitness effect of certain deleterious mutations when they are present in the same individuals. This can be easily imagined in the population—some individuals carry deleterious mutation A, some carry deleterious mutation B, some carry beneficial mutation C, some carry A and B, which lead to a reduced negative fitness effect, most of the rest of the individuals are mutation free. Therefore, it is evident that compensatory mutations could be the key to understanding the maintenance of small populations in nature without signs of going to extinction, and much research needs to be done in understanding the scope of compensatory mutations.
In this study, we examine the effect of population size on the compensatory mutations, investigating whether compensatory mutations have different rescue effects on populations of different sizes. Given the observation that some natural populations can be very small, if compensatory mutations have a relatively bigger effect on small populations’ fitness, then we should not ignore them, especially when considering small populations. We compare the effect of different effective population sizes on the net reduction of total fitness due to the fixation of deleterious mutations alone versus that due to the combination of both deleterious and compensatory mutations. We examine different combinations of parameters that describe the distributional shapes of the fitness effects of deleterious mutations and compensatory mutations to see how the reduction of total fitness changes as a result.
MATHEMATICAL DERIVATIONS
Consider a randomly mating diploid population and assume that the population is at an equilibrium between the number of new alleles due to mutation and the loss of alleles due to fixation. Let N be the population size, Ne is the effective population size [defined by Wright as “the number of breeding individuals in an idealized population that would show the same amount of dispersion of allele frequencies under random genetic drift or the same amount of inbreeding as the population under consideration” (Wright, 1931)], and s the selective coefficient of a mutation. Crow and Kimura (1970) derive the probability u(s) of fixation of a new allele as
| (1) |
The cumulative effect of deleterious mutations or the net fitness decay should depend on the number UD of deleterious mutations per generation per individual, the total number N of individuals in the population, the fitness effect s of mutations, and the fixation probability u(s) of mutations. In reality the distribution density fD(s) of the fitness effect of deleterious mutations is unknown a priori, and since the fixation probability u(s) of the deleterious mutation is a function of the fitness effect s, some sort of continuous distribution density fD(s) must be assumed. Assuming that the deleterious effect is additive, one can integrate over the distribution density fD(s) to obtain the net fitness change ΔWD due to deleterious mutations on the population. Precisely,
| (2) |
where the factor 2 is explained below, and the integral is only over negative fitness effects. Assume that all deleterious mutations are entirely recessive, so both wild type homozygotes and heterozygotes have a fitness of 1, whereas the mutant homozygotes have a fitness of 1−2∣s∣. Therefore, the (negative) fitness effect of such a deleterious mutation is 2s.
Assume that the distribution density fD(s) of s, −∞<s⩽0, can be described by a Gamma distribution on ∣s∣ with mean λD<0 and coefficient of variation CD. After a series of mathematical derivations [see Zhang and Watson (2007) for details], we obtain the following expression:
| (3) |
where
| (4) |
and
is the generalized Riemann zeta function.
In order to examine quantitatively the contribution of different intervals of selective coefficients to the population fitness, it is necessary to get a general expression of the above equation for any interval of selective coefficients within (−∞,0]. Specifically, for 0<a<b, the population fitness reduction due to deleterious mutations with a selective coefficient s such that a⩽∣s∣⩽b can be expressed as
| (5) |
where Nr=Ne∕N,
| (6) |
and
| (7) |
is the incomplete Gamma function, which becomes the Euler Gamma function Γ(α) when x=0. ΔWD(a,b) was derived by following exactly the derivation of ΔWD in Zhang and Watson (2007) and replacing the integrals by integrals . Since beneficial mutations are not being considered here, we will drop the subscript D, e.g., writing ΔWD as ΔW.
RESULTS AND DISCUSSION
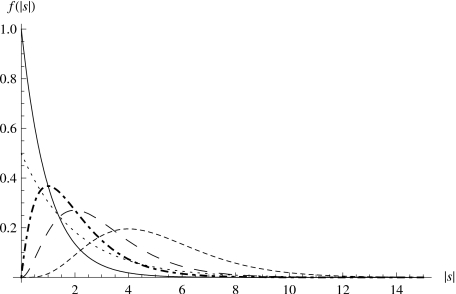
Before directly addressing compensatory mutations, we discuss some implications of the Gamma distribution assumption for the fitness effects of beneficial, deleterious, and compensatory mutations. Gamma distributions are defined by two parameters, α and θ, related to λD, CD used in Eqs. 3, 4, 5, 6 by , , ∣λD∣=αθ, . Figure 1 shows five Gamma distributions of selective coefficients with different sets of parameters, illustrating that the distribution of selective coefficients can assume different shapes and scales, which correspond biologically to different fitness effects of deleterious (or beneficial) mutations, and the spread of these effects. For example, compared to the distribution with α=5 and θ=1, the distribution with α=1 and θ=1 has a higher proportion of mutations with small fitness effects, and lower proportion of mutations with large fitness effects.
Figure 1. The Gamma distribution of selective coefficients.
α=1, θ=1 (solid); α=2, θ=1 (dot-dashed); α=3, θ=1 (long-dashed); α=5, θ=1 (short-dashed); α=1, θ=2 (dotted).
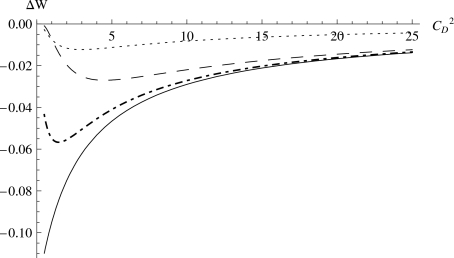
Figure 2 shows the effect of the squared coefficient of variation of selective coefficients on the total fitness change of a population. Several observations can be made. First, there exists a squared coefficient of variation of selective coefficients that maximizes the total population fitness reduction ∣ΔW∣, and its value depends on the distribution of fitness effects of the deleterious mutations. For certain distributions of fitness effects of deleterious mutations, one can find the exact value of by setting the derivative of ΔW with respect to equal to zero. For example, when N=1000, UD=100, Ne=100, and λD=−0.02,; when N=1000, UD=100, Ne=100, and λD=−0.2, . Second, in general, regardless of the distributional shapes of the fitness effects of deleterious mutations, the higher the squared coefficient of variation of selective coefficients, the less fitness reduction ∣ΔW∣ the overall deleterious mutations cause the population. This suggests that even for small populations, as long as there is a large variation in the fitness effects of deleterious mutations, the fixation of deleterious mutations will have a small negative effect on the population. Third, for the same distributional shape of fitness effects, the reduction ∣ΔW∣ of overall population fitness decreases greatly as the effective population size increases (e.g., dot-dashed versus dotted curve in Fig. 2).
Figure 2. The effect of the squared coefficient of variation of selective coefficients on the total fitness change of a population.
(ΔW). All curves have N=1000 and UD=100.Ne=0.1 N and λD=−0.002 (solid); Ne=0.1 N and λD=−0.02 (dot-dashed); Ne=0.1 N and λD=−0.2 (long-dashed); Ne=0.3 N and λD=−0.02 (dotted).
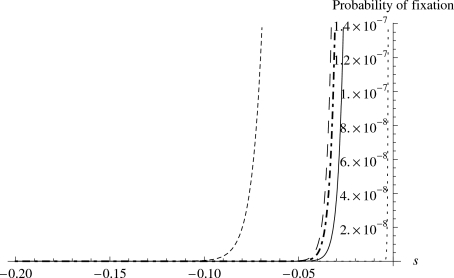
Fourth, when holding all other parameters constant, the total fitness of a population decreases more rapidly as CD decreases when the mean fitness effect of the deleterious mutations (λD) is small (in magnitude). The same holds true for fixed CD. This is counter-intuitive. The observation that the higher (in magnitude) the mean negative fitness effects of the distribution, the less total fitness reduction the deleterious mutations create, suggests that it is probably due to the fact that deleterious mutations with large (in magnitude) negative effects have lower probability of fixation in the population, therefore, they do not contribute much to the final fitness reduction. To address this, we examine the fixation probability u(s) as a function of the selective coefficient of mutation s. Figure 3 supports the above explanation for the counter intuitive observation deduced from Fig. 2. Clearly, the fixation probability u(s) of a deleterious mutation is very sensitive to the effective population size (Ne), but not sensitive to the real population size (N). Moreover, the probability of fixation of a deleterious mutation decreases rapidly as its negative fitness effect increases in magnitude. Therefore, it seems that deleterious mutations with large (in magnitude) negative effects, because the probability of their fixation is very low, do not eventually contribute much to the reduction of the total fitness of the population, which seems to be more the result of deleterious mutations with small effects. In classical models, these small effect mutations are considered to be effectively neutral when Ne∣s∣⪡1.
Figure 3. The fixation probability decreases rapidly with the increasing negative effect s of a deleterious mutation.
Ne=100, Ne∕N=0.1 (solid); Ne=100, Ne∕N=0.5 (dot-dashed); Ne=100, Ne∕N=1 (long-dashed); Ne=1000, Ne∕N=1 (dotted); Ne=50,Ne∕N=1 (short-dashed).
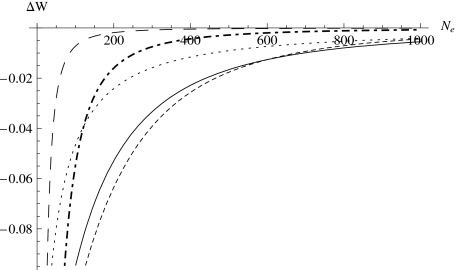
Figure 4 shows the total fitness reduction as a result of fixation of deleterious mutations for different effective population sizes (Ne). Figure 4 indicates several things. First, the reduction of the total fitness of a population decreases (in magnitude) when its effective population size increases and the reduction levels off at a certain Ne (hereafter called the level-off Ne), which depends on the mean negative fitness effect of deleterious mutations. The smaller (in magnitude) the mean negative fitness effect, the larger the Ne required for the level off of the reduction in total fitness. Since the total fitness of a population decreases rapidly when the effective population size gets smaller than the level-off Ne, and it has been shown that the effective population size of a natural population is on average around 10% of the census population size (Frankham, 1995), in this case Ne≈100, we can see that for many distributions, especially the ones with small (in magnitude) mean fitness effects (i.e., λD≈0), the total population fitness reduction can be very high.
Figure 4. The total fitness reduction of a population as a function of the effective population size.
All curves assumeN=1000 and UD=100. for λD=−0.002 (solid), λD=−0.02 (dot-dashed), and λD=−0.2 (long-dashed). The remaining two curves correspond to and λD=−0.002 (dotted), and λD=−0.002 (short-dashed).
We now turn our attention to the main topic of the paper. The distribution of fitness effects of spontaneous mutations is unknown, so to study the effect of compensatory mutations (under the Gamma distribution assumption for mutations), we choose a number of different combinations of parameters for illustration. Specifically, we compare the total fitness reduction in a population taking into account compensatory mutations (ΔWc) to that without compensatory mutations (ΔWnc): ΔWdiff=ΔWc−ΔWnc.
First, we compare different Gamma distributions that can be used to represent distributions with∕without the influence of compensatory mutations. As compensatory mutations should make deleterious mutations less deleterious, for a specific Gamma distribution with certain α and θ (see Fig. 1) corresponding to noncompensatory deleterious mutations, compensatory mutations will move the Gamma distribution towards the origin (i.e., the distribution with compensatory mutations should have either smaller α than the original, or smaller θ than the original, or both). Note that here we do not explicitly model the intricate interaction between and relative temporal dynamics of deleterious mutations and their compensatory mutations, which we assume can be modeled by changing the distributional shape of the deleterious mutations, similar to Whitlock’s modeling of dependent mutations by changing the effective population size Ne (Whitlock, 2000). In terms of λD and , the distribution with compensatory mutations should tend to have smaller (in magnitude) mean negative fitness effects and possibly larger squared coefficient of variation of fitness effects. Based on this idea, we choose several distributional shapes to examine the compensatory effect. The distributions are shown in Fig. 5. All distributions have the same squared coefficient of variation , but different mean fitness effects (λD=−0.0001 for the distribution of compensatory mutations versus −0.0002, −0.001, −0.01, −0.1, −0.2 for noncompensatory mutations). Therefore, compared with the noncompensatory mutation’s fitness distributional shapes, the compensatory mutation’s distributional shape of selective coefficient f(∣s∣) has a larger proportion of deleterious mutations that have small (in magnitude) negative fitness effects.
Figure 5. Thick solid curve represents the distributional shape of the fitness effects of deleterious mutations with compensatory mutations, and all other curves represent only deleterious mutations.
All curves have the same , and varying λD. λD=−0.0001 (thick solid), λD=−0.0002 (solid), λD=−0.001 (dot-dashed), λD=−0.01 (long-dashed), λD=−0.1 (dotted), λD=−0.2 (short-dashed).
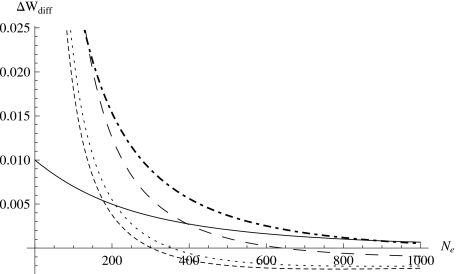
Figure 6 shows the compensatory effects as a function of effective population size. The compensatory effect is very significant when the effective population size is small, and the compensatory effect decreases sharply over a small range of Ne. The smaller the effective population size, the larger the compensatory effect is on the total population fitness. If we assume that the effective population size is about 10% of the real population size, in all the cases considered in Fig. 6, the compensatory effect is very large, i.e., considering the effect of compensatory mutations on the total population fitness is quite different from not doing so. A second observation is that the compensatory effect essentially “loses” when the effective population size reaches a certain point. In fact, the effect reverses: the total fitness reduction with compensatory mutations is greater than that without compensatory mutations (i.e., ΔWdiff<0). This is a bit puzzling. One plausible explanation is that as the effective population size increases, for the distribution without compensatory mutations with large mean deleterious effects, most of the mutations do not get fixed in the population, only a small fraction of them get fixed. However, this altogether does not contribute as much negative total fitness as the distribution with compensatory mutations; for the latter, a possibly larger fraction of deleterious mutations, each with less negative fitness effect, get fixed in the population, and because their fraction is large, the fixation of these mutations actually results in more fitness reduction. Therefore, the efficiency of compensatory effects is higher in small populations.
Figure 6. The compensatory effect ΔWdiff for ΔWc with λD=−0.0001, , N=1000, UD=100, and ΔWnc with the same , N, UD, and varying λD.
λD=−0.0002 (solid), λD=−0.001 (dot-dashed), λD=−0.01 (long-dashed), λD=−0.1 (dotted), λD=−0.2 (short-dashed).
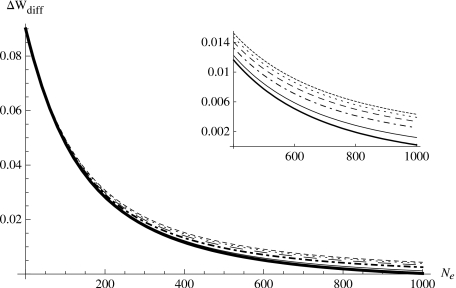
Although it is clear that compensatory mutations should reduce (in magnitude) the mean negative fitness effect of deleterious mutations, it is not so clear how the coefficient of variation will change as a result. This is because the coefficient of variation is the ratio of the standard deviation (σD) to the absolute mean fitness effect (∣λD∣), so when the absolute mean fitness effect is reduced due to compensatory mutations, the standard deviation may also be reduced, but the ratio of the two can be either decreased or increased. Therefore, we take into account this uncertainty and examine the compensatory effect on the population fitness reduction with varying squared coefficients of variation due to compensatory mutations, i.e., we assume the same distributional shape for the fitness effect of deleterious mutations without compensatory mutations (λD=−0.001 and ) but several distributional shapes for the fitness effect of deleterious mutations with compensatory mutations with the same (reduced in magnitude) mean negative fitness effect (λD=−0.0001) but varying squared coefficient of variation, either the same , lower , or higher than the original. Figure 7 shows the result. Interestingly, regardless of whether the squared coefficient of variation due to compensatory mutations is lower or higher than that for the distribution without compensatory mutations, the compensatory effect still exists. Moreover, although the larger the squared coefficient of variation, the larger the compensatory effect on the total population fitness reduction, the difference between compensatory effects for different squared coefficients of variation reduces as the effective population size decreases. For small effective population sizes, the difference between distributions with different squared coefficients of variation seems minor. Previous study shows that large coefficient of variation in the fitness effect of mutations, be it deleterious or beneficial, can help prevent or slow down the extinction of small populations (Zhang and Watson, 2007). The result shown here suggests that the compensatory effect of compensatory mutations in small populations is quite robust: as long as the mean negative fitness effect is reduced in magnitude, the compensatory effect persists regardless of the direction of change in the coefficient of variation.
Figure 7. The compensatory effect ΔWdiff with varying .
All curves are comparisons between λD=−0.0001 for compensatory distribution of s vs λD=−0.001 for noncompensatory distribution ofs with the same UD=100 and N=1000. The noncompensatory distribution of s has , the compensatory distribution of s has (thick solid), (solid), (dot-dashed), (long-dashed), (dotted), (short-dashed).
To further examine the relationship between the effective population size and compensatory effect, we change the rate of deleterious mutations UD. Figure 8 shows that when the distributions of fitness effects with and without compensatory mutations are both set, for the same effective population size, the compensatory effect increases as the rate of deleterious mutations increases, and the compensatory effect is more dramatic for smaller effective population sizes than larger ones with the change in the rate of deleterious mutations.
Figure 8. The compensatory effect ΔWdiff for ΔWc with λD=−0.0001, , and N=1000, and ΔWnc with the same , N, and λD=−0.001.
UD=1000 (solid), UD=500 (dot-dashed), UD=200 (long-dashed), UD=100 (dotted).
It is clear from the comparison of different distributional shapes with and without compensatory mutations that there is great uncertainty as to what distributional shapes of the fitness effects spontaneous mutations have, and how spontaneous compensatory mutations change the shapes. Alternatively, we ask “what classes of deleterious mutations do compensatory mutations compensate for?” If we classify deleterious mutations’ selective coefficients into different categories based on the degree of deleteriousness, then the question is “which categories of mutation do compensatory mutations have an impact on?” To examine this issue quantitatively, we use the intervals of selective coefficients for deleterious mutations that have been used in recent studies (Eyre-Walker et al., 2006; Yampolsky et al., 2005), which divided the spectrum of selective coefficients s into five intervals: (−∞,−L], (−L,−10−2], (−10−2,−10−4], (−10−4, −10−5], and (−10−5,0], where anything below −L is considered “lethal.” For each interval, we use Eq. 5 to compute the population fitness reduction due to the fixation of the deleterious mutations with fitness effects in the interval. Here, we quantitatively evaluate the compensatory effect of the compensatory mutations with different selection coefficient distributions shown in Fig. 6, all of which have . Note from Eq. 5 that for each interval (−b,−a] and fixed , the compensatory effect ΔWdiff=ΔWc−ΔWnc is the product of a factor independent of (−b,−a] with Γ*(a,b), which also depends on . Hence, the compensatory effect ΔWdiff is proportional to Γ*(a,b).
Taking L=1 and , Γ*(a,b) for the five intervals is, respectively, 0.090 609 4, 0.108 672, 0.000 715 842, 2.695 23×10−6, and 1.8152×10⁻⁷, which values are proportional to the fitness loss ΔW(a,b) caused by deleterious mutation effects in these intervals given a Gamma fitness effect distribution with . It can be seen that the fitness loss is mainly due to the mutations with highly deleterious effects, and this suggests that compensatory mutations, if having a large effect, should “rescue” the effect of deleterious mutations with especially large effects. With the same , N=1000, and UD=100, we compare the compensatory effect in the five intervals for three effective population sizes (100, 200, and 400). Assuming that compensatory mutations change the mean fitness effect from a noncompensatory value of λD to the compensatory value λD=−0.0001, then ΔWdiff is given in Table 1.
Table 1.
Compensatory effects ΔWdiff.
| Noncompensatory λD=−0.001 | Noncompensatory λD=−0.1 | |||||
|---|---|---|---|---|---|---|
| Ne=100 | Ne=200 | Ne=400 | Ne=100 | Ne=200 | Ne=400 | |
| (−∞,−L] | 0.014 043 4 | 0.006 954 39 | 0.002 543 28 | 0.009 901 51 | 0.002 490 74 | −0.000 272 54 |
| (−L,−10−2] | 0.016 842 8 | 0.008 340 71 | 0.003 050 27 | 0.011 875 3 | 0.002 987 26 | −0.000 326 87 |
| (−10−2,−10−4] | 0.001 110 947 | 0.000 054 941 8 | 0.000 020 092 7 | 0.000 078 225 | 0.000 019 677 6 | −2.153 15×10−6 |
| (−10−4,−10−5] | 4.177 29×10−7 | 2.068 63×10−7 | 7.565 15×10−8 | 2.945 27×10−7 | 7.408 87×10−8 | −8.106 88×10−9 |
| (−10−5,0] | 2.813 34×10−8 | 1.393 19×10−8 | 5.095 01×10−9 | 1.983 59×10−8 | 4.989 76×10−9 | −5.459 86×10−10 |
These data show that the compensatory effect of compensatory mutations decreases as the effective population size increases, and the efficiency of the compensatory effect is higher in small populations than large ones.
The general picture that emerges from the examination of different combinations of parameters is that compensatory mutations are an important class of mutations that cannot be ignored, especially in small populations. Although there is much uncertainty in various parameters in the model, it is clear that small populations with small Ne benefit the most from the interdependence of mutations. The results shown in Fig. 6 suggest that with those parameters, populations with a small Ne of less than 300 benefit greatly from compensatory mutations. A recent review of estimates of Ne in natural populations shows a median unbiased Ne estimate of 260 among 83 studies and smaller sizes for the populations of conservation concern (Palstra and Ruzzante, 2008). Thus, compensatory mutations might be an important class of mutations in many of the surveyed wild populations. Together with previous studies showing that large variation in fitness effects of deleterious mutations can be an important factor in how some small natural populations sustain themselves, the present results clearly show that compensatory mutations can be another key mechanism for the survival of small populations. Given that compensatory mutations do occur in nature, sometimes quite frequently, our results suggest the hypothesis that compensatory mutations are more prevalent in small populations than large populations, and future empirical studies should be designed to test this prediction.
ACKNOWLEDGMENTS
This work was supported in part by NIGMS∕NIH Grant No. 1 R01 GM078989-01, NSF Grant Nos. DMI-0355391 and IIS-0710945, Department of Energy Grant No. DE-FG02-06ER25720, and a VPI& SU ASPIRES grant.
References
- Burch, C L, and Chao, L (1999). “Evolution by small steps and rugged landscapes in the RNA virus phi6.” Genetics 151, 921–927. [DOI] [PMC free article] [PubMed] [Google Scholar]
- Crow, J F, and Kimura, M (1970). An Introduction to Population Genetics Theory, Harper & Row, New York. [Google Scholar]
- Davies, E K, Peters, A D, and Keightley, P D (1999). “High frequency of cryptic deleterious mutations in Caenorhabditis elegans.” Science 285, 1748–1751. [DOI] [PubMed] [Google Scholar]
- Estes, S, Phillips, P C, Denver, D R, Thomas, W K, and Lynch, M (2004). “Mutation accumulation in populations of varying size: the distribution of mutational effects for fitness correlates in Caenorhabditis elegans.” Genetics 166, 1269–1279. [DOI] [PMC free article] [PubMed] [Google Scholar]
- Eyre-Walker, A, Woolfit, M, and Phelps, T (2006). “The distribution of fitness effects of new deleterious amino acid mutations in humans.” Genetics 173, 891–900. [DOI] [PMC free article] [PubMed] [Google Scholar]
- Fares, M A, Ruiz-Gonzalez, M X, Moya, A, Elena, S F, and Barrio, E (2002). “Endosymbiotic bacteria: groEL buffers against deleterious mutations.” Nature (London) 10.1038/417398a 417, 398. [DOI] [PubMed] [Google Scholar]
- Frankham, R (1995). “Effective population size∕adult population size ratios in wildlife: a review.” Genet. Res. 66, 95–106. [DOI] [PubMed] [Google Scholar]
- Keightley, P D (1994). “The distribution of mutation effects on viability in Drosophila melanogaster.” Genetics 138, 1315–1322. [DOI] [PMC free article] [PubMed] [Google Scholar]
- Kelley, S O, Steinberg, S V, and Schimmel, P (2000). “Functional defects of pathogenic human mitochondrial tRNAs related to structural fragility.” Nat. Struct. Biol. 7, 862–865. [DOI] [PubMed] [Google Scholar]
- Kimura, M (1968). “Evolutionary rate at the molecular level.” Nature (London) 10.1038/217624a0 217, 624–626. [DOI] [PubMed] [Google Scholar]
- Lande, R (1998). “Risk of population extinction from fixation of deleterious and reverse mutations.” Genetics 102–103, 21–27. [PubMed] [Google Scholar]
- Lynch, M, Burger, R, Butcher, D, and Gabriel, W (1993). “The mutational meltdown in asexual populations.” J. Hered 84, 339–344. [DOI] [PubMed] [Google Scholar]
- Nielsen, R, and Yang, Z (2003). “Estimating the distribution of selection coefficients from phylogenetic data with applications to mitochondrial and viral DNA.” Mol. Biol. Evol. 20, 1231–1239. [DOI] [PubMed] [Google Scholar]
- Palstra, F P, and Ruzzante, D E (2008). “Genetic estimates of contemporary effective population size: what can they tell us about the importance of genetic stochasticity for wild population persistence?” Mol. Ecol. 17, 3428–3447. [DOI] [PubMed] [Google Scholar]
- Piganeau, G, and Eyre-Walker, A (2003). “Estimating the distribution of fitness effects from DNA sequence data: implications for the molecular clock.” Proc. Natl. Acad. Sci. U.S.A. 10.1073/pnas.1833064100 100, 10335–10340. [DOI] [PMC free article] [PubMed] [Google Scholar]
- Poon, A, and Chao, L (2005). “The rate of compensatory mutation in the DNA bacteriophage phiX174.” Genetics 170, 989–999. [DOI] [PMC free article] [PubMed] [Google Scholar]
- Poon, A, and Otto, S P (2000). “Compensating for our load of mutations: freezing the meltdown of small populations.” Evolution Int. J. Org. Evolution. 54, 1467–1479. [DOI] [PubMed] [Google Scholar]
- Poon, A, and Chao, L (2006). “Functional origins of fitness effect-sizes of compensatory mutations in the DNA bacteriophage phiX174.” Evolution 60, 2032–2043. [PubMed] [Google Scholar]
- Sanjuan, R, Moya, A, and Elena, S F (2004). “The distribution of fitness effects caused by single-nucleotide substitutions in an RNA virus.” Proc. Natl. Acad. Sci. U.S.A. 10.1073/pnas.0400146101 101, 8396–8401. [DOI] [PMC free article] [PubMed] [Google Scholar]
- Vassilieva, L L, Hook, A M, and Lynch, M (2000). “The fitness effects of spontaneous mutations in Caenorhabditis elegans.” Evolution Int. J. Org. Evolution. 54, 1234–1246. [DOI] [PubMed] [Google Scholar]
- Whitlock, M C (2000). “Fixation of new alleles and the extinction of small populations: drift load, beneficial alleles, and sexual selection.” Evolution Int. J. Org. Evolution. 54, 1855–1861. [DOI] [PubMed] [Google Scholar]
- Wilke, C O, Lenski, R E, and Adami, C (2003). “Compensatory mutations cause excess of antagonistic epistasis in RNA secondary structure folding.” BMC Evol. Biol. 3, 3. [DOI] [PMC free article] [PubMed] [Google Scholar]
- Wright, S (1931). “Evolution in Mendelian populations.” Genetics 16, 97–159. [DOI] [PMC free article] [PubMed] [Google Scholar]
- Yampolsky, L Y, Kondrashov, F A, and Kondrashov, A S (2005). “Distribution of the strength of selection against amino acid replacements in human proteins.” Hum. Mol. Genet. 14, 3191–3201. [DOI] [PubMed] [Google Scholar]
- Zhang, L, and Watson, L T (2007). “Note on the computation of critical effective population sizes.” J. Comput. Biol. 14, 950–960. [DOI] [PubMed] [Google Scholar]


