

Abstract
Background and Objectives:
Sound enamel manifests peak transparency in the near-IR (NIR) at 1310-nm, therefore the near-IR is ideally suited for high contrast imaging of dental caries. The purpose of this study was to acquire images of early demineralized enamel on the buccal and occlusal surfaces of extracted human teeth using NIR reflectance imaging and compare the contrast of those images with the contrast of images taken using other methods.
Materials and Methods:
Fifteen human molars were used in this in vitro study. Teeth were painted with a clear acid-resistant varnish, leaving two 2×2 mm windows on the buccal and occlusal surfaces of each tooth for demineralization. Artificial lesions were produced in the exposed windows after a 2-day exposure to a demineralizing solution at pH-4.5. Lesions were imaged using NIR transillumination, NIR and visible light reflectance, and fluorescence imaging methods. Crossed polarizers were used where appropriate to improve contrast. Polarization sensitive optical coherence tomography (PS-OCT) was also used to non-destructively assess the depth and severity of demineralization in each sample window.
Results:
NIR reflectance imaging had the highest image contrast for both the buccal and occlusal groups and it was significantly higher contrast than visible light reflectance (P<0.05).
Conclusion:
The results of the study suggest that NIR reflectance imaging is a promising new method for acquiring high contrast images of early demineralization on tooth surfaces.
Keywords: demineralization, dental caries, enamel, near-IR Imaging, polarization
INTRODUCTION
The caries process is potentially preventable and curable. If carious lesions are detected early enough, it is likely that they can be arrested/reversed by non-surgical means through fluoride therapy, anti-bacterial therapy, dietary changes, or by low intensity laser irradiation[1, 2]. Therefore, one cannot overstate the importance of detecting the decay in the early stage of development at which point non-invasive preventive measures can be taken to halt further decay. New imaging methods that provide improved contrast between sound and demineralized enamel will increase the clinicians ability to detect early caries lesions and assess the efficacy of intervention.
Light scattering in sound dental enamel decreases markedly in the near-infrared (NIR) region and studies have shown that enamel has the highest transparency near 1310nm [3, 4]. At this wavelength, the attenuation coefficient is only 2 to 3 cm−1, which is a factor of 20 to 30 times lower than in the visible region [4]. At longer wavelengths, water absorption increases significantly and reduces the penetration of the NIR light. Even though the light scattering for sound enamel is at a minimum in the NIR, the light scattering coefficient of enamel increases by 2-3 order of magnitudes upon demineralization due to the formation of pores on a similar size scale to the wavelength of the light that act as Mie scatterers [5]. Therefore, caries lesions can be imaged with optimal contrast at 1310 nm [6]. Previous NIR transillumination studies have shown that interproximal caries lesions can be imaged through anterior and posterior teeth [7, 8]. The decay on the important occlusal surfaces can also be imaged employing an alternative NIR transillumination imaging configuration in which NIR light is delivered to the tooth from the buccal or lingual surface to diffuse upward through the dentin to provide uniform back illumination of the enamel of the crown [9]. These seminal studies established the feasibility of acquiring high quality images of natural caries lesions using NIR transillumination. However, those imaging geometries are not well suited for imaging early lesions that are confined to the outer enamel surface. It is the aim of this paper to determine if a reflectance imaging configuration is better suited to acquire high contrast images of artificial demineralization on enamel surfaces. In the reflectance imaging configuration, the imaging system (camera) and the light source are positioned on the same side of the tooth.
Optical imaging methods used for caries detection exploit either directly or indirectly (fluorescence) the increased light scattering in enamel caused by demineralization. Early enamel white spot lesions can be discriminated from sound enamel by visual observation or by visible-light diffuse reflectance imaging [10, 11]. The visibility of scattering structures on highly reflective surfaces such as teeth can be enhanced by use of crossed polarizers to remove the glare from the surface due to the strong specular reflection from the enamel surface [12, 13]. The contrast between sound and demineralized enamel can be further enhanced by depolarization of the scattered light in the area of demineralized enamel [6, 14]. Laser induced fluorescence (LIF) or quantitative light fluorescence (QLF) has been used extensively to quantify the severity of incipient caries lesions [15-22] and aid in early detection. QLF measures the loss of the enamel native fluorescence as the lesion increases in severity [23]. The pores in the lesion formed due to demineralization, scatter and attenuate fluorescence that originates from the underlying sound enamel and dentin. The fluorescence loss (%) has been compared with the mineral loss integrated with depth, ΔZ (Vol.% mineral*μm) to give a measure of the lesion severity.
Optical coherence tomography (OCT) is a noninvasive technique for creating cross-sectional images of internal biological structure [24-26]. It is non-destructive and has great potential for imaging “in vivo”. Polarization-sensitive OCT (PS-OCT) is a form of OCT that is sensitive to changes in the polarization of the reflected light [27]. Polarization sensitive optical coherence tomography (PS-OCT), has been successfully used to acquire images of both artificial and natural caries lesions, assess their severity in depth, assess the remineralization of such lesions, [14, 28, 29] and determine the efficacy of chemical agents in inhibiting demineralization [30]. Previous studies have demonstrated that the integrated reflectivity measured with PS-OCT from the lesion area, ΔR (dB(decibels) × μm), correlates with ΔZ, the integrated mineral loss (volume % mineral × μm) [29-31]. In this study, we employed PS-OCT in place of microradiography to nondestructively assess the severity of the lesions produced and confirm that subsurface demineralization occurred without erosion of the surface.
In this paper, we report the first high contrast reflectance images of early demineralization on buccal and occlusal tooth surfaces measured at λ=1310-nm.
MATERIALS AND METHODS
Sample and Lesion PreparationFifteen human teeth with non-carious buccal and occlusal surfaces were collected (CHR approved) and sterilized with gamma radiation. Tooth surfaces were polished with a 5-μm aluminum oxide to ensure a homogeneous surface for demineralization and teeth were mounted in black orthodontic acrylic blocks. Samples were stored in a moist environment of 0.1% thymol to maintain tissue hydration and prevent bacterial growth. The outlines of two 2×2 mm windows approximately 50-μm deep were cut on both the buccal and occlusal surface of each tooth using a CO2 laser (Impact 2500, GSI Lumonics Rugby, UK). The laser incisions also inhibit decay in the laser area due to thermal modification of the enamel and are therefore very effective in providing a separation between the sound and demineralized areas. The channels cut by the laser also serve as reference points on the PS-OCT scans and are sufficiently narrow that they do not interfere with calculations of the image contrast. The enamel surrounding the 2×2 windows created by the laser was covered with a clear acid-resistant varnish (Clear, Revlon, New York). The clear varnish was selected because it does not interfere with imaging, and does not need to be removed for imaging. A pilot study carried out on five 5×5 mm bovine enamel blocks showed that there was no significant difference in the near-IR and fluorescence image contrast and intensity with the transparent varnish [32]. Artificial lesions were created within the 2×2 windows by immersing each tooth into a 50 ml aliquot of a Ca/PO4/acetate solution containing 2.0 mmol/L calcium, 2.0 mmol/L phosphate, and 0.075 mol/L acetate maintained at pH 4.5 and a temperature of 37°C for 48 hours.
Polarization Sensitive Optical Coherence Tomography (PS-OCT System)
PS-OCT scans were used to acquire tomographic images of the lesions produced in each window. PS-OCT was used in place of microradiography or polarized light microscopy to provide an indication of the lesion depth and severity and verify the lesion is intact. Although it is also a nondestructive imaging technique, it was not one of the four imaging methods compared in this study. PS-OCT is capable of determining the lesion depth and severity nondestructively without thin sectioning and destruction of the tooth. Previous studies have demonstrated that the integrated reflectivity measured with PS-OCT from the lesion area, ΔR (dB(decibels) × µm), correlates with ΔZ, the integrated mineral loss (volume % mineral●μm) [29-31]. The autocorrelator-based Optical Coherence Domain Reflectometry system (OCDR; Optiphase, Inc., Van Nuys, CA) that was used for PS-OCT imaging has been described in previous studies [33, 34]. This system used a polarization switching probe, high efficiency piezoelectric fiber-stretchers and an InGaAs receiver. The OCDR was integrated with a broadband high power superluminescent diode (SLD) (Denselight, Jessup, MD) with an output power of 45 mW and a bandwidth of 35-nm and a high-speed XY-scanning system (ESP 300 controller & 850HS stages, National Instruments, Austin, TX) for in vitro optical tomography. The probe was designed to provide a spot diameter of 50 μm over a range of 10 mm. PS-OCT images or b-scans were taken across each tooth passing through each of the lesion windows. Line profiles extracted from sound and lesion areas of the images taken of the orthogonal polarization (⊥-axis) to the original incident polarized light were integrated from the enamel surface to a depth of 200-μm, to yield the integrated reflectivity, ΔR, of those regions in units of (dB●μm).
Fluorescence Loss Measurements
Figure 1 shows the respective imaging configurations for the four imaging modalities compared in this study, namely visible-light reflectance, NIR-light reflectance, NIR transillumination and fluorescence. To collect fluorescence images, enamel surfaces were irradiated with a frequency doubled, diode pumped solid state Nd:YVO4 laser (λ=473-nm) DPSS Laser Model BLM-50 (Extreme lasers, Houston Texas) with an incident intensity of up to 50-mW. A 500-nm long-pass filter #C47-616 (Edmund Scientific, Barrington, NJ) and a DFK 31AF03 FireWire camera (resolution 1024 × 768) from the Imaging Source (Charlotte, NC) were used to image the fluorescence from the surface at wavelengths longer than 500-nm. Imaging was carried out in the dark to avoid the interference of ambient light. QLF systems have been employed using several excitation wavelengths ranging from 370-488-nm. The fluorescence emission spectra and quantum yields are expected to be independent of excitation wavelength, according to Kasha's law as long as there is sufficient energy to populate the excited state [35]. This was confirmed in a study by Endo et al.[36], they measured demineralization using two QLF systems operating at 488-nm and 370-nm and reported similar performance. QLF-fluorescence loss measurements are typically reported as a ratio in intensity (fluorescence radiance) of the lesion area compared with an equivalent sound area on the tooth. We used the more traditional approach of reporting the linear image contrast [37] which is less susceptible to errors caused by major variations in the tooth topography between the sound or reference area and the lesion area or window. Line-profiles across the sound and demineralized areas were used to calculate the ratio of intensity between the sound and demineralized regions. However, either method should yield similar results.
Fig. 1.
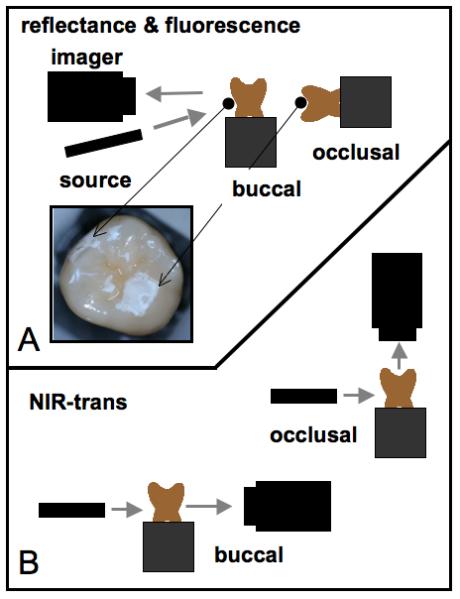
Imaging configurations used in this study. (top) Orientation of the imaging cameras, light sources and tooth samples for visible and NIR reflectance measurements along with laser induced fluorescence. (bottom) Position of the InGaAs imaging camera, light source and tooth samples for the two NIR transillumination measurement systems used for imaging the buccal and occlusal surfaces.
Transillumination - NIR
NIR transilumination of the buccal lesions was carried out using the imaging configuration described in reference [8] with crossed polarizers (Fig. 1B). A 1310-nm superluminescent diode (SLD) with an output power of 15-mW and a 30-nm bandwidth, Model SLED1300D20A (Optospeed, Zurich, Switzerland), was connected to a 20-mm NIR fibercollimator (Micro Laser Systems, Garden, Grove, CA). Crossed NIR polarizers, Model K46-252 (Edmund Scientific, Barrington, NJ), were used to remove light that directly illuminated the array without passing through the tooth. An InGaAs focal plane array (318×252 pixels), the Alpha NIR (Indigo Systems, Goleta, Ca) with an Infinimite lens (Infinity, Boulder, Co), was used to acquire all the images. The acquired 12 bit digital images were analyzed using IR Vista software (Indigo systems, Goleta, CA).
For occlusal images, the 20-mm collimated beam from the same SLD light source used above was focused by a 150-mm focal length cylindrical lens at a point just above the dentinal-enamel junction [9]. This configuration was found to reflect a fairly uniform intensity level across the occlusal plane. The NIR light enters the teeth just above the DEJ and is scattered by the dentin. The scattered light in the dentin migrates towards the surface of the crown, into the occlusal surface of the tooth. No polarizers were used since there is not direct illumination.
Visible and NIR Cross Polarization Images
In order to acquire reflected light images, visible or NIR, light was shined directly at the buccal or occlusal surface of the tooth and reflected light coming out of the tooth surface was imaged (Fig. 1A). Crossed polarizers were placed after the light source and before the detector. For occlusal images, the tooth was turned on its side so the light was incident on the occlusal surface. In this method, the demineralized region appears lighter than the sound enamel because the demineralized region scatters the light increasing the amount of light scattered/reflected back towards the camera. In order to acquire visible light images a tungsten halogen light source was used with a color firewire CCD camera with a resolution of 450 lines, (Model DFK 5002/N, Imaging Source, Charlotte, NC), equipped with the same Infinimite lens used for NIR imaging. The NIR reflectance images were acquired using the same InGaAs FPA, NIR light source and polarizers used for the NIR transillumination measurements, however they were placed in a different orientation for reflectance measurements, i.e. positioned to view or illuminate the same surface of the tooth.
Image Analysis
Line profiles were extracted from each image aligned with the fiducial marks cut midway across each 2 × 2 mm window and lesion or image contrast was calculated using (IS-IL)/IS; where IS is the mean intensity of the sound enamel outside the window area, and IL is the mean intensity of the lesion inside the window for fluorescence and transillumination measurement. (IL-IS)/IL was used for the reflectance measurements that have the reverse contrast, i.e., the intensity in lesion areas is higher than for the sound enamel. The image contrast varies from 0-1 with 1 being very high contrast and 0 no contrast. All image analysis was carried out using Igor pro software (Wavemetrics, Lake Oswego, OR). A one-way analysis of variance (ANOVA) followed by the Tukey-Kramer post-hoc multiple comparison test was used to compare groups for each type of lesion employing Instat software (GraphPad, San Diego, CA).
RESULTS
Examples of buccal and occlusal lesions viewed using the four imaging modalities are shown in Figs. 2&3. In reflectance, the lesions appear lighter than the surrounding sound enamel and in transillumination and fluorescence the lesions appear darker. Lesions manifest the highest contrast in the NIR-reflectance and fluorescence images for both tooth surfaces. The reflectivity from the sound tooth areas in the NIR infrared reflectance images are extremely low due to the weak scattering and depolarization by the sound enamel. Staining and discoloration are visible in the occlusal surface in the visible-light reflectance image of Fig. 3a. Staining and discoloration can interfere with reflectance imaging in the visible region, however the chromophores responsible for stains in the visible region, do not absorb NIR light and therefore do not interfere at NIR wavelengths.
Fig. 2.
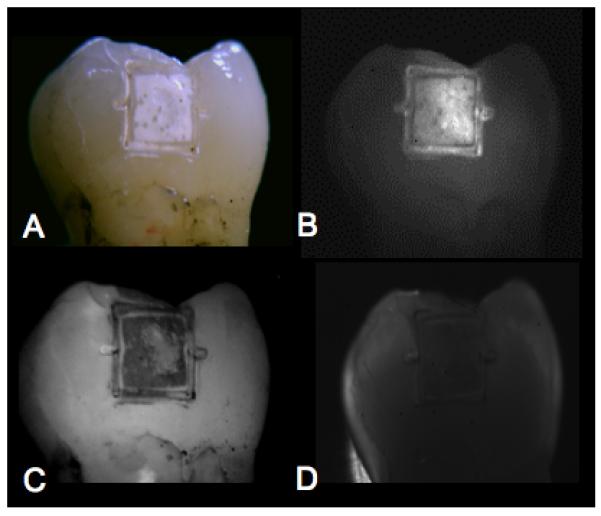
Buccal lesion images are shown for for one sample. (A) visible reflectance w/crossed polarizers, (B) NIR reflectance w/crossed polarizers, (C) fluorescence, and (D) NIR transillumination w/crossed polarizers. Note the position of the fiducial marks cut by the laser at the midway point of each 2×2 mm window. These marks demarcate the position of the line profiles used for calculating the image contrast on each sample.
Fig. 3.
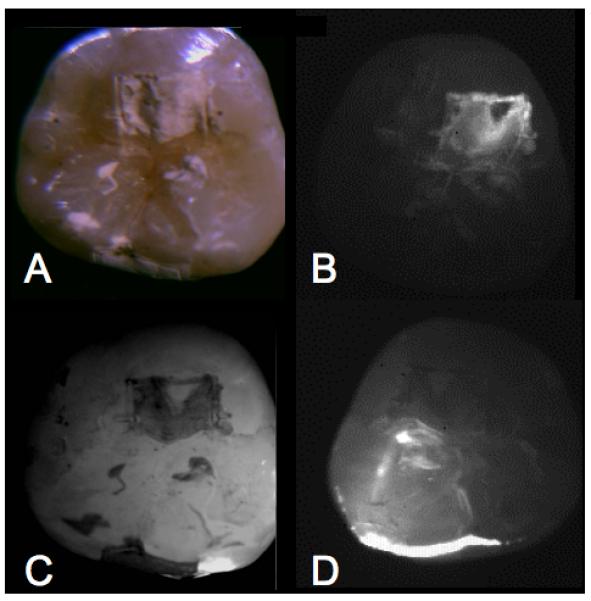
Occlusal lesion images are shown for one sample. (A) visible reflectance w/crossed polarizers, (B) NIR reflectance w/crossed polarizers, (C) fluorescence, and (D) NIR transillumination.
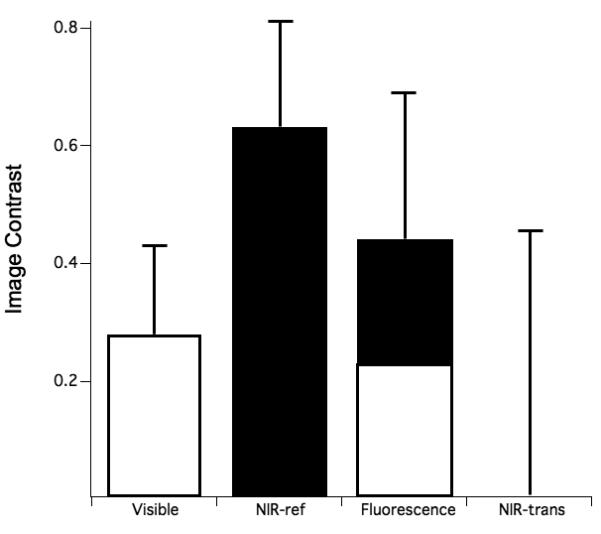
The mean±s.d of the image contrast for the buccal and occlusal lesions are shown graphically in Figs. 4 & 5, respectively. The specific values of the image contrast for the buccal lesions were: visible reflectance w/crossed polarizers (0.235±0.116), NIR reflectance w/crossed polarizers (0.627±0.175 ), NIR transillumination w/crossed polarizers (0.182±0.183), and fluorescence (0.441±0.255). NIR reflectance had the highest mean image contrast value, while NIR transillumination had the lowest contrast. A similar trend was observed for the occlusal lesions: visible reflectance w/crossed polarizers (0.284±0.146), NIR reflectance w/crossed polarizers (0.633±0.176), NIR Transillumination (0.00561±0.449), and fluorescence (0.440± 0.264).
Fig. 4.
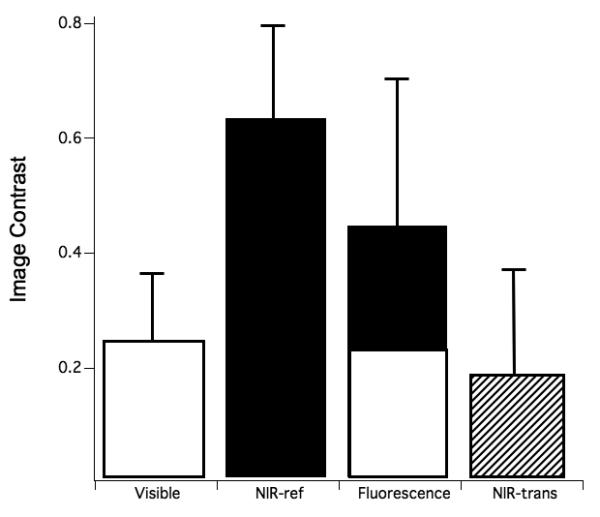
The mean±s.d contrast values of the buccal surfaces for the various imaging methods. Bars containing the same color are not significantly different (p>0.05).
Fig. 5.
The mean±s.d contrast values of the occlusal surfaces for the various imaging methods. Bars containing the same color are not significantly different (p>0.05).
PS-OCT measurements were carried out to confirm that lesions were indeed present in the 2×2 windows. The mean integrated reflectivity in units of ΔR (dB × μm) was 1622±482 for lesion areas and 179±78 for sound areas on the occlusal surface and 1896±655 for lesion areas and 196±141 for sound areas on the buccal surface. Based on previous comparisons of ΔR vs. ΔZ, using the same PS-OCT system and light-source and similar “softened-surface” lesion model, the mean ΔR values translate to integrated mineral loss (ΔZ) values of approximately 2000-4000 (vol% × μm) and lesions depths ∼ 100-150μm[38].
DISCUSSION
NIR reflectance measurements yielded the highest contrast of the four imaging modalities investigated and it was the only method that broke statistically from the visible reflectance measurements with polarized light. NIR transillumination was not effective in resolving the superficial lesions produced in this study. The NIR light must pass through the highly scattering dentin or take an indirect path through the highly transparent enamel in order to reach the lesion areas. In the latter case the light may strike the lesion at large angles causing an increase in the emitted light as opposed to a decrease. This would be highly dependent on the topography of the tooth in the lesion area. This study does suggest however that multimodal imaging involving both NIR reflected and transmitted light may be effective in gauging the depth and severity of natural lesions in occlusal surfaces. For example, if a lesion is visible only in reflected NIR light it is likely superficial while if it is visible in transmitted light as well it is likely a deep severe lesion. Multimodal imaging studies are underway in our laboratory to test this hypothesis. We have already observed this to some degree in a prior study involving imaging hypomineralization and dental caries on occlusal surfaces. The superficial hypomineralization does not appear darker on NIR transillumination images while the more severe caries lesions do [39].
Although image contrast was higher for fluorescence vs. the visible reflectance measurements they did not break statistically. It may be that the use of crossed polarizers in this study may have considerably increased the contrast of the visible-light reflectance measurements by removing glare and exploiting depolarization of the scattered light. There have been comparative studies of QLF vs. microradiography, polarized light microscopy and OCT [20, 40, 41] (histological studies) for early lesions. Unfortunately, we do not know of any studies comparing the image contrast of visible light reflectance images with QLF. Linear image contrast was compared in this study, while in most QLF studies the fluorescence radiance from a specified area is reported as the relative fluorescence radiance loss from a particular area. However, the results should be similar since one is comparing a linear array of values (line-profile) for image contrast and a 2D matrix of values (area) for the fluorescence radiance calculation. It is important to point out that the image contrast is expected to vary with the severity of demineralization for each imaging technology, i.e., shallower and less severe lesions may manifest less contrast and deeper lesions greater contrast. Therefore QLF may yield higher image contrast versus the respective reflectance methods for less severe lesions while it is anticipated that the performance of NIR transillumination would improve for deeper lesions. More extensive studies over a greater range of lesion severity are required to determine the optimum performance ranges for each of these imaging methods.
This study clearly demonstrates that a NIR imaging system has considerable potential for the imaging of early surface demineralization with high contrast on both occlusal and buccal surfaces. The high contrast between sound enamel and early enamel demineralization suggests that reflective NIR imaging can be effective for routine monitoring white spot lesions during chemical intervention. Since NIR wavelengths are safe the dentist can acquire multiple NIR images of the lesions during subsequent visits to determine if fluoride therapy is effective in arresting the lesion or whether the lesion has expanded, requiring more aggressive intervention. Such an approach is not practical with radiographic methods due to repeated x-ray exposure. In addition to the high contrast in this study, another potential advantage NIR imaging has over visible imaging methods and fluorescence based methods is the lack of interference from stains and discoloration, since stains are not visible in the NIR.
ACKNOWLEDGEMENTS
Supported by NIH/NIDR R01-DE14698 and R01-DE17869. The authors would like to thank Chi Ho, Ken Fan and Cynthia L. Darling for their help with these studies
REFERENCES
- 1.NIH: Diagnosis and Management of Dental Caries throughout Life 1-24 (NIH Consensus Statement, 2001).
- 2.Featherstone JDB. Prevention and reversal of dental caries:role of low level fluoride. Community Dent Oral Epidemiol. 1999;27:31–40. doi: 10.1111/j.1600-0528.1999.tb01989.x. [DOI] [PubMed] [Google Scholar]
- 3.Fried D, Featherstone JDB, Glena RE, Seka W. The nature of light scattering in dental enamel and dentin at visible and near-IR wavelengths. Appl. Optics. 1995;34:1278–1285. doi: 10.1364/AO.34.001278. [DOI] [PubMed] [Google Scholar]
- 4.Jones RS, Fried D. Attenuation of 1310-nm and 1550-nm Laser Light through Sound Dental Enamel, Lasers in Dentistry VIII. Vol. 4610. SPIE; San Jose: 2002. pp. 187–190. [Google Scholar]
- 5.Darling CL, Huynh GD, Fried D. Light Scattering Properties of Natural and Artificially Demineralized Dental Enamel at 1310-nm. J. Biomed. Optics. 2006;11(034023):1–11. doi: 10.1117/1.2204603. [DOI] [PubMed] [Google Scholar]
- 6.Fried D, Featherstone JDB, Darling CL, Jones RS, Ngaotheppitak P, Buehler CM. Early Caries Imaging and Monitoring with Near-IR Light. W. B Saunders Company; Philadelphia: 2005. pp. 771–794. [DOI] [PubMed] [Google Scholar]
- 7.Jones G, Jones RS, Fried D. Transillumination of interproximal caries lesions with 830-nm light, Lasers in Dentistry X. Vol. 5313. SPIE; San Jose: 2004. pp. 17–22. [Google Scholar]
- 8.Jones RS, Huynh GD, Jones GC, Fried D. Near-IR Transillumination at 1310-nm for the Imaging of Early Dental Caries. Optics Express. 2003;11:2259–2265. doi: 10.1364/oe.11.002259. [DOI] [PubMed] [Google Scholar]
- 9.Bühler CM, Ngaotheppitak P, Fried D. Imaging of occlusal dental caries (decay) with near-IR light at 1310-nm. Optics Express. 2005;13:573–582. doi: 10.1364/opex.13.000573. [DOI] [PubMed] [Google Scholar]
- 10.Angmar-Mansson B, ten Bosch JJ. Optical methods for the detection and quantification of caries. Adv. Dent. Res. 1987;1:14–20. doi: 10.1177/08959374870010010601. [DOI] [PubMed] [Google Scholar]
- 11.ten Bosch JJ, van der Mei HC, Borsboom PCF. Optical monitor of in vitro caries. Caries Res. 1984;18:540–547. doi: 10.1159/000260818. [DOI] [PubMed] [Google Scholar]
- 12.Benson PE, Ali Shah A, Robert Willmot D. Polarized versus nonpolarized digital images for the measurement of demineralization surrounding orthodontic brackets. Angle Orthod. 2008;78:288–93. doi: 10.2319/121306-511.1. [DOI] [PubMed] [Google Scholar]
- 13.Everett MJ, Colston BW, Sathyam US, Silva LBD, Fried D, Featherstone JDB. Non-invasive diagnosis of early caries with polarization sensitive optical coherence tomography (PS-OCT), Lasers in Dentistry V. Vol. 3593. SPIE; San Jose: 1999. pp. 177–183. [Google Scholar]
- 14.Fried D, Xie J, Shafi S, Featherstone JDB, Breunig T, Lee CQ. Early detection of dental caries and lesion progression with polarization sensitive optical coherence tomography. J. Biomed. Optics. 2002;7:618–627. doi: 10.1117/1.1509752. [DOI] [PubMed] [Google Scholar]
- 15.Ando M, Hall AF, Eckert GJ, Schemehorn BR, Analoui M, Stookey GK. Relative ability of laser fluorescence techniques to quantitate early mineral loss in vitro. Caries Res. 1997;31:125–31. doi: 10.1159/000262387. [DOI] [PubMed] [Google Scholar]
- 16.Hafstroem-Bjoerkman U, de Josselin de Jong E, Oliveby A, Angmar-Mansson B. Comparison of laser fluorescence and longitudinal microradiography for quantitative assessment of in vitro enamel caries. Caries. Res. 1992;26:241–247. doi: 10.1159/000261446. [DOI] [PubMed] [Google Scholar]
- 17.Angmar-Masson BA, Al-Khateeb S, Tranaeus S. Intraoral use of quantitative light-induced fluorescence detection method, Early Detection of dental caries. 39-50. Indiana University; Indianapolis: 1996. [Google Scholar]
- 18.Lagerweij MD, van der Veen MH, Ando M, Lukantsova L. The validity and repeatability of three light-induced fluorescence systems: An in vitro study. Caries Res. 1999;33:220–226. doi: 10.1159/000016520. [DOI] [PubMed] [Google Scholar]
- 19.Eggertsson H, Analoui M, Veen M.H.v.d., Gonzalez-Cabezas C, Eckert GJ, Stookey GK. Detection of early interproximal caries in vitro using laser fluorescence, dye-enhanced laser fluorescence and direct visual examination. Caries Res. 1999;33:227–233. doi: 10.1159/000016521. [DOI] [PubMed] [Google Scholar]
- 20.de Josselin de Jong E, Sundstrom F, Westerling H, Tranaeus S, ten Bosch JJ, Angmar-Mansson B. A New Method for in vivo Quantification of Changes in Initial Enamel Caries with laser Fluorescence. Caries Res. 1995;29:2–7. doi: 10.1159/000262032. [DOI] [PubMed] [Google Scholar]
- 21.van der Veen MH, de Josselin de Jong E, Al-Kateeb S. Caries Activity Detection by Dehydration with Qualitative Light Fluorescence, Early detection of Dental caries II. Vol. 4. Indiana University; Indianapolis, IN: 1999. pp. 251–260. [Google Scholar]
- 22.Stookey GK. Quantitative Light Fluorescence: A Technology for Early Monitoring of the Caries Process. W. B Saunders Company; Philadelphia: 2005. pp. 753–770. [DOI] [PubMed] [Google Scholar]
- 23.ten Bosch JJ. Summary of Research of Quanitative Light Fluorescence, Early detection of Dental caries II. Vol. 4. Indiana University; Indianapolis, IN: 1999. pp. 261–278. [Google Scholar]
- 24.Huang D, Swanson EA, Lin CP, Schuman JS, Stinson WG, Chang W, Hee MR, Flotte T, Gregory K, Puliafito CA, Fujimoto JG. Optical Coherence Tomography. Science. 1991;254:1178–1181. doi: 10.1126/science.1957169. [DOI] [PMC free article] [PubMed] [Google Scholar]
- 25.Bouma BE, Tearney GJ. Handbook of Optical Coherence Tomography. Marcel Dekker; New York: 2002. [Google Scholar]
- 26.Brezinski M. Optical Coherence Tomography: Principles and Applications. Elsevier; London: 2006. [Google Scholar]
- 27.Hee MR, Huang D, Swanson EA, Fujimoto JG. Polarization-sensitive low-coherence reflectometer for birefringence characterization and imaging. J. Opt. Soc. Am. B. 1992;9:903–908. [Google Scholar]
- 28.Jones RS, Fried D. Quantifying the remineralization of artificial caries lesions using PSOCT. Vol. 6137. SPIE; 2006. pp. 613701–8. [Google Scholar]
- 29.Jones RS, Fried D. Remineralization of Enamel Caries Can Decrease Optical Reflectivity. J Dent Res. 2006;85:804–808. doi: 10.1177/154405910608500905. [DOI] [PMC free article] [PubMed] [Google Scholar]
- 30.Chong SL, Darling CL, Fried D. Nondestructive measurement of the inhibition of demineralization on smooth surfaces using polarization-sensitive optical coherence tomography. Lasers Surg Med. 2007;39:422–7. doi: 10.1002/lsm.20506. [DOI] [PubMed] [Google Scholar]
- 31.Jones RS, Darling CL, Featherstone JDB, Fried D. Imaging artificial caries on occlusal surfaces with polarization sensitive optical coherence tomography. Caries Res. 2004;40:81–89. doi: 10.1159/000091052. [DOI] [PubMed] [Google Scholar]
- 32.Wu JI. Nondestructive Assessment of White Spot Lesions Using Near-Infrared Imaging. University of California; San Francisco, San Francisco: 2008. [Google Scholar]
- 33.Ngaotheppitak P, Darling CL, Fried D, Bush J, Bell S. PS-OCT of occlusal and interproximal caries lesions viewed from occlusal surfaces, Lasers in Dentistry X. Vol. 6137. SPIE; 2006. p. 61370L. [Google Scholar]
- 34.Bush J, Davis P, Marcus MA. All-Fiber Optic Coherence Domain Interferometric Techniques, Fiber Optic Sensor Technology II. Vol. 4204. SPIE; 2000. pp. 71–80. [Google Scholar]
- 35.Lakowicz JR. Principles of Fluorecence Spectroscopy. Kluwer Academic New York; 1999. [Google Scholar]
- 36.Ando M, Analoui M, Schemehorn BR, Stookey GK. Comparison of light-induced and laser-induced fluorescence methods for the detection and quantification of enamel demineralization, Lasers in Dentistry V. Vol. 3593. SPIE; San Jose, CA, USA: 1999. pp. 148–153. [Google Scholar]
- 37.Dowsett DJ, Kenny PA, Johnston RE. The Physics of Diagnostic Imaging. Chapman & Hall Medical; NY: 1998. [Google Scholar]
- 38.Hsu DJ, Lachica M, Darling CL, Fried D. Nondestructive Assessment of the Inhibition of Enamel Demineralization by CO2 Laser Treatment using Polarization Sensitive Optical Coherence Tomography. J Biomed Opt. 2008 doi: 10.1117/1.2976113. in press. [DOI] [PubMed] [Google Scholar]
- 39.Hirasuna K, Darling CL, Fried D. Near-IR imaging of developmental defects in dental enamel. J. Biomed. Opt. 2008;8:64250S.1–64250S.9. doi: 10.1117/1.2956374. [DOI] [PubMed] [Google Scholar]
- 40.Hafström-Björkman U, Sundström F, Jong E.d.J.d., Oliveby A, Angmar-Månsson B. Comparison of laser fluorescence and longitudinal microradiography for quantitative assessment of in vitro enamel caries. Caries Res. 1992;26:241–247. doi: 10.1159/000261446. [DOI] [PubMed] [Google Scholar]
- 41.Amaechi BT, Podoleanu A, Higham SM, Jackson DA. Correlation of quantitative light-induced fluorescence and optical coherence tomography applied for detection and quantification of early dental caries. J Biomed Opt. 2003;8:642–7. doi: 10.1117/1.1606685. [DOI] [PubMed] [Google Scholar]