Abstract
Fabry disease is an X-linked metabolic disorder caused by a deficiency of α-galactosidase A (α-Gal A). The enzyme defect leads to the systemic accumulation of glycosphingolipids with α-galactosyl moieties consisting predominantly of globotriaosylceramide (Gb3). In patients with this disorder, glycolipid deposition in endothelial cells leads to renal failure and cardiac and cerebrovascular disease. Recently, we generated α-Gal A gene knockout mouse lines and described the phenotype of 10-week-old mice. In the present study, we characterize the progression of the disease with aging and explore the effects of bone marrow transplantation (BMT) on the phenotype. Histopathological analysis of α-Gal A −/0 mice revealed subclinical lesions in the Kupffer cells in the liver and macrophages in the skin with no gross lesions in the endothelial cells. Gb3 accumulation and pathological lesions in the affected organs increased with age. Treatment with BMT from the wild-type mice resulted in the clearance of accumulated Gb3 in the liver, spleen, and heart with concomitant elevation of α-Gal A activity. These findings suggest that BMT may have a potential role in the management of patients with Fabry disease.
Fabry disease is an X-linked inherited metabolic disorder of glycolipid catabolism resulting from deficient activity of the lysosomal enzyme, α-galactosidase A (α-Gal A; EC 3.2.1.22) (1). Neutral glycosphingolipids with terminal α-linked galactosyl moieties, predominantly globotriaosylceramide [(Gb3): Galα1–4Galβ1–4Glcβ1–1Cer, also known as ceramide trihexoside] and, to a lesser extent, galabiosylceramide (Galα1–4Galβ1–1Cer), accumulate in the liver, heart, spleen, kidney, vascular endothelial cells, and plasma of patients with Fabry disease. Major disease manifestations include acroparesthesia, angiokeratoma, and occlusive vascular disease of the heart, kidney, and brain, leading to premature mortality (for review, see ref. 2). There is no specific therapy for Fabry disease. Renal transplantation has been performed in Fabry patients with varying outcome (2). Enzyme replacement (3) and somatic gene therapy (4, 5) have been considered potential therapies for lysosomal storage diseases. Until recently, a suitable animal model for Fabry disease has not been available.
Recently, we reported the generation and initial characterization of α-Gal A gene knockout mice (α-Gal A −/0) that lack α-Gal A activity (6). At 10 wk of age, these mice appeared clinically normal. However, ultrastructural analysis revealed the presence of lipid inclusions in the liver and kidneys typical of those seen in patients with Fabry disease. Lipid analyses revealed a marked accumulation of Gb3 in the liver and kidneys. These findings indicate the similarity of the underlying pathophysiological process in the mutant mice and in patients with Fabry disease as well as their value as a model to assess approaches to treat patients with Fabry disease.
We report here the phenotypic analysis of aging α-Gal A −/0 mice. Grossly, α-Gal A −/0 mice still remained clinically normal at 80 wk of age and showed no evidence of organ failure. Analysis of glycolipids in mouse RBCs revealed that this relatively mild phenotype in α-Gal A-deficient mice compared with patients with Fabry disease may be a result of a greatly diminished concentration of Gb3 in mouse RBCs. Nevertheless, extensive Gb3 accumulation is associated with morphological changes in several tissues of older mice. To test the potential of bone marrow transplantation (BMT) for this disease, we performed BMT in irradiated α-Gal A −/0 mice using wild-type mice as donors. Six months after BMT, Gb3 levels in the liver, spleen, and heart were significantly cleared with concomitant elevation of α-Gal A activity.
MATERIALS AND METHODS
α-Gal A-Deficient Mice.
The α-Gal A-deficient mouse line was maintained in the C57BL/6 × 129/SvJ hybrid background. Genotyping of the offspring for α-Gal A mutation was carried out by Southern blot analysis as described (6). All mice were housed in an American Association for the Accreditation of Laboratory Animal Care-accredited mouse facility and were fed autoclaved diet and water. The present study was carried out with male α-Gal A −/0 and α-Gal A +/0 littermate controls. For the analysis of Gb3 levels in RBC, C57BL/6 mice were used. Mice were bled by retrorbital puncture, and mouse serologic testing was carried out by using standard clinical laboratory techniques. Statistical tests included Student’s t test and analysis of variance; data are presented as mean ± SD.
α-Gal A Assay.
Tissues from each genotype were homogenized with nine volumes of assay buffer (28 mM citric acid/44 mM dibasic sodium phosphate, pH 4.4) containing 0.5% sodium taurocholate and centrifuged at 14,000 rpm (15,000 × g) for 30 min. The supernatant solutions were assayed for α-Gal A activity by incubation with 5 mM 4-methylumbelliferyl α-d-galactopyranoside in the presence of 100 mM N-acetylgalactosamine, a specific inhibitor of α-N-acetylgalactosaminidase (α-galactosidase B) activity (7). β-Hexosaminidase activity was determined (8) as a homogenization control. Protein concentrations were determined by the method of Lowry et al. (9).
Analysis of Glycolipids.
Quantitative analysis of Gb3 was accomplished by normal-phase HPLC by using a Sedex 55 evaporative light scattering detector (ELSD). Briefly, lipids were extracted and saponified, and a glycolipid fraction was obtained essentially as previously described (10). The glycolipid fraction was dissolved in a minimum volume of chloroform:methanol (2:1) and chromatographed on a Luna 3 Silica column (150 × 4.6 mm) from Phenomenex, Belmont, CA. Glycolipids were eluted with a solvent containing chloroform:methanol:water:NH4OH (66:30:3.5:0.5) at a flow rate of 1 ml per minute. The evaporator on the ELSD was set at a temperature of 40°C, nitrogen pressure was 2.4 bar and the gain at 10. Standard Gb3 was obtained from Matreya, Pleasant Gap, PA.
Lipid inclusion bodies in the kidneys were analyzed by staining of cryosections with oil red O. The intensity and extent of glomerular and tubular deposits were visually scored.
For comparison of the neutral glycolipids of mouse and human RBCs, human blood samples were collected from two healthy volunteers and mouse blood was collected from 10-wk-old C57BL/6 mice. Packed RBCs were extracted and partially purified to obtain a neutral glycolipid fraction as described (10). The lipids obtained were separated by TLC in a solvent of chloroform:methanol:water (65:25:4), sprayed with α-naphthol spray reagent (11) and heated to visualize lipids.
Electron Microscopic Analysis.
Tissues were immersion fixed in 4% glutaraldehyde or 2% glutaraldehyde/2% formaldehyde in 0.1 M sodium cacodylate buffer at pH 7.4 for 3 hr and washed. The tissue blocks (≈1 mm3) were then fixed in 0.2–1% OsO4 in 0.1 M cacodylate buffer for 1 hr, washed, and postfixed with 0.5% uranyl acetate in 50% ethanol or 0.5% uranyl acetate in acetate buffer at pH 5.0 for 1 hr, serially dehydrated in ethanol and propylene oxide, and embedded in epoxy resin. Thin sections were counterstained with uranyl acetate and lead citrate.
BMT Experiments.
Male recipient α-Gal A −/O mice (first experiment n = 5, second experiment n = 4) at 15 to 16 wk of age were lethally irradiated (1,000 rad of γ radiation). Bone marrow (BM) cells from littermate α-Gal A +/0 mice (first experiment n = 3, second experiment n = 2) were harvested by flushing the femora and tibiae with DMEM and 10% FBS and were washed once with PBS as described (12). BM cells [2.5 × 10⁷ (first experiment) or 1.2 × 10⁷ (second experiment)] were resuspended in 0.4 ml PBS and injected into recipients through the tail vein. Recipients were sacrificed 6 mo after BMT. Age-matched α-Gal A −/0 (n = 7) and α-Gal A +/0 (n = 8) were also sacrificed and analyzed in the same manner.
To monitor engraftment of donor BM cells, PCR was performed to genotype BM cells from the recipients. The following primers were used for the wild-type allele of α-Gal A gene: P1, 5′-TTCCTAGTGGGATCAAACACCTCG-3′, and P2, 5′-GTCAGCAAATGTCTGCGCATCAATG-3′. The following primers were used for neomycin-resistant gene to detect the mutant allele of α-Gal A gene: P3, 5′-ATGATTGAACAAGATGGATTGCACG-3′, and P4, 5′-TCAGAAGAACTCGTCAAGAAGGCGA-3′. The PCR assay was performed by using the Taq polymerase (Perkin–Elmer/Cetus) with the assay conditions recommended by the manufacturer.
RESULTS
Phenotypic Analysis of α-Gal A −/0 Aging Mice.
As we reported earlier, α-Gal A −/0 mice at 10 wk of age are clinically normal (6). We extended and expanded our observations for possible phenotypic manifestations including ophthalmological examination, and we also performed blood and urine analysis to detect possible organ dysfunction. We did not find any difference in clinical signs including life span between α-Gal A −/0 and α-Gal A +/0 mice (data not shown). Blood and urine analyses performed at 40 and 80 wk of age in these mice did not reveal any significant deviation in the levels of albumin, blood urea nitrogen, creatinine, total cholesterol, alanine aminotransferase, aspartate aminotransferase, alkaline phosphatase, and urine total protein and creatinine (data not shown).
Progressive Accumulation of Gb3 in α-Gal A −/0 Mice.
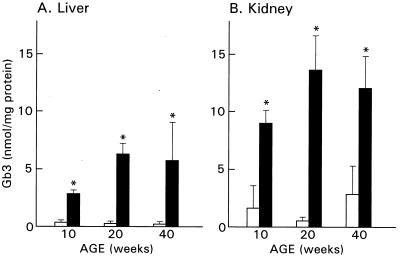
Initial biochemical characterization of α-Gal A −/0 mice demonstrated significant accumulation of Gb3 in the liver and kidney at 10 wk of age. In the present study, we examined Gb3 accumulation in these organs in 20- and 40-week old α-Gal A +/0 and α-Gal A −/0 mice. In wild type (C57BL/6 × 129/SvJ background), Gb3 concentrations remained stable and were relatively low (0.1 to 0.3 nmol/mg protein) in the liver at 20 and 40 wk of age (Fig. 1). In contrast, liver from α-Gal A −/0 mice showed progressive accumulation of Gb3 up to about 20 wk and then remained stable at approximately 6 nmol/mg protein. Kidneys of wild-type mice (α-Gal A +/0) contained higher baseline levels of Gb3, ranging from 1 to 3 nmol/mg protein during the course of observation. Again the kidneys of α-Gal A −/0 mice showed significant elevation from the wild type, and there was an indication of progressive accumulation from 10 wk (9 nmol/mg) to 20 wk (14 nmol/mg). No further increase in storage of Gb3 was observed in kidneys of animals sacrificed at 40 wk of age.
Figure 1.
Gb3 levels in the liver and kidney from 10-, 20-, and 40-wk-old α-Gal A +/0 (open bars) and α-Gal A −/0 (solid bars) mice. Gb3 levels in the liver and kidney from α-Gal A −/0 mice were significantly higher than those from α-Gal A +/0 mice (∗, P < 0.01). Gb3 levels in each group are presented as the mean ± SD.
Histopathological Phenotype of α-Gal A −/0 Mice with Aging.
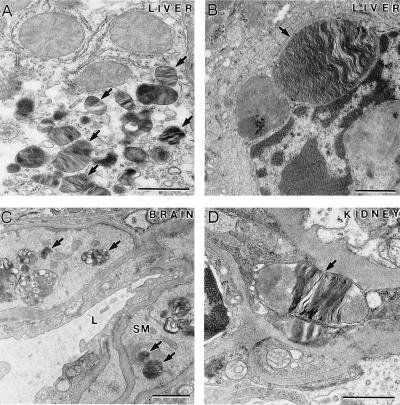
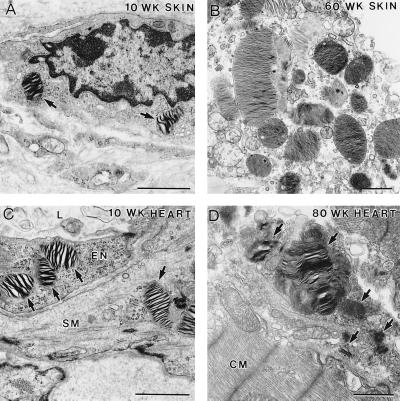
We previously reported initial pathological analysis of α-Gal A −/0 mice at 10 wk of age that included lamellar inclusions in the lysosomes of distal renal tubules in the kidneys (6). To identify the cell types in the affected tissues in α-Gal A −/0 mice, electron microscopy (EM) analysis was performed in α-Gal A −/0 and α-Gal A +/0 mice at different ages. No apparent pathological lesions were found in the liver of α-Gal A −/0 mice at 10 wk of age. However, typical lamellar inclusions in the lysosomes were frequently observed in the Kupffer cells and to a lesser degree in the hepatocytes but not in vascular endothelial cells in the liver of α-Gal A −/0 mice at 40 to 80 wk of age (Fig. 2 A and B). In the brain, inclusions in the lysosomes were identified in smooth muscle cells surrounding blood vessels but not in neuronal or glial cells (Fig. 2C). EM analysis showed that wild-type mice had occasional lamellar bodies within tubular epithelial cells and lacked lamellar bodies in other cell types. α-Gal A/0 mice had increased numbers of lamellar bodies within proximal and distal tubular cells and to a lesser extent within parietal and visceral glomerular epithelial cells and peritubular capillary endothelial cells (Fig. 2D). In the skin, the majority of inclusions were found in macrophage-like cells; some inclusions were present in smooth muscle cells in the blood vessels, and a few were observed in endothelial cells and pericytes (Fig. 3 A and B). The frequency and levels of inclusions increased in the aged α-Gal A −/0 mice. In the heart of α-Gal A −/0 mice, lipid inclusions were seen in the cells of the connective tissues but not in the cardiac muscle cells. No lipid inclusions were observed in the heart of α-Gal A +/0 mice. In particular, examination of the heart of 10-wk-old α-Gal A −/0 mice revealed inclusions in the endothelial cells and smooth muscle cells surrounding the blood vessels and macrophage-like cells in the connective tissue (Fig. 3C). Similar to the progression of pathological changes in the skin, these lipid inclusions were observed more frequently, some becoming large in size, in the macrophage-like cells in the heart of the aged α-Gal A −/0 mice (Fig. 3D). Because Gb3 accumulation was conspicuous in the kidneys, we analyzed the kidney morphology by oil red O staining. Wild-type mice had no oil red O-staining positive material within glomeruli, and only small amounts of such material were detected in tubules (data not shown). α-Gal A −/0 mice had a trend toward more oil red O positive material within the glomeruli in the axial portion of the capillary tuft and possibly within mesangial cells and a significant increase in such material within cortical tubules (data not shown).
Figure 2.
Characteristic lipid inclusions in 80-wk-old α-Gal A −/0 mice. (A) A hepatocyte containing many lipid inclusions (arrows). (B) A Kupffer cell with a large lipid inclusion (arrow). (C) The smooth muscle cells (SM) surrounding this blood vessel (L, lumen of the vessel) in the brain contain many lipid inclusions (arrows). (D) A large lipid inclusion (arrow) in an endothelial cell from a kidney sample. (Bar = 1 μm.)
Figure 3.
EM analysis of skin and heart sections from α-Gal A −/0 mice of different ages. (A) Ten-week-old skin section showing a macrophage-like cell containing two distinct lipid inclusions (arrows). (B) In the skin section of 60-wk-old mice, the lipid inclusions increased in size and number. (C) Heart section from 10-wk-old mice showing typical lipid inclusions. An endothelial cell (EN) lining the lumen (L) of a blood vessel and a smooth muscle cell (SM) surrounding the blood vessel contain the characteristic lipid inclusions (arrows). (D) Heart section from 80-wk-old mice. A macrophage-like cell in the connective tissue had many typical lipid inclusions (arrows); some of them were very large in size. CM, cardiac muscle. (Bar = 1 μm.)
Globoside Levels of RBC in Human and Mouse.
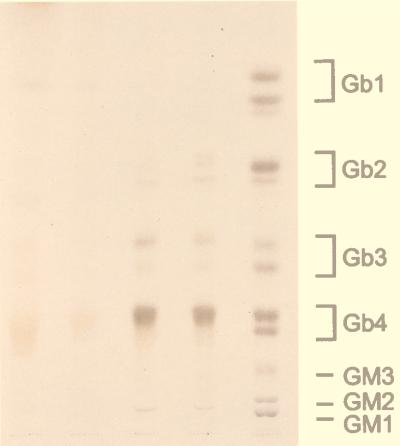
It has been postulated that globoside (GalNAcβ1–3Galα1–4Galβ1–4Glcβ1–1 ceramide), the major neutral glycosphingolipid of senescent erythrocytes, is a major precursor of Gb3, and it is a major source of the circulating Gb3 in humans (1, 2). The relatively mild phenotype and the different cellular specificity of Gb3 accumulation in α-Gal A −/0 mice compared with patients with Fabry disease suggested that there may be differences in RBC glycolipids between human and mouse. Therefore, mouse RBC glycolipid fractions were analyzed by high-performance thin-layer chromatography (Fig. 4). Globoside and Gb3 were undetectable in mouse erythrocytes. Although lower than globoside, Gb3 in human RBCs is easily detectable.
Figure 4.
Comparison of glycolipid profiles of mouse and human RBCs. Packed RBCs were extracted and processed as described in the text. The neutral glycolipids so obtained were separated by TLC and visualized by use of α-naphthol spray reagent. The loading volume, in microliters, of packed RBCs applied to each lane is given. Lane 1, mouse, 500 μl; lane 2, mouse, 125 μl; lane 3, human, 125 μl; lane 4, 125 μl; lane 5, glycolipid markers.
Effect of BMT on α-Gal A −/0 Mice.
Fifteen-week-old α-Gal A −/0 mice were lethally irradiated and transplanted with BM from α-Gal A +/0 littermates. Six months after BMT, tissues from the recipient α-Gal A −/0 mice and age-matched nontransplanted α-Gal A −/0 and α-Gal A +/0 mice were analyzed. To ensure successful engraftment of donor BM cells, these cells were harvested and cultured in methylcellulose. Individual colonies were picked after 7 to 10 days, and the genotype of each BM cell colony was determined by PCR by using allele-specific primer sets for wild-type and mutated alleles. Five to ten colonies were assayed from each BMT recipient with controls from α-Gal A −/0 and α-Gal A +/0 mice. BM cell colonies from BMT-treated recipients were genotyped only as α-Gal A +/0, indicating complete engraftment in these experiments (data not shown).
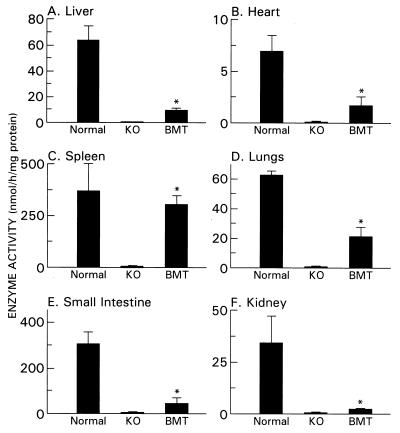
To evaluate the success of BMT in generating sustained expression of α-Gal A activity, we analyzed tissues from age-matched α-Gal A −/0, α-Gal A +/0 mice and BMT-treated α-Gal A −/0 mice 6 mo after BMT (Fig. 5). Tissues from BMT-treated α-Gal A −/0 mice exhibited statistically significant increases in the enzyme activity compared with those from α-Gal A −/0 mice (P < 0.01). The level of α-Gal A activity in the BMT-treated α-Gal A −/0 mice was 16% in the liver, 82% in the spleen, 25% in the heart, 34% in the lungs, 7% in the kidney, and 19% in the small intestine of the wild-type controls.
Figure 5.
α-Gal A-specific activity in the tissues from age-matched α-Gal A+/0 (WT), α-Gal A −/0 (KO), and BMT-treated α-Gal A −/0 (BMT) mice. Values are presented as the mean ± SD. ∗, P < 0.01.
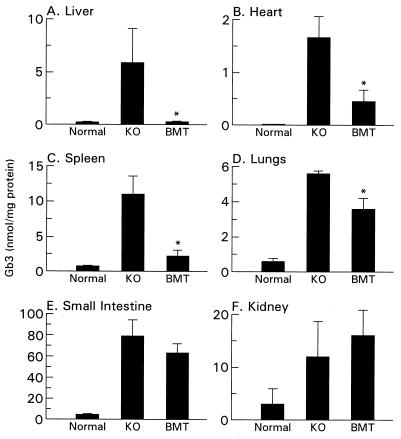
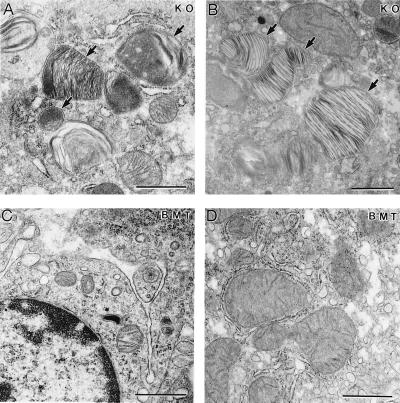
We evaluated the effect of BMT on the accumulation of Gb3 in organs and tissues of these mice. Quantitative HPLC analysis of tissue lipids demonstrated that BMT-treated α-Gal A −/0 mice have normal levels of Gb3 in the liver (Fig. 6). Furthermore, the transplanted mice showed reduction of Gb3 of over 70% in the heart and spleen and 35% in the lungs. EM analysis on the liver from BMT-treated α-Gal A −/0 mice showed further indication of effectiveness of BMT treatments. Compared with the liver from age-matched α-Gal A −/0 mice, BMT-treated α-Gal A −/0 mice had significantly fewer inclusions in the Kupffer cells, and no conspicuous inclusions were observed in the hepatocytes (Fig. 7).
Figure 6.
Gb3 levels in indicated tissues from α-Gal A+/0 (WT), α-Gal A −/0 (KO), and BMT-treated α-Gal A −/0 (BMT) mice. Values are presented as the mean ± SD. ∗, P < 0.01.
Figure 7.
EM analysis of liver sections from α-Gal A −/0 mouse (KO) and α-Gal A −/0 mouse 6 mo after BMT. (A) A Kupffer cell and (B) a hepatocyte with distinct lipid inclusions (arrows) from a 40-wk-old α-Gal A −/0 mouse. (C) A Kupffer cell and (D) a hepatocyte from α-Gal A −/0 mice 6 mo after BMT. (Bar = 1 μm.)
DISCUSSION
We have demonstrated a progressive accumulation of Gb3 and related pathology in affected organs in α-Gal A −/0 mice with age. However, clinical signs of Fabry disease were not apparent, and organ failure was not detected up to 80 wk of age. The pattern of accumulation of storage materials in α-Gal A −/0 mice was somewhat different from that in patients with Fabry disease. Absence of apparent endothelial lesions in α-Gal A −/0 mice may preclude expression of many of the phenotypic manifestations in patients with Fabry disease. The absence of significant amounts of globoside and Gb3 in mouse erythrocytes may underlie decreased storage of the glycolipid in vascular endothelial cells and specific tissues of α-Gal A−/0 mice resulting in a subclinical phenotype. Light- and electron-microscopic examination of histological changes in the tissues of α-Gal A −/0 mice revealed that the major cell types affected in this mutant mouse line are macrophage and macrophage-derived cells in the liver and skin and smooth muscle cells surrounding the blood vessels in the heart.
Lipid analyses of normal mouse liver and kidney showed relatively constant Gb3 levels with increased age. However, in the α-Gal A −/0 mice there was a significant increase (2-fold in liver and 1.5-fold in kidney) observed between tissues obtained from 10-wk-old and 20-wk-old animals. No further progression in glycolipid concentration was observed after 20 wk. However, Gb3 in liver from α-Gal A −/0 mice was approximately 30-fold elevated in liver and 4- to 6-fold elevated in kidney. In a study of a single patient with Fabry disease, the highest concentration of Gb3 was found in the kidneys, followed by heart and liver (14). Interestingly, the concentration of Gb3 in liver and kidney of α-Gal A −/0 mice was approximately the same in contrast to the patient samples reported in which the concentration in kidney is 35 times higher than in liver. Indeed, the concentration of Gb3 in kidneys from α-Gal A −/0 is only 25% of that reported for the Fabry patient.
The most striking results of the present study are those obtained with BMT. Gb3 in a number of organs was significantly reduced in the BMT-treated α-Gal A −/0 mice. Transplantation of allogeneic BM as a source of normal enzyme has proven to be beneficial in human studies with other lysosomal disease (for review, see ref. 16), but has never been tried for Fabry disease. Clearing the accumulated Gb3 may in part be a result of secretion of α-Gal A and its uptake from the plasma (17). Although α-Gal A activity in the liver of BMT-treated α-Gal A −/0 mice was 10% of normal levels, Gb3 accumulation was completely cleared from this organ. In cultured fibroblast experiments, lower levels (<5%) of α-Gal A were shown to be capable of normalizing substrate metabolism (15, 17). The reduction of Gb3 after BMT treatment in α-Gal A −/0 mice suggests this approach may have some utility in the treatment of some patients with Fabry disease. It also indicates that somatic gene therapy (15) using autologous human BM cells may become feasible for the treatment of patients with Fabry disease.
Acknowledgments
We thank Drs. Abner Notkins, Pam Robey, and James Shayman for critical reading of this paper and discussions during the course of these studies.
ABBREVIATIONS
- α-Gal A
α-galactosidase A
- BM
bone marrow
- BMT
bone marrow transplantation
- EM
electron microscopy
- Gb3
globotriaosylceramide
References
- 1.Brady R O, Gal A E, Bradley R M, Martensson E, Warshaw A L, Laster L. N Engl J Med. 1967;276:1163–1167. doi: 10.1056/NEJM196705252762101. [DOI] [PubMed] [Google Scholar]
- 2.Desnick R J, Ioannou Y A, Eng C M. In: The Metabolic and Molecular Bases of Inherited Disease. Scriver C R, Beaudet A L, Sly W S, Valle D, editors. New York: McGraw–Hill; 1995. pp. 2741–2784. [Google Scholar]
- 3.Brady R O, Tallman J F, Johnson W G, Gal A E, Leahy W R, Quirk J M, Dekaban A S. N Engl J Med. 1973;289:9–14. doi: 10.1056/NEJM197307052890103. [DOI] [PubMed] [Google Scholar]
- 4.Karlsson S. Blood. 1991;78:2481–2492. [PubMed] [Google Scholar]
- 5.Kay M A, Woo L C. Trends Genet. 1994;10:253–257. doi: 10.1016/0168-9525(94)90173-2. [DOI] [PubMed] [Google Scholar]
- 6.Ohshima T, Murray G J, Swaim W D, Longenecker G, Quirk J M, Cardarelli C O, Sugimoto Y, Pastan I, Gottesman M M, Brady R O, et al. Proc Natl Acad Sci USA. 1997;94:2540–2544. doi: 10.1073/pnas.94.6.2540. [DOI] [PMC free article] [PubMed] [Google Scholar]
- 7.Mayer J S, Scheerer J B, Sifers R N, Donaldson M L. Clin Chim Acta. 1981;112:247–251. doi: 10.1016/0009-8981(81)90384-3. [DOI] [PubMed] [Google Scholar]
- 8.Tallman J F, Brady R O, Quirk J M, Villalba M, Gal A E. J Biol Chem. 1974;249:3489–3499. [PubMed] [Google Scholar]
- 9.Lowry O H, Rosebrough N J, Farr A L, Randall R J. J Biol Chem. 1951;193:265–275. [PubMed] [Google Scholar]
- 10.Ullman M D, McClure R H. J Lipid Res. 1977;8:371–378. [PubMed] [Google Scholar]
- 11.Siakotos A N, Rouser G. J Am Oil Chem Soc. 1965;42:913–916. [Google Scholar]
- 12.Schiffmann R, Medin J A, Ward J M, Stahl S, Fox-Cottler M, Karlsson S. Blood. 1995;86:1218–1227. [PubMed] [Google Scholar]
- 13.Desnick R J, Seeley C C. In: The Metabolic Bases of Inherited Disease. 5th Ed. Stanbury J B, Wyngaarden J B, Fredrickson D S, Goldstein J L, Brown M S, editors. New York: McGraw–Hill; 1983. pp. 906–944. [Google Scholar]
- 14.Hozumi I, Nishizawa M, Ariga T, Miyatake T. J Lipid Res. 1990;31:335–340. [PubMed] [Google Scholar]
- 15.Krivit W, Shapiro E, Hoogerbrugge P M, Moser H W. Bone Marrow Transplant. 1992;10:87–96. [PubMed] [Google Scholar]
- 16.Mayer J S, Cray E L, Dell V A, Scheere J B, Sifers R N. Am J Hum Genet. 1982;34:602–610. [PMC free article] [PubMed] [Google Scholar]
- 17.Medin J A, Tudor M, Simovitch R, Quirk J M, Jacobson S, Murray G J, Brady R O. Proc Natl Acad Sci USA. 1996;93:7917–7922. doi: 10.1073/pnas.93.15.7917. [DOI] [PMC free article] [PubMed] [Google Scholar]


