

Abstract
Proteomics discovery leads to a list of potential protein biomarkers that have to be subsequently verified and validated with a statistically viable number of patients. Although the most sensitive, the development of an ELISA test is time-consuming when antibodies are not available and need to be conceived. Mass spectrometry analysis driven in quantitative multiple reaction monitoring mode is now appearing as a promising alternative to quantify proteins in biological fluids. However, all the studies published to date describe limits of quantitation in the low μg/ml range when no immunoenrichment of the target protein is applied, whereas the concentration of known clinical biomarkers is usually in the ng/ml range. Using prostate-specific antigen as a model biomarker, we now provide proof of principle that mass spectrometry enables protein quantitation in a concentration range of clinical interest without immunoenrichment. We have developed and optimized a robust sample processing method combining albumin depletion, trypsin digestion, and solid phase extraction of the proteotypic peptides starting from only 100 μl of serum. For analysis, mass spectrometry was coupled to a conventional liquid chromatography system using a 2-mm-internal diameter reverse phase column. This mass spectrometry-based strategy was applied to the quantitation of prostate-specific antigen in sera of patients with either benign prostate hyperplasia or prostate cancer. The quantitation was performed against an external calibration curve by interpolation, and results showed good correlation with existing ELISA tests applied to the same samples. This strategy might now be implemented in any clinical laboratory or certified company for further evaluation of any putative biomarker in the low ng/ml range of serum or plasma.
Used for years across a wide range of pathologies, proteomics studies based on semiquantitative mass spectrometry of proteins have already led to the discovery of numerous protein biomarker candidates. Often tens of putative biomarkers have been described for a single disease, but the subsequent phase of clinical evaluation on large cohorts for each candidate is clearly the bottleneck as revealed by the meager number of newly approved biomarkers for clinical use. One of the critical limitations of discovery work flows arises when no antibody is available to initiate an immunoassay because 1–3 years are required to conceive de novo a reliable immunoassay. Such a delay is a serious drawback when tens of putative markers are concerned. Quantitation of small organic molecules by mass spectrometry has been used extensively for years in the field of environmental contaminant analysis or pharmacokinetic profiling of drug candidates during clinical studies. More recently, absolute quantitation of proteins using mass spectrometry by single (SRM)1 or multiple reaction monitoring (MRM) and stable isotope dilution has thus naturally emerged as an alternative to immunoassays. Basically the absolute quantitation of a protein is provided by the integration of the specific MRM signals corresponding, respectively, to a proteotypic peptide (1) obtained from enzymatic hydrolysis of the target protein (usually by trypsin) and to its synthetic stable isotope-labeled isotopomer (2). The validation criteria of an MS-based method in terms of accuracy and precision are relatively easy to fulfill when addressing small molecules or proteins below 10 kDa in plasma or serum. Indeed they may be easily extracted from the bulk of high molecular mass proteins simply by selective precipitation. The quantitation of higher molecular mass proteins has proven to be more challenging because of the complexity and large dynamic range of proteins in e.g. plasma. In a pioneering study Anderson and Hunter (3) successfully demonstrated generation of a multiplexed assay for proteins covering high (tens to hundreds of micrograms/milliliter) to medium (hundreds of nanograms/milliliter to a few micrograms/milliliter) abundance ranges in plasma when combined with immunodepletion. However, these ranges remain problematic because clinically relevant biomarkers are usually present in plasma or serum in the low nanogram/milliliter range or below. To significantly improve the limit of quantitation (LOQ) of LC-MRM mass spectrometry, Keshishian et al. (4) evaluated a combination of immunodepletion of the most abundant plasma or serum proteins with strong cation exchange (SCX) chromatography for sample preparation prior to LC-MRM analysis. LOQs in the 1–10 ng/ml range were obtained with a coefficient of variation from 3 to 15% for five exogenous non-human proteins and the human prostate-specific antigen (PSA) protein spiked together into immunodepleted plasma from a healthy female donor. Very recently, a new approach using product ion scanning on a linear ion trap was proposed by Diamandis and co-workers (5) that allowed reaching a limit of quantitation of 1 ng/ml for PSA spiked into control plasma. This study marked a gain in sensitivity compared with previous attempts by others on similar instrumentation (6–9) but applied immunopurification of the target protein.
Interestingly all the strategies published to date have been dealing with analytical development of work flows for the validation of biomarker candidates using microbore, nanoflow chromatography. Nanoflow is without any doubt appealing over conventional microflow during the proteomics discovery phase when the amount of biological material, for instance from a tumor biopsy, is often limited. Nonetheless this technique inherently still suffers from a lack of robustness and requires skilled personnel to be operational on a daily basis. As a consequence, nanoflow chromatography is not easily adaptable for the high throughput analysis environment encountered in clinical laboratories or good laboratory practice-certified or contract research organization companies where hundreds of samples are handled per day. In such organizations only microflow separations using 1- or 2-mm-internal diameter HPLC columns are compatible with the requirements of robustness and sample throughput.
Therefore, the present work was centered on how a simple work flow could, in the near future, enable the large scale verification phase of putative biomarkers in the ng/ml of plasma range by the use of conventional LC equipment, i.e. using a 2-mm-internal diameter HPLC column. To address this question, we have considered that the absolute quantitation of PSA in true clinical samples could represent a challenging model. Combining immunodepletion of serum albumin and peptide fractionation simply by solid phase extraction (SPE), we were able to demonstrate for the first time the absolute quantitation of PSA by LC-MRM mass spectrometry in clinical serum samples of patients with benign prostate hyperplasia (BPH) or prostate cancer (PCa) within concentrations ranging from 4 to 30 ng/ml. Furthermore a good correlation was observed between the clinical ELISA tests and the mass spectrometry-based assays. We believe that these results are an unprecedented demonstration that the clinical relevance of putative biomarkers issued from proteomics investigation may now be confidently evaluated in the ng/ml range by robust coupling between conventional bore LC and mass spectrometry.
EXPERIMENTAL SECTION
Reagents and Chemicals—
Acetonitrile and water (LC-MS grade) were obtained from Fisher Scientific. DTT, iodoacetamide, urea, and Tris were purchased from Sigma-Aldrich. Human PSA was provided by Scipac (Sittingbourne, UK). Labeled peptide internal standards derived from PSA (LSEPAELTDAVK) were synthesized by bioMérieux (Lyon, France). Healthy female serum was obtained from the Etablissement Français du Sang, and patient serum was obtained from The Hospital of Lyon-Sud.
Depletion of Abundant Proteins—
The recovery of PSA after the depletion of serum albumin was estimated by an ELISA test on a VIDAS®, an automated analyzer, using the VIDAS TPSA kit (bioMérieux, Marcy l’Etoile, France). The evaluation of different depletion kits was performed using buffers provided with the kits and according to the manufacturers’ instructions. Three commercial depletion kits, the ProteoExtract Albumin/IgG kit from Calbiochem (Merck Chemicals), the Aurum™ Serum Protein minikit from Bio-Rad, and the Vivapure anti-HSA kit (depletion of albumin using polyclonal antibodies) from Sartorius (Goettingen, Germany), were evaluated with female serum spiked with three different PSA concentrations (250, 500, and 1000 ng/ml). To reduce the depletion cost and to use monoclonal antibodies, a homemade affinity gel using CNBr-activated Sepharose 4B (GE Healthcare) was developed according to the manufacturer 's instructions. 1 ml of anti-HSA antibodies at a concentration of 10 mg/ml was dialyzed overnight against 4 liters of coupling solution (100 mm NaHCO3, 0.5 m NaCl, pH 8.3). 300 mg of medium were suspended and washed for 15 min with 1 mm HCl. The coupling solution containing antibodies was added to the medium suspension. The mixture was gently mixed for 1 h at room temperature. Excess antibodies were washed away using 5 gel volumes of coupling buffer. Remaining active groups were blocked using 0.1 m Tris-HCl buffer, pH 8.0 for 2 h. Then the medium was washed using at least three cycles of alternating pH, each cycle consisting of a wash with 0.1 m acetic acid, sodium acetate, pH 4 containing 0.5 m NaCl followed by a wash with Tris-HCl, pH 8 containing 0.5 m NaCl. Medium was stored in PBS. All experiments using our homemade affinity gel were performed on 100 μl of serum diluted in 900 μl of PBS. 2 ml of our homemade affinity gel diluted 2-fold in PBS were packed in a Vivaspin 20 (Sartorius), centrifuged at 100 × g for 3 min, and washed twice with 1 ml of PBS. Serum and affinity gel were incubated for 40 min at room temperature, the mixture was centrifuged at 100 × g for 3 min to recover albumin-depleted sample, and the resin was washed twice with 1 ml of PBS to complete sample recovery. The efficiency of albumin depletion was evaluated by measuring albumin concentration before and after the depletion step using an albumin kit (bioMérieux, Marcy l’Etoile, France). For homemade column regeneration, the bound HSA fraction was eluted with 3 gel volumes of 0.1 m carbonate buffer, 0.5 m NaCl, pH 11 and re-equilibrated with 3 gel volumes of PBS.
PSA ELISA—
PSA quantitation using ELISA was performed on VIDAS, an automated analyzer, using the VIDAS TPSA kit (bioMérieux, Marcy l’Etoile, France). The VIDAS TPSA assay is an equimolar test that detects PSA bound to α1-antichymotrypsin (PSA·ACT) and free PSA in the same manner. PSA bound to α2-macroglobulin (PSA·α2M) is not accessible to anti-PSA antibodies and cannot be detected using classical PSA ELISA tests such as VIDAS TPSA. VIDAS TPSA was calibrated according to the First International Standard (10).
Enzymatic Digestion—
The control, depleted, PSA-spiked female serum and male clinical serum samples were denatured by 6 m urea, 10 mm Tris, pH 8.0, 30 mm dithiothreitol at 40 °C for 40 min and then alkylated with 50 mm iodoacetamide at room temperature in the dark for 40 min. Urea concentration was diluted 6-fold with water prior to overnight digestion at 37 °C with trypsin (sequencing grade modified, Promega) using a 1:30 (w/w) enzyme to substrate ratio. Tryptic digestion was stopped with formic acid to a final concentration of 0.5% and desalted prior to ion exchange fractionation using Oasis HLB 3-ml (60-mg) reversed phase cartridges (Waters). The Oasis cartridges were conditioned with 1 ml of methanol and then with 1 ml of water containing 0.1% formic acid prior to loading of the tryptic digest. Cartridges were washed with 1 ml of 0.1% formic acid and eluted with methanol/water (80:20, v/v) containing 0.1% formic acid. The samples were finally dried by vacuum centrifugation.
Mixed Cation Exchange (MCX) Peptide Fractionation—
Digested and desalted serum spiked with PSA was reconstituted in 1 ml of acetate buffer (200 mm, pH 3.0) and fractionated on MCX cartridges (60 mg) from Waters using the following procedure. Cartridges were conditioned with 1 ml of methanol and 1 ml of acetate buffer, pH 3.0. The digested serum in acetate buffer was then loaded. SPE cartridges were washed with 1 ml of acetate buffer, pH 3.0 and 1 ml of methanol. The peptide fraction containing the peptides of interest (IVGGWECEK and LSEPAELTDAVK from PSA with a calculated pI of 4.15 and 3.9, respectively) were eluted with 1 ml of solvent mixture methanol/acetate buffer, pH 5.5 (50:50, v/v). The eluate was then dried using vacuum centrifugation. The peptides were finally resuspended in 200 μl of a mixture of acetonitrile/water (3:97, v/v) containing 0.1% of formic acid, and an aliquot (50 μl) was analyzed by LC-MRM mass spectrometry.
Liquid Chromatography-Mass Spectrometry—
LC-MS analyses were performed on a system consisting of an HP 1100 series HPLC instrument comprising a binary pump and autosampler (Agilent Technologies, Waldbronn, Germany) coupled to either an API 2000 (Applied Biosystems/MDS Analytical Technologies, Foster City, CA) triple quadrupole (for depletion and purification studies) or to a 4000 QTRAP hybrid triple quadrupole/linear ion trap mass spectrometer (Applied Biosystems/MDS Analytical Technologies) equipped with an electrospray ion source. The LC separation was carried out on a Symmetry C18 column (100 × 2.1 mm, 3.5 μm) from Waters. Elution was performed at a flow rate of 300 μl/min with water containing 0.1% (v/v) formic acid as eluent A and acetonitrile containing 0.1% (v/v) acid formic as eluent B, using a linear gradient from 5% B to 50% B in 25 min and from 50 to 100% B in 3 min. The gradient was returned to the initial conditions over 10 min and held there for 12 min prior to the next injection to equilibrate the analytical column. MS analysis was carried out in positive ionization mode using an ion spray voltage of 5500 V. Instrument control, data acquisition, and processing were performed using the associated Analyst 1.4.1 software. The mass spectrometer was initially calibrated using polypropylene glycol as standard (Applied Biosystems, Foster City, CA). Q1 and Q3 quadrupole resolution was adjusted to 0.7 ± 0.1 amu full-width half-maximum, referred to as unit resolution.
The nebulizer (air) and the curtain gas flows (nitrogen) were set at 30 and 20 p.s.i., respectively. The Turbo V™ ion source was operated at 400 °C with the auxiliary gas flow (nitrogen) set at 40 p.s.i.
An MRM-Initiated Detection and Sequencing (MIDAS) experiment was used to scout for suitable MRM transitions using a purified PSA tryptic digest. Q1 and Q3 masses as well as collision energy values were predicted from the PSA primary sequence using MIDAS Workflow Designer Software V1.1 (Applied Biosystems).
From the initial set of candidate MRM transitions, transitions tracking, respectively, IVGGWECEK (538.5/865.3; 538.5/213.2) and LSEPAELTDAVK (636.8/943.5; 636.8/312.2) peptides were selected for the final assay. The collision energy, declustering potential, and collision cell exit potential were optimized for each chosen MRM transition by infusion of a digest of PSA. The MRM transitions were monitored and acquired at unit resolution in Q1 and Q3 with a dwell time of 70 ms used for each transition to obtain between 25 and 30 data points per chromatographic peak.
Preparation of Standard and Quality Controls Samples—
PSA solution from Scipac at 1.14 mg/ml was diluted in human female serum to give a 200 μg/ml stock solution, and the concentration was verified with the VIDAS TPSA ELISA kit. All human female serum samples used were also previously tested by VIDAS TPSA ELISA kit to make sure that levels of endogenous PSA were below the detection limits. Serum standards and quality control samples were prepared by diluting the 200 μg/ml stock solution with an ELISA-tested blank female serum to reach the desired concentrations of 1, 5, 10, 20, and 40 ng/ml. Each sample was separately submitted to immunodepletion of albumin, digested with trypsin, and fractionated by SPE.
Heavy Peptide Synthesis and Qualification—
Natural and heavy LSEPAELTDAVK peptides were synthesized using Fmoc chemistry on an ABI433A peptide synthesizer (Applied Biosystems). Two l-[13C3]alanine-N-Fmoc building blocks (Euriso-Top, Saint-Aubin, France) were incorporated into the heavy peptide. Peptide purities were established using HPLC and mass spectrometry (ion trap LCQ, ThermoFisher Scientific, Waltham, MA) to be better than 95%. Peptide concentrations were measured in 1-mg vials using an amino acid analyzer series 1100 with fluorescence detector (Agilent Technologies, Massy, France).
Recovery Evaluation—
To evaluate recovery of our sample treatment, stock solution of heavy (13C6) LSEPAELTDAVK peptide at a concentration of 7.8 pmol/μl was diluted to a concentration of 14 fmol/μl. 5 μl of the heavy peptide solution at 14 fmol/μl were added to each point of the calibration curve after the immunoaffinity depletion and the MCX fractionation steps to reach a final concentration of heavy standard peptide equivalent to a concentration of PSA of 20 ng/ml.
RESULTS
The aim of the present work was to evaluate the ability of developing a reliable analytical work flow based on LC-MRM mass spectrometry for candidate biomarker verification present in the low nanogram/milliliter range in serum without the need for immunopurification at either the protein or peptide level. In the perspective of large cohort evaluation, our initial analytical specifications involved both sufficient throughput and robustness. Prompted by the analytical work flow applied for small molecule assays, only the SPE method was considered for peptide fractionation. Similarly a robust conventional bore liquid chromatography configuration (i.e. 2-mm-internal diameter C18 reverse phase column) was immediately preferred to the nanoflow chromatography device (75-μm internal diameter) used in most previous clinical proteomics studies.
A clinically relevant LOQ of about 4 ng/ml was targeted for our prostate-specific antigen biomarker model. This clinically relevant value was chosen to ultimately prove the relevance of the designed strategy in evaluating true patient sera. Fig. 1 describes our optimized sample processing work flow for clinical quantitation of PSA based on external calibration.
Fig. 1.

Experimental flow diagram applied for the clinical quantitation of PSA in patient sera by external calibration. The calibration curve was obtained by spiking PSA in aliquots of 100 μl of a female serum from a healthy donor at 0, 1, 5, 10, 20, and 40 ng/ml prior to albumin immunodepletion, trypsin digestion, and MCX fractionation of peptides by SPE. 50 μl of each processed sample were analyzed by LC-MRM/MS using a conventional bore liquid chromatography column of 2.1-mm inner diameter.
Influence of Albumin Depletion Strategy on the PSA Recovery—
Plasma and serum are by far the most complex biological fluids with respect to the huge number of constitutive proteins and to the dynamic range of concentration, estimated to be 11 or 12 orders of magnitude. This is a challenge in the case of protein biomarkers whose verification usually requires the assay of a protein dispersed at a few ng/ml among the most abundant proteins at tens of mg/ml, e.g. albumin protein or Ig proteins. Such a dynamic range induces a biological background, namely the matrix effect that unavoidably affects the sensitivity and specificity of MRM signals. Hence the lowest limit of quantitation of a protein in non-depleted serum is reported around the μg/ml range (11), whereas an MS-based clinically relevant assay of PSA should span LOQ in the low ng/ml range. To achieve such a level of sensitivity, the removal of the highest abundance proteins from serum is consequently necessary.
To remove albumin, three specific commercialized kits and a homemade immunodepletion column were evaluated for their efficacy in simultaneously minimizing the loss of PSA protein during the depletion step. The versatile Cibacron blue affinity-based depletion column from Bio-Rad (Aurum albumin depletion kit) was first evaluated because of its low cost and ability to handle large volumes of serum with the perspective of high throughput analysis. As seen in Fig. 2, this chromatographic column suffers from a marked lack of specificity because 95% of PSA (recovery, 5%) was retained on the dye-resin as measured by the ELISA test. This result is not really surprising because previous studies (12) have already mentioned the nonspecific binding of numerous proteins such as the low abundance cytokines (13). Less expected, however, was the limited 70% recovery of PSA protein when applying a mixed polyclonal antibody and protein G column (ProteoExtract) for concomitant removal of albumin and IgG. Finally the best PSA recovery, nearly 95%, was obtained with both the commercial antibody fragment Vivapure anti-HSA kit from Sartorius and a homemade column of immobilized monoclonal antibodies. This latter approach was then systematically applied for all the subsequent developments and clinical assays presented below as the albumin depletion efficiency (80%) of the column was well conserved even up to three regeneration steps.
Fig. 2.

Evaluation of prostate-specific antigen loss as a function of depletion column. Mean (n = 9) PSA recovery (%) measured by VIDAS TPSA ELISA test performed before and after depletion of a female serum from a healthy donor spiked with prostate-specific antigen at 250 ng/ml, 500 ng/ml, and 1 μg/ml using three commercial kits and a homemade anti-human serum albumin immunoaffinity gel is shown. Error bars indicate standard deviation of measurements.
Development of the LC/MS/MS Method—
The sensitivity and selectivity of an LC-MRM/MS assay is critically dependent on the choice of the MRM transitions and, of course, the intrinsic performance of the instrument. Early developments concerning the optimization of sample processing were carried out on an API 2000 triple quadrupole instrument. First a list of theoretical MRM transitions was generated by the MIDAS Workflow Designer software tool. These were designed by selecting all doubly and triply protonated precursor ions of the predicted tryptic peptides over a mass range of 800 to 3000 Da and for each precursor ion the most likely observed y type fragment ions with an m/z above that of the precursor ion. These MRM transitions were then tested on a trypsin digest of pure PSA (1 μg/ml). In the MIDAS work flow, MS/MS scans were triggered on all detected SRM signals to verify next that there were no y or b peptide fragments not selected by the MIDAS software that would exhibit a more intense signal (see as an example the b3 − H2O in the MS/MS spectrum of Fig. 3). Next the most intense MS/MS fragments for four peptides giving rise to the most intense MRM signals (i.e. the proteotypic peptides with the likely highest ionization yield) were simultaneously evaluated in MRM mode to definitely confirm the two most sensitive transitions per peptide. Finally two peptides, LSEPAELTDAVK and IVGGWECEK (636.8/943.5; 636.8/312.2 and 538.5/865.3; 538.5/213.2) were retained for further evaluation in terms of sensitivity by spiking a female serum with PSA at two concentration points of 1000 and 200 ng/ml, respectively.
Fig. 3.

Full-scan MS/MS spectra of LSEPAELTDAVK derived from PSA. cps, counts/s.
To further improve the signal to noise ratio of the respective MRM channels, different solid phase extraction supports were tested for their ability to enrich the selected two proteotypic PSA peptides. Among the different combinations tested, the most significant improvement was obtained when the Oasis HLB support was used in conjunction with a mixed cation exchange solid phase support (Oasis MCX). As an illustration, Fig. 4 shows the chromatograms reconstructed on the previously defined four most intense MRM signals that track PSA in crude serum (Fig. 4A) or after albumin depletion and SPE peptide fractionation (Fig. 4B). This protocol allowed a marked suppression of the interfering matrix effect with an average increase in signal to noise ratio of 10 for the two peptide sequences.
Fig. 4.

Effect of serum and peptide processing on the extracted ion chromatogram of MRM transitions monitored for LSEPAELTDAVK and IVGGWECEK derived from PSA. An overlay of transitions 636.8/943.5 (blue) and 636.8/312.2 (red) monitored for LSEPAELTDAVK and transitions 539.3/213.2 (green) and 539.3/865.3 (gray) monitored for IVGGWECEK tracking PSA spiked at a concentration of 4 μg/ml in female serum from a healthy donor recorded on an API 2000 triple quadrupole mass spectrometer is shown. A, trypsin digestion of crude serum; B, after albumin depletion, trypsin digestion, and peptide fractionation by MCX on an SPE cartridge. cps, counts/s.
The LOQ that might be expected from such an “old” generation instrument was far above our targeted clinically relevant LOQ of about 4 ng/ml PSA in serum. Hence we considered in a first attempt that the record of MRM signals with signal to noise ratio better than 10 for PSA spiked at 200 ng/ml would be promising for subsequent analysis on the much more sensitive 4000 QTRAP instrument. Using the API 2000 and PSA spiked at a concentration of 200 ng/ml, only the transitions 636.8/943.5 and 636.8/312.2 tracking LSEPAELTDAVK peptide showed a signal to noise ratio better than 10 (Fig. 5). Similarly using an API 4000 QTRAP, transitions of peptide LSEPAELTDAVK were shown to have a higher sensitivity than transitions tracking peptide IVGGWECEK. The LOQ for transition 539.3/865 (peptide IVGGWECEK) was above 40 ng/ml (data not shown), far above our targeted clinically relevant LOQ of about 4 ng/ml PSA in serum. Therefore, only peptide LSEPAELTDAVK was considered for the subsequent evaluation of the method and the final MS-based assay of PSA in patient sera.
Fig. 5.

Extracted ion chromatogram of MRM transitions monitored for LSEPAELTDAVK and IVGGWECEK derived from PSA at 200 ng/ml. An overlay of transitions 636.8/943.5 (blue) and 636.8/312.2 (red) monitored for LSEPAELTDAVK (A) and transitions 539.3/213.2 (green) and 539.3/865.3 (gray) monitored for IVGGWECEK (B) tracking PSA spiked at a concentration of 200 ng/ml in serum from a healthy donor recorded on a API 2000 triple quadrupole mass spectrometer after albumin depletion, trypsin digestion, and peptide fractionation by MCX on an SPE cartridge is shown. cps, counts/s.
Quality Evaluation of the Method—
Ideally multiple transitions within the same retention time should be used per peptide for quantitation by LC-SRM/MS. Because only two transitions of a single peptide exhibited the required sensitivity, a critical evaluation of the robustness of sample processing and linearity of the SRM channels was therefore required over the targeted clinically relevant concentration range of PSA (0–40 ng/ml). Statistical analysis of intraday variation and linearity of the selected optimal MRM signals was evaluated across three biological replicates. Volumes of 100 μl of a blank female serum were spiked with the PSA protein between 1 and 40 ng/ml and submitted to the whole optimized work flow as described in Fig. 1 (i.e. albumin depletion, trypsin digestion, and SPE fractionation). Simultaneously the specificity of the SRM channels was assessed by analyzing a set of six different female blank sera, preliminarily tested toward the presence of endogenous PSA by the VIDAS TPSA ELISA kit. Although nonspecific endogenous MRM signals were systematically detected, the analysis showed no interfering peaks at the elution time of LSEPAELTDAVK proteotypic peptide except when the serum was spiked with PSA at a concentration of 5 ng/ml (Fig. 6). Calibration curves were obtained by establishing a linear regression function (y = 39.8x + 3.36) of the peak area of LSEPAELTDAVK peptide versus the PSA concentration of the nominal standard. Linearity was observed between 1.5 and 40 ng/ml for transition 636.8/943.5 with a determination (r2) greater than 0.99, and differences between nominal and calculated concentrations were lower than 15% (Fig. 7). Within three process replicates, relative standard deviation and accuracy were between 4.4 and 8.8% and −7 and +10%, respectively (Table I).
Fig. 6.

Specificity of transition 636.8/943.5 monitored for LSEPAELTDAVK peptide derived from PSA at 5 ng/ml. Extracted ion chromatograms of the transition 636.8/943.5 monitored for LSEPAELTDAVK peptide recorded on 4000 QTRAP hybrid triple quadrupole/linear ion trap mass spectrometer tracking PSA in a female serum from a healthy donor (A) and a female serum from a healthy donor spiked with PSA at a concentration of 5 ng/ml (B) are shown. cps, counts/s.
Fig. 7.
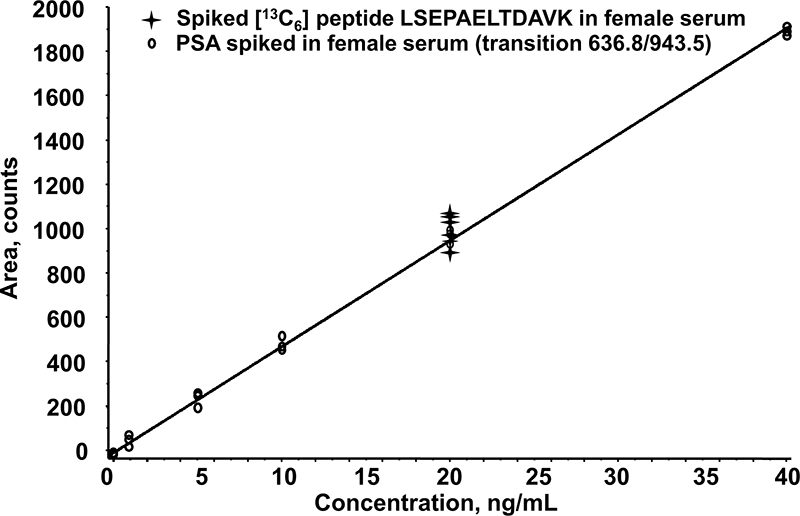
Calibration curve of transition 636.8/943.5 monitored for LSEPAELTDAVK peptide derived from PSA. The calibration curve (○) was obtained with intact PSA spiked into a female serum from a healthy donor at concentrations of 1, 5, 10, 20, and 40 ng/ml (three biological replicates per concentration point) prior to albumin depletion, trypsin digestion, and peptide fractionation by MCX on an SPE cartridge. An estimation of the overall recovery of PSA was determined by plotting the area ratio of the 639.8/949.5 transition monitoring the heavy (13C6) LSEPAELTDAVK standard ( ) spiked at a concentration of 20 ng/ml prior to LC-MRM/MS analysis.
Table I.
Intra- and interday validation statistics
| Nominal concentration | Intraday variation (n = 3)a
|
Interday variation (n = 8)b
|
||||
|---|---|---|---|---|---|---|
| Determined concentration (mean ± S.D.) | Precisionc | Accuracyd | Determined concentration (mean ± S.D.) | Precisionc | Accuracyd | |
| ng·ml−1 | % | % | % | % | ||
| 5 | 4.92 ± 0.43 | 8.82 | −1.67 | 4.95 ± 0.46 | 9.23 | −0.88 |
| 10 | 11.00 ± 0.95 | 8.67 | 10.00 | 10.72 ± 0.73 | 6.84 | 7.21 |
| 20 | 21.27 ± 1.07 | 5.03 | 6.33 | 20.41 ± 1.01 | 4.94 | 2.06 |
| 40 | 37.2 ± 1.64 | 4.40 | −7.00 | 38.72 ± 1.62 | 4.20 | −3.19 |
Intraday variation was evaluated across three biological replicates per concentration point: 100 μl of blank female serum was spiked with PSA and then submitted to albumin depletion, trypsin digestion of the peptides, and fractionation by MCX.
Interday variation was evaluated across eight biological replicates per concentration point over a 3-month period different from those used for the interday variation: 100 μl of blank female serum was spiked with PSA and then submitted to albumin depletion, trypsin digestion of the peptides, and fractionation by MCX.
Expressed as relative S.D.: (S.D./mean) × 100.
Expressed as percent difference:((concentration found − concentration added)/concentration added) × 100.
The second 636.8/312.2 transition exhibited a relative standard deviation between 16 and 33% and was not suitable for a quantitative measurement. This SRM signal, however, was systematically recorded during the clinical tests to correlate with the retention time of the quantifying MRM transition. The interday variation was similarly evaluated over a period of 3 months using two distinct 4000 QTRAP hybrid triple quadrupole instruments. Calculated from eight biological replicates, the interassay mean precision ranged between 4.2 and 9.3%, whereas interassay accuracy was between −3.1 and +7.2% (Table I). The interassay coefficient of variation better than 10% at 5 ng/ml demonstrated adequate precision close to the targeted lowest clinically relevant cutoff. This quality control evaluation led us to define the limit of detection and the LOQ for peptide LSEPAELTDAVK, calculated as a magnitude of, respectively, 3 and 10 times the standard deviation of noise in a blank sample (3σ) at, respectively, 1.5 and 5 ng/ml.
Overall Recovery Evaluation—
To estimate the overall recovery of PSA after immunoaffinity depletion, trypsin digestion, and sample fractionation by SPE, 13C6-labeled LSEPAELTDAVK internal standard was added to each concentration point of the calibration curve to a final concentration of 20 ng/ml just prior to LC-SRM/MS analysis. 20 ng/ml was chosen as the median of the targeted clinically relevant concentration range. Recovery evaluation was performed along the external calibration standard points; it was estimated at about 93% (17.1% intraday relative standard deviation). Considering the previously evaluated 5% protein loss during the HSA depletion, such a recovery suggests a nearly complete digestion by trypsin and negligible losses during SPE fractionation. Moreover the linearity of the MRM response over the 1.5–40 ng/ml concentration range indicates that this recovery is constant along the calibration curve.
MS-based Assays Versus ELISAs for Absolute Quantitation of PSA in Clinical Samples—
Because it was possible to obtain human female sera free of PSA and considering the reasonable intra- and interassay coefficients of variation that were less than 10%, the absolute quantitation of PSA was carried out in nine sera from patients with BPH or PCa by external interpolation against a calibration curve. To our knowledge, this is the first report of PSA measurements in true clinical samples independent of an ELISA test. As an example, Fig. 8 shows the extracted ion chromatograms of transitions 636.8/943.5 and 636.8/312.2 for one patient with a PSA level quantified at 11 ng/ml of serum. Fig. 9 plots the clinical PSA doses across nine patients deduced from LC-MRM/MS (y axis) against concentrations measured by the VIDAS TPSA ELISA test (x axis). A paired t test showed no significant difference in the doses between the two methods (p = 0.1122). The regression analysis of the calibration curve was: LC-MRM/MS = 0.8589 ELISA + 0.2931 with r2 = 0.96. This degree of correlation is consistent with those generally observed for different ELISA kits. For instance, the comparison of VIDAS TPSA with another enzyme immunoassay method led to the following regression equation: x = 0.89y + 1.1 with r2 = 0.997 (n = 171) (VIDAS TPSA package insert 09296 F-fr-2007/01).
Fig. 8.

LC-MRM/MS assay of a patient serum. An overlay of transitions 636.8/943.5 (blue) and 636.8/312.2 (red) monitored for LSEPAELTDAVK peptide tracking PSA in a patient serum tested at a concentration of 13.2 ng/ml using the VIDAS TPSA ELISA test and calculated at 10.9 ng/ml from the LC-SRM/MS experiment by interpolation with a calibration curve is shown. cps, counts/s.
Fig. 9.
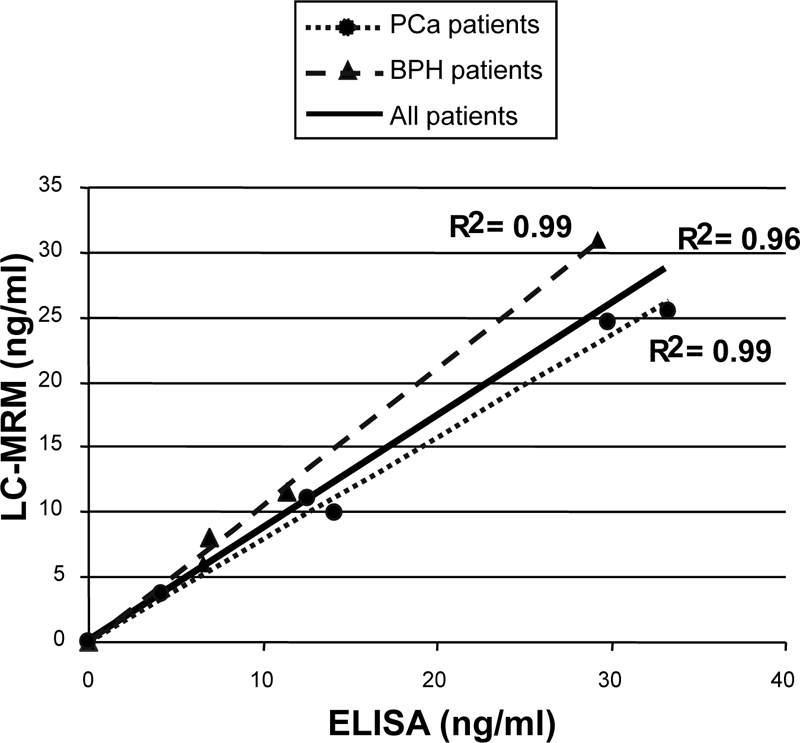
ELISA correlation with LC-MRM/MS-based quantitation of PSA in clinical samples. Correlation between the PSA assay obtained by the VIDAS TPSA ELISA test (x axis) and by extracted SRM ion signal of the transition 636.8/943.5 for LSEPAELTDAVK peptide) (y axis) across five patients with PCa and four patients with BPH is shown. Four female sera from healthy donors were run in parallel as controls. Quantitation was obtained by interpolation with a calibration curve. Each patient serum (100 μl) was submitted to albumin depletion, trypsin digestion, and peptide fractionation by MCX on an SPE cartridge.
For the urology community, the standardization of PSA quantitation has been an acute preoccupation since the 1990s when patient doses were shown to differ significantly depending on the ELISA test. Apart from classical ELISA bias, a major cause of the observed discrepancies was related to differential epitope recognition of the various PSA forms (14). In blood, PSA can remain free or be complexed with several protease inhibitors (PSA·ACT or PSA·α2M) (15). As a consequence, sera containing equivalent amounts of total PSA but differing in their respective proportions of free PSA and PSA·ACT complex could produce different ELISA responses depending on antibody affinity for each form. As an attempt to smooth this variability, Stamey and co-worker (16) proposed a standard mixture of 90% PSA·ACT and 10% PSA complexes that was further established as the First International Standard (10). The reference ELISA test (VIDAS TPSA) used in this study was calibrated according to this standard. Therefore, for the first time, we report here a quantitative non-ELISA method enabling a measurement of PSA doses in patient sera. Our LC/MS/MS method confirms the accuracy of ELISA tests, such as VIDAS TPSA, calibrated according to the First International Standard.
If BPH and PCa patients are considered independently, the correlation between LC/MS/MS and ELISA is actually improved with r2 = 0.99 for BPH and r2 = 0.99 for PCa versus r2 = 0.96 for all the patients. PSA complexed to α2M is not detected using classical ELISA tests targeted against total PSA. According to Zhang et al. (17) the concentration of PSA·α2M complex in serum is correlated with that of total PSA and, on average, accounts for 10% of serum PSA. They described, however, a significantly higher amount of PSA·α2M complex in serum from BPH than from PCa patients. Our data are in perfect agreement with this finding because results of BPH and PCa PSA assays carried out by LC/MS/MS appear slightly overestimated and underestimated, respectively, compared with the ELISA test. Finally the loss of about 7% of PSA during sample processing (HSA immunodepletion and SPE fractionation) roughly compensates for the amount of PSA not detected by ELISA because of complexation with α2M.
DISCUSSION
Mass spectrometry-based evaluation of putative protein biomarkers is gaining credibility as an alternative to ELISA tests when no antibody is available. Recently Keshishian et al. (4) published outstanding data showing LOQ in the low ng/ml range by LC-MRM/MS experiments for many proteins spiked into depleted plasma (i.e. 2.2 ng/ml for PSA). The present work constitutes an important additional step toward the adoption of LC-MRM/MS for biomarker validation. Indeed a reliable quantitation of the PSA biomarker present in the nanogram/milliliter range was carried out for the first time in true clinical samples with good correlation with the ELISAs. Furthermore even on the limited panel of patients studied, the correlation curves between ELISA and LC-MRM/MS seem to enable discrimination between BPH and PCa patients. A study on a wider cohort may confirm this observation mainly in the 2.3–10 ng/ml concentration range where the possible discrimination between BPH and PCa would have a high diagnostic interest. This result shows that, provided the robustness and linearity of an MRM signal are carefully verified, quantitative assays may be configured based on a single transition.
Like the process developed by Keshishian et al. (4), our validated sample processing joined serum immunodepletion and SCX peptide fractionation steps. However, it is different in some essential aspects that need to be discussed. The first difference arises from the extent to which depletion of the most abundant protein in serum was driven. Indeed the risk of losing low abundance proteins during the immunodepletion step raises the question of the real interest of systematically removing a large set of highly abundant proteins from serum. In the case of PSA, for example, the depletion of serum protease inhibitors such as ACT, α1-antitrypsin, and α2M should be avoided because of the formation of complexes between PSA and these molecules. This feature is probably responsible for a part of the consequent loss of PSA observed by Keshishian et al. (4) because the IgY-12 column from Beckman Coulter removes α2-macroglobulin and α1-antitrypsin. Moreover nonspecific protein binding is frequently observed during affinity chromatography especially when polyclonal antibodies are used. In addition, autoantibodies to PSA have often been isolated in sera of patients with BPH (18) and PCa (19). As autoantibodies have been found to be frequently associated with numerous diseases, such as neoplasm (20), the depletion of immunoglobulins should also be considered with care. Such protein interactions could explain the non-negligible loss of targeted proteins observed by others during multiplexed depletions. It can therefore not be safely assumed that protein losses during drastic removal of the seven or 12 most abundant proteins from serum would be fully offset by the decrease of the matrix effect.
The second difference lies in the use of SPE cartridges for peptide fractionation instead of SCX separation by liquid chromatography. Applying a distinct cation exchange support might explain why, in contrast to Keshishian et al. (4) even after peptide fractionation, we did not notice any interference in the most intense 636.8/943.5 MRM channel of LSEPAELTDAVK peptide. Of course such a feature could not be anticipated because lower resolution is in theory expected from SPE cartridges compared with LC separation. In fact, the choice of SPE was driven by the ability to further increase the analysis throughput and robustness by performing peptide fractionation in a multiwell format of high charge capacity. Similar requirements governed the deliberate choice of mass spectrometry coupled with a conventional bore liquid chromatography instead of a nanoflow chromatography system. Of course, nanoflow chromatography is justifiably considered inescapable for the discovery of putative biomarkers when limited volumes of tissue sample are available. Entering into a validation phase, this constraint is generally overcome by the implementation of clinical protocols allowing the banking of milliliters of blood samples. Hundreds of microliters of sera are classically necessary for immunoassay validation, e.g. 200 μl for VIDAS TPSA. The use of 100 μl of sera for an LC-SRM/MS-based quantitation is therefore fully compatible with a validation phase. The higher robustness of conventional flow over nanoflow chromatography is also definitely a key advantage to transfer LC-MRM/MS assays to clinical facilities.
The present work also addresses the recurrent question about the best standardization method. Most of the recently published methods for absolute quantitation of proteins used the AQUA strategy (2) where one or many surrogate synthetic peptides labeled with stable isotopes are used as internal standard. However, some authors have noted some biases in the AQUA strategy. For instance, unpredictable adsorption of AQUA peptides may occur onto vial surfaces. More critically, the possible loss of targeted protein during the plasma depletion and the yield of trypsin digestion cannot be evaluated. To circumvent this limitation, the standard signature heavy peptides may be generated during the trypsin digestion step of a recombinant protein labeled during its expression. In the QCAT strategy proposed by Beynon and co-workers (21), an artificial gene encodes a protein consisting of concatenated tryptic peptide sequences. Recently Brun et al. (22) coined the PSAQ strategy with the use of isotope-labeled full-length proteins expressed in a cell-free system. PSAQ mimics the full native protein and offers undoubtedly the more convincing internal standard. PSAQ, and to a lesser extent QCAT, methods share the same advantage over the AQUA strategy in taking into account the yield of digestion. However, Brun et al. (22) found that although less pronounced than with the AQUA method (23) QCAT also led to underestimation of the target protein because of variability in trypsin digestion efficiency. AQUA, QCAT, or PSAQ strategies require that both 12C- and 13C-peptide MRM channels be rigorously evaluated toward the presence of interfering signals. In the present work, the good correlation between the ELISA tests and the mass spectrometry-based quantitation suggests that external interpolation with a calibration curve built from the targeted protein spiked into a blank serum is also an interesting alternative as only the specificity and robustness within the MRM channels of the 12C-peptide need evaluation.
Finally the question rises about the possible broader applicability of this work flow to other biomarker candidates. Basically the LOQ of a given protein will be governed by the intrinsic propensity to release proteotypic peptides showing high electrospray ionization yield and specific MRM signals. In fact, the work by Keshishian et al. (4) clearly demonstrates through the study of six protein models that there is a reasonable probability that any target proteins will provide one or more proteotypic peptides with LOQ near at least the low ng/ml range. As a consequence, we may argue that the most critical phase of the work flow design is the identification of those peptides and the optimization of their SPE fractionation. We have recently optimized the method for 15 putative biomarkers starting from a few milligrams of the recombinant target candidates. Taking into account the trypsin digestion step and vacuum drying of the SPE fraction, the complete sample processing runs over 2 days using a Biomek work station that automatically drives HSA immunodepletion and SPE fractionation. This optimized platform allowed the quantitation of biomarker candidates in 140 patients in triplicate analysis (420 injections) over a 4-week period.
CONCLUSION
The present work reports the reliable quantitation of a protein biomarker in the nanogram/milliliter range across true clinical samples by mass spectrometry without immunoenrichment of the targeted protein. The amounts of PSA determined by MS across the different patients were very closely correlated to those determined by a commercial ELISA test. This result shows that the conventional flow liquid chromatography is compatible with such expected low limit of quantitation as probably required for numerous other putative biomarkers. The volume of serum used during the optimized two-step sample processing, combining HSA depletion and SPE fractionation, was limited to 100 μl. It is therefore compatible with withdrawal of milliliters of blood during a clinical protocol. Such a robust work flow may be easily transferred to contract research organization facilities where the analysis throughput and good laboratory practice certification is essential for a relevant biomarker validation.
Acknowledgments
We thank Applied Biosystems for providing access to the 4000 QTRAP LC/MS/MS system and more precisely Jean-Baptiste Vincendet for active support and Christie L. Hunter for fruitful discussions. We also thank Drs. S. Busseret and J. Passagot for providing them with human samples and the teams of Drs. N. Battail-Poirot and J.-M. Dugua for providing them with the purified monoclonal antibody against HSA.
Footnotes
Published, MCP Papers in Press, December 8, 2008, DOI 10.1074/mcp.M800238-MCP200
The abbreviations used are: SRM, single reaction monitoring; MRM, multiple reaction monitoring; LOQ, limit of quantitation; SCX, strong cation exchange; PSA, prostate-specific antigen; SPE, solid phase extraction; BPH, benign prostate hyperplasia; PCa, prostate cancer; TPSA, total prostate-specific antigen; HSA, human serum albumin; ACT, α1-antichymotrypsin; α2M, α2-macroglobulin; MCX, mixed cation exchange; MIDAS, MRM-Initiated Detection and Sequencing; Fmoc, N-(9-fluorenyl)methoxycarbonyl; AQUA, absolute quantification; PSAQ, protein standard absolute quantification; HLB, hydrophilic lipophilic balance; QCAT, concatenation of tryptic peptides.
REFERENCES
- 1.Mallick, P., Schirle, M., Chen, S. S., Flory, M. R., Lee, H., Martin, D., Ranish, J., Raught, B., Schmitt, R., Werner, T., Kuster, B., and Aebersold, R. ( 2007) Computational prediction of proteotypic peptides for quantitative proteomics. Nat. Biotechnol. 25, 125–131 [DOI] [PubMed] [Google Scholar]
- 2.Gerber, S. A., Rush, J., Stemman, O., Kirschner, M. W., and Gygi, S. P. ( 2003) Absolute quantification of proteins and phosphoproteins from cell lysates by tandem MS. Proc. Natl. Acad. Sci. U. S. A. 100, 6940–6945 [DOI] [PMC free article] [PubMed] [Google Scholar]
- 3.Anderson, L., and Hunter, C. L. ( 2006) Quantitative mass spectrometric multiple reaction monitoring assays for major plasma proteins. Mol. Cell. Proteomics 5, 573–588 [DOI] [PubMed] [Google Scholar]
- 4.Keshishian, H., Addona, T., Burgess, M., Kuhn, E., and Carr, S. A. ( 2007) Quantitative, multiplexed assays for low abundance proteins in plasma by targeted mass spectrometry and stable isotope dilution. Mol. Cell. Proteomics 6, 2212–2229 [DOI] [PMC free article] [PubMed] [Google Scholar]
- 5.Kulasingam, V., Smith, C. R., Batruch, I., Buckler, A., Jeffery, D. A., and Diamandis, E. P. ( 2008) “Product ion monitoring” assay for prostate-specific antigen in serum using a linear ion-trap. J. Proteome Res. 7, 640–647 [DOI] [PubMed] [Google Scholar]
- 6.Lin, S., Shaler, T. A., and Becker, C. H. ( 2006) Quantification of intermediate-abundance proteins in serum by multiple reaction monitoring mass spectrometry in a single-quadrupole ion trap. Anal. Chem. 78, 5762–5767 [DOI] [PubMed] [Google Scholar]
- 7.Wu, S. L., Amato, H., Biringer, R., Choudhary, G., Shieh, P., and Hancock, W. S. ( 2002) Targeted proteomics of low-level proteins in human plasma by LC/MSn: using human growth hormone as a model system. J. Proteome Res. 1, 459–465 [DOI] [PubMed] [Google Scholar]
- 8.Oe, T., Ackermann, B. L., Inoue, K., Berna, M. J., Garner, C. O., Gelfanova, V., Dean, R. A., Siemers, E. R., Holtzman, D. M., Farlow, M. R., and Blair, I. A. ( 2006) Quantitative analysis of amyloid β peptides in cerebrospinal fluid of Alzheimer's disease patients by immunoaffinity purification and stable isotope dilution liquid chromatography/negative electrospray ionization tandem mass spectrometry. Rapid Commun. Mass Spectrom. 20, 3723–3735 [DOI] [PubMed] [Google Scholar]
- 9.Whiteaker, J. R., Zhao, L., Zhang, H. Y., Feng, L. C., Piening, B. D., Anderson, L., and Paulovich, A. G. ( 2007) Integrated pipeline for mass spectrometry-based discovery and confirmation of biomarkers demonstrated in a mouse model of breast cancer. Anal. Biochem. 362, 44–54 [DOI] [PubMed] [Google Scholar]
- 10.Rafferty, B., Rigsby, P., Rose, M., Stamey, T., and Gaines Das, R. ( 2000) Reference reagents for prostate-specific antigen (PSA): establishment of the first international standards for free PSA and PSA (90:10). Clin. Chem. 46, 1310–1317 [PubMed] [Google Scholar]
- 11.Barnidge, D. R., Goodmanson, M. K., Klee, G. G., and Muddiman, D. C. J. ( 2004) Absolute quantification of the model biomarker prostate-specific antigen in serum by LC-MS/MS using protein cleavage and isotope dilution mass spectrometry. J. Proteome Res., 3, 644–652 [DOI] [PubMed] [Google Scholar]
- 12.Steel, L. F., Trotter, M. G., Nakajima, P. B., Mattu, T. S., Gonye, G., and Block, T. ( 2003) Efficient and specific removal of albumin from human serum samples. Mol. Cell. Proteomics 2, 262–270 [DOI] [PubMed] [Google Scholar]
- 13.Granger, J., Siddiqui, J., Copeland, S., and Remick, D. ( 2005) Albumin depletion of human plasma also removes low abundance proteins including the cytokines. Proteomics 5, 4713–4718 [DOI] [PubMed] [Google Scholar]
- 14.Semjonow, A., Brandt, B., Oberpenning, F., Roth, S., and Hertle, L. ( 1996) Discordance of assay methods creates pitfalls for the interpretation of prostate-specific antigen values. Prostate Suppl. 7, 3–16 [PubMed] [Google Scholar]
- 15.McCormack, R. T., Rittenhouse, H. G., Finlay, J. A., Sokoloff, R. L., Wang, T. J., Wolfert, R. L., Lilja, H., and Oesterling, J. E. ( 1995) Molecular forms of prostate-specific antigen and the human kallikrein gene family: a new era. Urology 45, 729–744 [DOI] [PubMed] [Google Scholar]
- 16.Prestigiacomo, A. F., and Stamey, T. A. ( 1995) Clinical usefulness of free and complexed PSA. Scand. J. Clin. Lab. Investig. Suppl. 221, 32–34 [DOI] [PubMed] [Google Scholar]
- 17.Zhang, W. M., Finne, P., Leinonen, J., Vesalainen, S., Nordling, S., Rannikko, S., and Stenman, U. H. ( 1998) Characterization and immunological determination of the complex between prostate-specific antigen and α2-macroglobulin. Clin Chem. 44, 2471–2479 [PubMed] [Google Scholar]
- 18.Zisman, A., Zisman, E., Lindner, A., Velikanov, S., Siegel, Y. I., and Mozes, E. ( 1995) Autoantibodies to prostate specific antigen in patients with benign prostatic hyperplasia. J. Urol. 154, 1052–1052 [PubMed] [Google Scholar]
- 19.McNeel, D. G., Nguyen, L. D., Storer, B. E., Vessella, R., Lange, P. H., and Disis, M. L. ( 2000) Antibody immunity to prostate cancer associated antigens can be detected in the serum of patients with prostate cancer. J. Urol. 164, 1825–1829 [PubMed] [Google Scholar]
- 20.Tomer, Y., and Schoenfeld, Y. ( 2000) in Cancer and Autoimmunity (Schonfeld, Y., and Gershwin, M. E., eds) pp. 141–150, Elsevier, Amsterdam
- 21.Pratt, J. M., Simpson, D. M., Doherty, M. K., Rivers, J., Gaskell, S. J., and Beynon, R. J. ( 2006) Multiplexed absolute quantification for proteomics using concatenated signature peptides encoded by QconCAT genes. Nat. Protoc. 1, 1029–1043 [DOI] [PubMed] [Google Scholar]
- 22.Brun, V., Dupuis, A., Adrait, A., Marcellin, M., Thomas, D., Court, M., Vandenesch, F., and Garin, J. ( 2007) Isotope-labeled protein standards: toward absolute quantitative proteomics. Mol. Cell. Proteomics 6, 2139–2149 [DOI] [PubMed] [Google Scholar]
- 23.Kuhn, E., Wu, J., Karl, J., Liao, H., Zolg, W., and Guild, B. ( 2004) Quantification of C-reactive protein in the serum of patients with rheumatoid arthritis using multiple reaction monitoring mass spectrometry and 13C-labeled peptide standards. Proteomics 4, 1175–1186 [DOI] [PubMed] [Google Scholar]