

Abstract
There is evidence concerning the neural and genetic correlates of inhibitory control, but there have been limited attempts to combine this information. This study tested the hypothesis that two dopaminergic polymorphisms, SLC6A3 and COMT, influence neural activation during response inhibition. Healthy adults were genotyped for these polymorphisms and performed a measure of response inhibition while undergoing functional magnetic resonance imaging (fMRI). Results support the role of key frontostriatal regions underlying response inhibition. Furthermore, results support a significant influence of SLC6A3 and COMT variants on neural activity during inhibition, with greater activation during inhibition in carriers of the SLC6A3 9-allele or the COMT met-allele as compared to carriers of the SLC6A3 10/10 genotype or the COMT val/val genotype. These results add to a growing literature suggesting that inhibitory control is sensitive to variation in dopamine function, and suggest that this variation may be detectable at the level of individuals’ genotypes.
Keywords: Impulsivity, Response Inhibition, Intermediate Phenotype, Dopamine, Stop-signal, Polymorphism
Introduction
There is increasing evidence for the biological correlates of response inhibition. One line of research from neuroimaging studies illustrates that activation within a frontostriatal brain network underlies response inhibition; another line highlights the role of the dopamine system in influencing inhibitory control (for a review, see Congdon, & Canli, 2005). However, these studies have been largely conducted independent of each other. Furthermore, previous studies are limited by 1) an overreliance on heterogeneous, DSM-defined groups; and 2) an overreliance on self-report measures of trait impulsivity or related higher-order personality traits (Bearden & Freimer, 2006; Gottesman & Gould, 2003; Hariri & Weinberger, 2003). Therefore, we currently have a limited understanding of the neurogenetic correlates of response inhibition.
The present study was designed to overcome these limitations by applying an intermediate phenotype approach to response inhibition (Bearden & Freimer, 2006; Hariri & Weinberger, 2003). We proposed that dopamine system-related gene polymorphisms have a functional role in modulating the network underlying response inhibition. Specifically, we tested the influence of SLC6A3 and COMT genotypes on frontostriatal activation as assessed with fMRI, in a sample of healthy adults performing a Stop-signal task.
Many neuroimaging studies of response inhibition investigating the brain regions underlying the suppression of a prepotent motor response have outlined a right-lateralized frontostriatal circuit (Aron, Behrens, Smith, Frank, & Poldrack, 2007; Aron & Poldrack, 2006; Garavan, Ross, & Stein, 1999; Li, Huang, Constable, & Sinha, 2006; Li, Yan, Sinha, & Lee, 2008; Rubia, et al., 2001; Zheng, Oka, Bokura, & Yamaguchi, 2008). These studies provide strong evidence for the role of this frontostriatal network (primarily the right inferior frontal cortex (IFC), pre-supplementary motor area (preSMA), and subthalamic nucleus (STN) of the basal ganglia) underlying the suppression of a prepotent motor response (Aron, & Poldrack, 2006; Aron, et al., 2007). The IFC plays a central role in initiating response inhibition (Aron, Robbins, & Poldrack, 2004; Buchsbaum, Greer, Chang, & Berman, 2005; Chambers, et al., 2006; Rieger, Gauggel, & Burmeister, 2003), and the STN plays a central role in the stopping of ongoing motor response (via the globus pallidus (GP)) (Frank, 2006). Although there is consistent evidence implicating this frontostriatal network in response inhibition, there is also evidence for considerable variability of activation within healthy adults (Aron, & Poldrack, 2006; Garavan, Ross, Murphy, Roche, & Stein, 2002; Horn, Dolan, Elliott, Deakin, & Woodruff, 2003; Valdes, et al., 2006). In particular, there are reports of negative correlations between Stop-signal reaction time (SSRT) and activation in these regions (Aron, & Poldrack, 2006; Aron, et al., 2007; Li, et al., 2006), suggesting that better inhibitory control is associated with increased activation when suppression of a motor response is required.
Variability in neural activation during inhibitory control may be explained by variation in dopaminergic modulation of this network. Dopamine, or monoamines in general, have been shown to suppress spontaneous background neuronal firing while enhancing task-specific firing (Foote, Freedman, & Oliver, 1975) and thus vary the signal-to-noise ratio. Furthermore, there is an optimal range of dopamine stimulation, largely D1 receptor stimulation in the prefrontal cortex, for the performance of functions in which it is involved (Williams & Goldman-Rakic, 1995). In this way, it is said that there is an inverted U-shaped response function of dopamine, such that too little or too much dopamine is disruptive and impairs the functioning of the system (Arnsten & Goldman-Rakic, 1998; Bilder, Volavka, Lachman, & Grace, 2004).
Within the dopaminergic system, there are two particular polymorphisms in dopamine system-related genes, SLC6A3 and COMT, which may alter the response function of dopamine and, in turn, activation underlying response inhibition (see Table 1). SLC6A3 (OMIM: 126455) refers to a polymorphism that is located within the gene coding for the dopamine transporter (DAT), which is responsible for removing dopamine from the synapse (Bannon, Michelhaugh, Wang, & Sacchetti, 2001). The polymorphism results in a variable number of repeat units, with evidence supporting increased DAT expression associated with the 10-repeat, compared to 9-repeat, allele (Brookes, et al., 2007; Fuke, et al., 2001; Heinz, et al., 2000; Mill, et al., 2002; VanNess, Owens, & Kilts, 2005). The second polymorphism may alter the response function of dopamine through differential levels of degradation of dopamine. A single nucleotide polymorphism (SNP) is located within the gene that codes for the COMT enzyme (COMT, OMIM: 116790), which degrades dopamine, and results in the substitution of the amino acid methionine (met) for valine (val), with the met enzyme having one third to one half of the activity of the val enzyme (Lotta, et al., 1995).
Table 1.
Two dopamine (DA) system-related genes with functional polymorphisms
| Candidate | Protein Function | Gene | Polymorphism | Functional Significance |
|---|---|---|---|---|
| Dopamine Transporter | Plasma membrane transport protein; reuptake of DA | SLC6A3 (DAT1 or DAT) | VNTR; 40-bp repeat; 3–13 times | Noncoding region; affects mRNA transcription; 10 variant has increased expression |
| COMT | Enzyme degrades catecholamines | COMT(COMTval108/158met) | G to A mutation | Methionine substituted for valine at codon 158; val variant has increased activity |
Note. VNTR, variable number of tandem repeats polymorphism; bp, base-pair; 3′-UTR, 3′-untranslated region; mRNA, messenger RNA
Both SLC6A3 and COMT have previously been associated with inhibitory control. In addition to evidence for a small but significant relationship between SLC6A3 and diagnosis of ADHD (Faraone, et al., 2005; Yang, Chan, Jing, Li, Sham, & Chen, 2007), the 10-repeat allele has been associated with inhibitory control and impulsivity (Bellgrove, Hawi, Kirley, Fitzgerald, et al., 2005; Bellgrove, Hawi, Kirley, Gill, & Robertson, 2005; Congdon, Lesch, & Canli, 2008; Gilbert, et al., 2006; Kirley, et al., 2003; Loo, et al., 2003; Waldman, et al., 1998). The COMT polymorphism has been associated with differences in executive functioning (Bruder, et al., 2005; Diamond, Briand, Fossella, & Gehlbach, 2004; Egan, et al., 2001; Fossella, et al., 2002; Malhotra, et al., 2002; Rosa, et al., 2004), in particular inhibitory control and conflict (Kramer, et al., 2007; Nolan, Bilder, Lachman, & Volavka, 2004). Both polymorphisms have also been associated with differences in neural activation. There are reports of differences in brain volume and activation as a function of SLC6A3 and a polymorphism in the dopamine D4 receptor gene (DRD4) in ADHD boys and their siblings (Durston, et al., 2005; Durston, et al., 2008; Szobot, et al., 2005), and reports of differences in prefrontal activation as a function of COMT genotype in healthy adults (Mattay, et al., 2003; Smolka, et al., 2005; Tan, et al., 2007). Although there is not yet a published report of the influence of both genotypes on response inhibition in a single sample, there are reports of an interaction between them on neural activation during other paradigms (Bertolino, Blasi, et al., 2006; Bertolino, et al., 2009; Caldu, et al., 2007; Schott, et al., 2006; Yacubian, et al., 2007).
Although there are a number of genes that likely influence inhibitory control (including genes important in dopaminergic, serotonergic, and noradrenergic neurotransmission), the present study focused specifically on SLC6A3 and COMT because the SLC6A3 (Brown, Manuck, Flory, & Hariri, 2006) and COMT (Chen, et al., 2004; Lotta, et al., 1995; Mannisto & Kaakkola, 1999) polymorphisms are predicted to directly affect dopaminergic neurotransmission and, in turn, processes underlying inhibitory control. We have previously published evidence for an interaction between SLC6A3 and DRD4 in influencing response inhibition, specifically SSRT (Congdon, Lesch, & Canli, 2008), however the current investigation focused only on SLC6A3 and COMTi based on 1) their differential distribution across the brain regions implicated in response inhibition; and 2) previous reports showing a clear influence of SLC6A3 and COMT on neural activation during related tasks. We therefore proposed that dopamine system-related gene polymorphisms have a functional role in modulating the network underlying response inhibition. Specifically, we predicted to see greater activation in regions underlying response inhibition in those individuals with optimal levels of dopamine availability (carriers of the SLC6A3 9-allele or the COMT met-allele) as compared to those individuals with predicted reduced levels of dopamine availability (carriers of the SLC6A3 10/10 genotype or the COMT val/val genotype), based on previous reports of greater activation in key brain regions underlying response inhibition in those individuals with better inhibition.
Methods
Participants
All participants were recruited from the New Haven area through postings and advertisements. Exclusion criteria included the following: history of psychopathology, counter-indications for MRI; any mood-altering medication; children under 18; adults over 30; history of severe head trauma, left-handedness. Participants completed three screens to ensure a sample of healthy participants: the K-6 (for mood and anxiety disorders) (Furukawa, Kessler, Slade, & Andrews, 2003; Kessler, et al., 2002; Kessler, et al., 2003); the Iowa Personality Disorder Screen (for personality disorders) (Langbehn, et al., 1999); and the ADHD Self-Report Scale (for ADHD symptoms in adults) (Kessler, et al., 2005; Kessler, et al., 2006).
Forty-three participants were included in the final analyses (mean age 22.72 years (SEM = 0.50), range 18–30; 25 females), after twelve individuals were excluded for failing to perform the task as instructed and/or due to excessive head motion (exceeding 3 mm in any direction) in the scanner. All participants gave informed consent according to procedures approved by the Yale University School of Medicine Institutional Review Board.
Genotyping
DNA samples were collected with cheek cell swabs (Epicentre Biotechnologies MasterAmp™ Buccal Swab Kits, Madison, WI). The genotypes for SLC6A3 and COMT were obtained following previously published protocols (Egan, et al., 2001; Hunnerkopf, Strobel, Gutknecht, Brocke, & Lesch, 2007). Briefly, for SLC6A3, the polymorphic region was amplified by polymerase chain reaction (PCR) with oligonucleotide primers: forward-5′TGTGGTGTAGGGAACGGCCTGAG3′; reverse-5′CTTCCTGGAGGTCACGGCTCAAGG3′. PCR conditions were as follows: initial denaturation at 95° C for 3 minutes, followed by 38 cycles of 45 seconds at 95° C, 45 seconds at 67.5° C, 45 seconds at 72°, and final extension at 72° C for 3 minutes. For COMT, the polymorphic region was amplified by PCR with the oligonucleotide primers: forward-5′ GGGGCCTACTGTGGCTACTC3′; reverse-5′ TTTTTCCAGGTCTGACAACG3′. PCR conditions were as follows: initial denaturation at 94° C for 5 minutes, followed by 35 cycles of 45 seconds at 94°C, 45 seconds at 58.4°C, 45 seconds at 72°C, and final extension at 72°C for 5 minutes. The amplified fragment was incubated with the restriction enzyme NlaIII (New England Biolabs, Ipswich, MA). The resulting products for SLC6A3 and COMT were separated on agarose gels containing ethidium bromide and bands were visualized under UV light.
fMRI Task
This study included a rapid event-related design in which participants performed a Stop-signal task (Aron, & Poldrack, 2006; Rubia, Smith, Brammer, & Taylor, 2003), which is designed to measure a race between go and stop processes, allowing for the computation of an individual’s inhibitory function (Logan, 1994). Participants viewed black arrows on an off-white background pointing either to the left or right for 500 ms each in a random order at jittered rates, followed by a 1500 ms fixation point (black plus sign). Trials were separated by a variable inter-trial interval of 500–4000 milliseconds (average 1750 milliseconds) of a bold fixation cross, indicating that the next trial was about to begin. Participants pressed a right or left button with their right hand in response to a right- or leftwards pointing arrow, respectively. On a subset (25%) of trials (144 total), a right- or leftwards pointing arrow was replaced by an upwards pointing arrow (the stop-signal)(Rubia, et al., 2003). Subjects were instructed to inhibit responses on trials in which the stop-signal appears. Subjects were instructed that correctly responding and inhibiting were equally important, but were encouraged to maintain speed throughout the task (which is standard for this task).
The task tracks each subject’s responses on inhibition trials and modifies the timing parameters on subsequent inhibition trials accordingly, thereby ensuring 50% of inhibition trials and individualized difficulty level across subjects. The onset of the stop-signal on the first inhibition trial was 250 ms, but the delay between onset of a go stimulus and onset of a stop-signal (stop signal delay, SSD) increased or decreased by 50 ms on each successive trial, depending on performance on the previous inhibition trial. Stop-signal reaction time (SSRT) was estimated by subtracting the average SSD (at which the participant successfully inhibits closest to 50% of the time) from the average reaction time on Go trials (Band, van der Molen, & Logan, 2003).
Image Acquisition and Analysis
fMRI data were obtained using a Siemens 3T Trio scanner at the Yale Magnetic Resonance Research Center. Each fMRI session began with a 3-plane localizer (20 seconds) to localize the brain within the scanner. Sagittal localizer was an inversion recovery T1-weighted scan (TI/TE/TR = 800/11/1800, 256×192×2nex), 3mm thick, skip 0.5mm, FOV=22cm, 16 slices. This acquisition is used to define the ac-pc line for prescription of the anatomic T1 and functional images in the following series. Functional whole-brain images were acquired using a gradient echo T2*-weighted echoplanar imaging (EPI) scan using an axial-oblique orientation and a flip angle of 80°, repetition time (TR) = 1.5 s, echo time (TE) = 35 ms, 24 slices, 5 mm thick with no gap, and a field of view (FOV) = 22 × 22 cm. For each task session, 374 scans were collected, including twelve dummy scans at the beginning (in order to allow time for magnetic saturation) and two dummy scans at the end.
Imaging preprocessing
Individual fMRI data were preprocessed using a standard protocol (Canli, Congdon, Gutknecht, Constable, & Lesch, 2005; Canli, Omura, et al., 2005; Omura, Constable, & Canli, 2005) with SPM2 (Statistical Parametric Mapping, The Wellcome Department of Imaging Neuroscience, Institute of Neurology, University College London, UK) running on MATLAB 6.5 (MathWorks, Natick, MA). For each scan, images for each participant were corrected for slice timing and realigned to the first volume in the time series, spatially normalized into a standard stereotaxic space (Montreal Neurological Institute template), and smoothed with an 8 mm full width-half maximum isotropic Gaussian filter. For those participants included in the final analyses, movement parameters never exceeded 3 mm in any direction for any participant or scan.
Fixed-effects models (Friston, 1994) were used at the individual subject levels of analysis to calculate the contrast images between inhibition and response trials, and random effects models (Holmes & Friston, 1998) were used for group-level analyses. Four events were modeled after convolution with a canonical hemodynamic response function: Fixation, Go, StopInhibit, and StopRespond. Note that all Go, StopInhibit, and StopRespond trials included only trials in which the participant correctly responded, did not respond, or failed to inhibit a response, respectively. Six movement parameters were included as regressors to control for additional movement throughout the scan. Second-level contrasts were created for the entire group using each participant’s contrast images, and these contrasts were analyzed with random effects analyses in SPM2 using one-sample t-tests. The search region included 137,514 voxels.
Statistical analyses
Second-level contrasts were analyzed with random effects analyses (Holmes & Friston, 1998) in SPM2 using one-sample t-tests. Analyses were conducted using anatomically-defined regions of interest (ROI), which were defined using the automated anatomical labeling (aal) atlas of the WFU PickAtlas Tool (v1.04) in SPM2 (Tzourio-Mazoyer, et al., 2002). ROI analyses included four ROIs: 1) the right IFC, which included the pars opercularis, pars triangularis, and pars orbitalis; 2) the right STN, which was defined using Marsbar (MarsBaR AAL ROI package, version 0.1) (Tzourio-Mazoyer, et al., 2002) and consisted of a 10 × 10 × 10 mm sized box, centered at MNI coordinates 10, −15, −5; 3) the pre-SMA (where y > 0); and 4) the right globus pallidus. For ROI analyses, since analyses were limited to only four regions and based on strong a priori hypotheses, images were thresholded at p < 0.01 uncorrected voxel level, and activation was regarded as significant and reported if it survived p < 0.05 small volume correction.
To assess the effect of genotype, we used a multiple regression model with two regressors, SLC6A3 and COMT genotype groups (dummy-coded), allowing for the assessment of the contribution of each genotype to activation, while controlling for the contribution of the other genotype in the Go—Fixation, StopInhibit—Fixation, and StopInhibit—Go contrasts. For further analyses, percent signal change was calculated from the ROIs (Mumford & Poldrack, 2007). Activation in anatomical regions was confirmed using the SPM2 Anatomy toolbox, which combines probabilistic cytoarchitectonic maps with one’s functional imaging data (Eickhoff, et al., 2005) and manual inspection using the Duvernoy atlas. All coordinates reported here represent Montreal Neurological Institute (MNI) space.
Results
Allele and Genotype Frequencies
Each participant was genotyped for both SLC6A3 and COMT; SLC6A3 genotype was unavailable in one participant. In the final sample, for SLC6A3 (N = 42), participants were divided into those with two copies of the 10-repeat allele (10/10) (N = 26) and those with at least one 9-repeat allele (9+) (N = 16), given that the 9- and 10-repeat alleles are the most common, and the only ones observed in our sample (Heinz, et al., 2000; Jacobsen, et al., 2000; Mill, Asherson, Browes, D’Souza, & Craig, 2002; van Dyck, et al., 2005). For COMT (N = 43), participants were divided into three groups: met/met (N = 6), val/met (N = 27), and val/val (N = 10) because the two alleles are co-dominant (Lotta, et al., 1995). For both genotype groups, there was no difference between genotype groups in age, sex, ethnicity, and education (see Table 2)ii. The genotype frequencies of both SLC6A3 and COMT did not deviate from Hardy-Weinberg equilibrium (all p-values > 0.05).
Table 2.
Sample- and genotype-specific demographics
| Genotype | Group | Sex | N | Ethnicity |
Mean age +/− SEM | ||||
|---|---|---|---|---|---|---|---|---|---|
| AA | AS | CS | LA | OT | |||||
| SLC6A3 | Total | 42 | 22.64 (0.51) | ||||||
| 10/10 | 26 | 23.16 (0.70) | |||||||
| Male | 11 | 2 | 1 | 7 | 0 | 1 | 22.45 (1.06) | ||
| Female | 15 | 0 | 5 | 8 | 1 | 1 | 23.60 (0.94) | ||
| 9+ | 16 | 21.85 (0.70) | |||||||
| Male | 6 | 0 | 0 | 5 | 0 | 0 | 21.83 (1.14) | ||
| Female | 10 | 0 | 2 | 6 | 1 | 1 | 21.90 (0.92) | ||
| COMT | Total | 43 | 22.72 (0.50) | ||||||
| val/val | 10 | 22.80 (0.94) | |||||||
| Male | 4 | 1 | 1 | 2 | 0 | 0 | 21.75 (1.11) | ||
| Female | 6 | 0 | 1 | 3 | 1 | 1 | 23.50 (1.38) | ||
| val/met | 27 | 22.96 (0.68) | |||||||
| Male | 12 | 1 | 0 | 10 | 0 | 1 | 22.42 (1.08) | ||
| Female | 15 | 0 | 4 | 9 | 1 | 1 | 23.40 (0.91) | ||
| met/met | 6 | 21.50 (1.03) | |||||||
| Male | 2 | 0 | 0 | 2 | 0 | 0 | 24.00 (1.00) | ||
| Female | 4 | 0 | 2 | 2 | 0 | 0 | 20.25 (0.95) | ||
|
| |||||||||
| Genotype | Group | N | COMT |
||||||
| val/val | val/met | met/met | |||||||
|
| |||||||||
| SLC6A3 | 10/10 | 6 | 16 | 4 | |||||
| 9+ | 4 | 10 | 2 | ||||||
Note. There were no significant differences in age, sex, ethnicity, or education between any of the genotype groups. AA, African-American; AS, Asian; CS, Caucasian; LA, Latino/Hispanic; OT, Self-Identified as Other. N = 42 for DAT; N = 43 for COMT.
Behavioral Results
Inspection of the results revealed that the task worked correctly. The group (N = 43) mean SSRT was 209.85 (SEM = 6.10), ranging from 140.05 to 291.73 (in ms) and the group mean percent inhibition was close to 50% (Mean = 51.94; SEM = 0.82; Range = 45.37–69.44). Mean SSRT in groups divided according to SLC6A3 was as follows: 204.83 ms (SEM = 7.48) for the 10/10 group, and 222.17 ms (SEM = 9.87) for the 9+ group. Mean SSRT in groups divided according to COMT was as follows: 202.73 ms (SEM = 10.69) for the val/val group, 214.20 ms (7.84 SEM) for the val/met group, and 213.97 ms (SEM = 19.54) for the met/met group. There were no significant independent effects of SLC6A3 or COMT genotypes on SSRT (all p-values > 0.05).
fMRI Results
ROI Analyses: StopInhibit—Go
ROI analyses conducted on the StopInhibit—Go contrast confirmed the predicted greater activation in the right IFC, STN, pre-SMA, and GP during successful stopping as compared to going, even at p < 0.05 small volume correction: IFG (x 36, y 22, z −8, t = 8.95, k = 2388, p = 0.000); STN (x 8, y −12, z −4, t = 3.31, k = 21, p = 0.020); pre-SMA (x 12, y 16, z 58, t = 5.63, k = 520, p = 0.002); and GP (x 16, y 4, z 0, t = 4.57, k = 21, p = 0.025).
Effect of Genotype on Stopping Activation
To assess the effect of genotype, we regressed SLC6A3 and COMT genotype groups on activation during contrasts of interest in our fMRI model, allowing for the assessment of the contribution of each genotype to activation, while controlling for the contribution of the other genotype. Regressing SLC6A3 and COMT genotypes on activation during contrasts of interest revealed significant effects in the ROIs for each genotype independently (see Table 3). For StopInhibit—Go, there was a significant influence of SLC6A3 genotype in activation in the right STN and SMA/pre-SMA after small volume correction. Examination of percent signal change between SLC6A3 groups revealed greater activation in the 9+ group than in the 10/10 group in all ROIs (see Table 4 and Figure 1)iii.
Table 3.
Influence of SLC6A3 and COMT genotypes on neural activation in regions of interest during inhibition
| MNI coordinates |
||||||||
|---|---|---|---|---|---|---|---|---|
| Region | Side | x | y | z | t | Pcorr | voxels | |
| Genotype | Contrast | |||||||
| SLC6A3 | StopInhibit—Go | |||||||
|
|
||||||||
| STN | R | 10 | −12 | −8 | 2.86 | 0.031 | 6 | |
| SMA | R | 8 | −20 | 72 | 4.46 | 0.003 | 450 | |
|
| ||||||||
| COMT | StopInhibit—Go | |||||||
|
|
||||||||
| IFG (pars opercularis) | R | 56 | 14 | 26 | 4.34 | 0.000 | 781 | |
|
| ||||||||
| COMT | Go—Fixation | |||||||
|
|
||||||||
| IFG (pars opercularis) | R | 48 | 10 | 0 | 5.17 | 0.000 | 977 | |
| STN | R | 12 | −10 | −2 | 4.18 | 0.020 | 23 | |
| Pre-SMA | R | 4 | 6 | 48 | 6.88 | 0.000 | 1,315 | |
| Globus pallidus | R | 16 | 4 | −2 | 2.93 | 0.026 | 18 | |
|
| ||||||||
| COMT | StopInhibit—Fixation | |||||||
|
|
||||||||
| IFG (pars opercularis) | R | 38 | 8 | 14 | 5.08 | 0.000 | 1,783 | |
| STN | R | 12 | −16 | −4 | 3.93 | 0.019 | 23 | |
| Pre-SMA | R | 8 | 6 | 46 | 6.51 | 0.000 | 1,297 | |
| Globus pallidus | R | 16 | 4 | −2 | 4.69 | 0.025 | 21 | |
Note. Region of interest analyses surviving a p < 0.05 small-volume correction. x, y, and z coordinates are shown in MNI space. MNI, Montreal Neurological Institute; Pcorr, corrected cluster-level p-value; IFG, inferior frontal gyrus; STN, subthalamic nucleus; SMA, supplementary motor area; R, right; N =42.
Table 4.
Genotype group differences in neural activation during inhibition
| Genotype | Contrast | Group (N) | ||
|---|---|---|---|---|
| Region | Mean Percent Signal Change (SEM) | |||
| SLC6A3 | StopInhibit—Go | 10/10 (26) | 9+ (16) | |
| IFG | 0.064 (0.014) | 0.074 (0.016) | ||
| STN | 0.021 (0.012) | 0.057 (0.020) | ||
| SMA | 0.004 (0.011) | 0.043 (0.012) | ||
| GP | 0.047 (0.015) | 0.082 (0.028) | ||
|
| ||||
| COMT | StopInhibit—Go | v/v (10) | v/m (26) | m/m (6) |
| IFG | 0.073 (0.026) | 0.074 (0.011) | 0.034 (0.033) | |
| STN | 0.034 (0.025) | 0.044 (0.014) | -0.002 (0.021) | |
| SMA | 0.027 (0.015) | 0.022 (0.012) | -0.007 (0.021) | |
| GP | 0.057 (0.00) | 0.063 (0.000) | 0.054 (0.000) | |
|
| ||||
| COMT | Go—Fixation | v/v (10) | v/m (26) | m/m (6) |
| IFG | -0.021 (0.043) | 0.044 (0.016) | 0.061 (0.053) | |
| STN | 0.025 (0.035) | 0.042 (0.017) | 0.074 (0.032) | |
| SMA | 0.049 (0.039) | 0.110 (0.015) | 0.102 (0.017) | |
| GP | 0.002 (0.052) | 0.058 (0.020) | 0.096 (0.033) | |
|
| ||||
| COMT | StopInhibit—Fixation | v/v (10) | v/m (26) | m/m (6) |
| IFG | 0.052 (0.029) | 0.118 (0.016) | 0.094 (0.085) | |
| STN | 0.059 (0.031) | 0.086 (0.020) | 0.072 (0.042) | |
| SMA | 0.076 (0.033) | 0.132 (0.016) | 0.095 (0.035) | |
| GP | 0.059 (0.036) | 0.121 (0.022) | 0.149 (0.044) | |
Note. Region of interest analyses thresholded at p < 0.01 uncorrected voxel level and percent signal change extracted. IFG, inferior frontal gyrus; STN, subthalamic nucleus; SMA, supplementary motor area; GP, globus pallidus; N =42.
Figure 1. Mean signal in the right subthalamic nucleus (STN) and right pre-supplementary motor area (SMA) on StopInhibit—Go trials as a function of SLC6A3 genotype.

(a) Activation in right STN overlaid on a coronal section (y = −14). (b) Mean signal in right STN during inhibition in SLC6A3 10/10 and 9+ groups. (c) Activation in right pre-SMA overlaid on a coronal section (y = −20). (d) Mean signal in right pre-SMA during inhibition in SLC6A3 10/10 and 9+ groups. Activation maps are thresholded at p < 0.01 uncorrected voxel level.
For StopInhibit—Go, there was a significant influence of COMT genotype on the right IFC after small volume correction (x 40, y 28, z −2, t = 4.33, k = 669, p = 0.001). Inspection of percent signal change between groups revealed an inconsistent pattern across the ROIs with the range of percent signal change differing widely between groups. Therefore, two additional regressions were conducted: one on Go—Fixation and a second on StopInhibit—Fixation. Analyses were limited to the ROIs for both of these contrasts. For both the Go—Fixation and StopInhibit—Fixation contrasts, there was a significant influence of COMT genotype on all four ROIs, and activation in each of these regions survived a small volume correction (see Table 3). Examination of percent signal change between COMT groups revealed greater activation in groups with one or both met-alleles as compared to the val/val group in all ROIs (see Table 4; Figures 2 and 3).
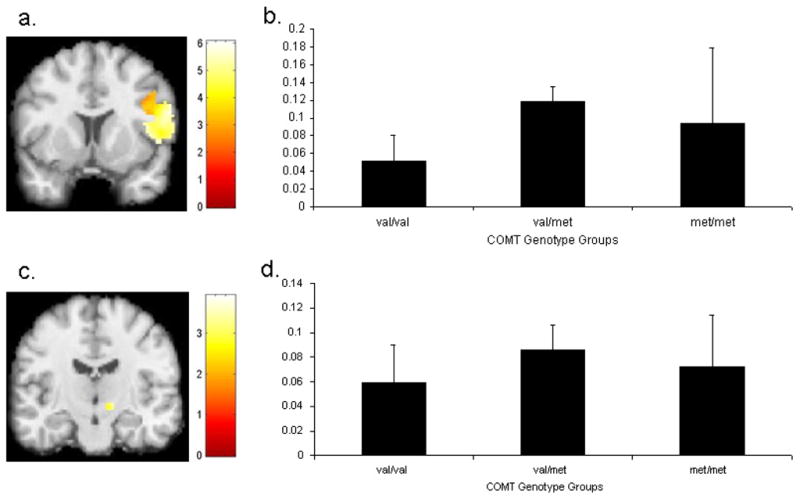
Figure 2. Mean signal in the right inferior frontal gyrus (IFG) and right subthalamic nucleus (STN) on Go—Fixation trials as a function of COMT genotype.

(a) Activation in right IFG overlaid on a coronal section (y = 10). (b) Mean signal in right IFG during responding in COMT val/val, val/met, and met/met groups. (c) Activation in right STN overlaid on a coronal section (y = −14). (d) Mean signal in right STN during responding in COMT val/val, val/met, and met/met groups. Activation maps are thresholded at p < 0.01 uncorrected voxel level.
Figure 3. Mean signal in the right inferior frontal gyrus (IFG) and right subthalamic nucleus (STN) on StopInhibit—Fixation trials as a function of COMT genotype.
(a) Activation in right IFG overlaid on a coronal section (y = 10). (b) Mean signal in right IFG during inhibition in COMT val/val, val/met, and met/met groups. (c) Activation in right STN overlaid on a coronal section (y = −14). (d) Mean signal in right STN during inhibition in COMT val/val, val/met, and met/met groups. Activation maps are thresholded at p < 0.01 uncorrected voxel level.
Discussion
The Neurogenetic Correlates of Behavioral Inhibition
The results of the present study support significant differences in neural activation during performance of a Stop-signal task as a function of SLC6A3 and COMT genotypes. These findings show that genetically driven variability in dopamine function in frontostriatal regions is associated with individual differences in this form of inhibitory control. The results of the present study are in line with other studies showing increased activation in SLC6A3 9-repeat allele or COMT met-allele carriers (Bertolino, Rubino, et al., 2006; Caldu, et al., 2007; Yacubian, et al., 2007). However, this is the first study to demonstrate such differences as a function of SLC6A3 and COMT genotypes using the Stop-signal task. Beyond that, this study is novel in its attempt to overcome many of the limitations associated with 1) previous fMRI studies of response inhibition and 2) previous association studies testing for the influence of dopaminergic variation on inhibitory control. By carefully parsing the construct of interest to focus on response inhibition, by combining models of frontostriatal and dopaminergic function, and by increasing power by using an imaging genetics approach, we were able to make clear predictions about, and provide evidence for, the influence of dopaminergic variation on neural activation underlying response inhibition.
Our first aim was to examine the activation in four ROIs during performance of the Stop-signal task, which requires participants to alternate between responding and suppressing a response that has already been initiated. Significant activation during inhibition was seen in the right IFC, STN, pre-SMA, and GP, consistent with previous reports (Aron, & Poldrack, 2006; Aron, et al., 2007; Garavan, Ross, & Stein, 1999; Li, et al., 2006; Li, et al., 2008; Rubia, et al., 2001; Zheng, et al., 2008). Several fMRI studies of the Stop-signal task have also demonstrated that greater activation represents better inhibitory control (Aron, & Poldrack, 2006; Aron, et al., 2007; Li, et al., 2006). This is supported by our own data, as well, as percent signal change in the right IFC was significantly negatively correlated with SSRT (r = −0.425, p < 0.05) (although only for the StopInhibit—Fixation, and not for StopInhibit—Go, contrast). Combined these data demonstrate that better inhibitory control in this task is associated with greater activation in a key brain region underlying successful inhibition.
Our second aim was to test the influence of dopaminergic genetic polymorphisms on activation in these ROIs during response inhibition. We predicted that alleles of SLC6A3 and COMT would differentially influence neural activation during response inhibition. For DAT, evidence suggests that the 10-repeat allele results in increased DAT expression, which may lead to an overly efficient reuptake of dopamine, reducing dopamine below optimal levels (Fuke, et al., 2001; Heinz, et al., 2000; Mill, et al., 2002). Higher amounts of the COMT enzyme (associated with the val allele) are suggested to lead to a higher rate of dopamine catabolism, thereby reducing dopamine below optimal levels (Chen, et al., 2004; Lotta, et al., 1995; Mannisto & Kaakkola, 1999). We predicted that, in brain regions where an optimal range of dopamine is necessary for successful inhibition, SLC6A3 and COMT variation would task-specifically alter dopamine availability and function. Indeed, for neural activation seen during successful inhibition, there was significantly greater activation in the ROIs in the 9+ group as compared to the 10/10 group. Surprisingly, COMT variation modulates not only the neural response during response inhibition, but also the neural response during the go process. For successful inhibition, and successful motor responding, there was significantly greater activation in ROIs in carriers of at least one met-allele than the val/val group. As greater activation represents better inhibitory control in this sample, results suggest that the 10/10 group and the val/val group show an impaired neural response during response inhibition as compared to the 9+ and met+ groups.
This finding that COMT modulates the neural response during both inhibition and response is surprising, given that we predicted to see an influence of SLC6A3 and COMT on activation during inhibition, but not performance, of a motor response. This finding may be explained in terms of the difference in function and distribution between DAT and COMT. DAT is responsible for removal of dopamine at the synapse, and there is a relative lack of DAT in cortical areas. COMT, on the other hand, is responsible for degrading dopamine in the extrasynaptic space and plays a particularly important role in regulating dopamine transmission in prefrontal cortical areas. Indeed, the influence of COMT on modulating prefrontal cognitive function is consistently reported across a number of tasks, including the present task (although it is worth noting that most previous tasks require a response for the trial-type of interest). It may be, then, that dopaminergic modulation of prefrontal cognitive functions, including both stopping and going, is more sensitive to variation in COMT activity than variation in DAT activity.
However, another important difference is that the results for SLC6A3 were limited to the StopInhibit—Go contrast, but the results for COMT were significant for the StopInhibit—Fixation and Go—Fixation contrasts. The StopInhibit—Go contrast is preferable for looking at response inhibition, and we can therefore interpret our SLC6A3 findings as the most reliable. In contrast, the effect of COMT on StopInhibit—Go was possibly confounded by the significant effects on both StopInhibit and Go activation. Furthermore, the pattern of differences in percent signal change across COMT genotype groups was slightly different between Go—Fixation and StopInhibit—Fixation contrasts: for Go—Fixation, activation was greatest in the met/met, followed by val/met, then val/val groups in the majority of ROIs, whereas for StopInhibit—Fixation, activation was greatest in val/met followed by met/met, then val/val groups in the majority of ROIs. Although these results are less clear, they do highlight the broader influence of COMT on regulating dopaminergic neurotransmission in subcortical and prefrontal regions involved in both stopping and going.
Dopaminergic System Variation and Prefrontal Cognitive Function
The results of the present study are in line with previous findings (Cools, Sheridan, Jacobs, & D’Esposito, 2007; Granon, et al., 2000; Mattay, et al., 2003; Wahlstrom, et al., 2007) and suggest that differences in dopamine availability, as predicted by both SLC6A3 and COMT genotypes, may differentially enhance or impair performance. It was predicted that two dopaminergic polymorphisms known to alter dopamine availability would influence neural activation during response inhibition. It’s useful to consider the results of the present study in relation to the inverted U-shaped response function of dopamine. We report that in a sample of healthy adults, those individuals in the SLC6A3 10/10 group and the COMT val/val group 1) had presumably reduced levels of dopamine availability; 2) fall to the left of the inverted U-shaped curve; and therefore 2) exhibited an impaired pattern of activation during inhibition. In contrast, those individuals with the SLC6A3 9-allele or the COMT met-allele 1) had presumably optimal levels of dopamine availability; 2) fall to the middle or left of the inverted U-shaped curve; and therefore 3) exhibited successful engagement of key stopping regions during inhibition. Dopamine is said to modulate the response of neural networks by suppressing spontaneous background firing and enhancing the task-specific response (Bilder, et al., 2004; Cohen, Braver, & Brown, 2002; Grace, 1991; Robbins, 2005; Seamans & Yang, 2004), and while these results illustrate a pattern consistent with at least the left arm of the inverted U-shaped curve, they suggest that there is an optimal range of dopamine availability for the performance of this task. In conclusion, dopaminergic variation in healthy adults may be one of many factors (including individual differences in baseline performance of the given task and self-reported trait impulsivity(Cools, 2008)) to influence this range of dopamine availability.
Limitations
There are several limitations of this study. First, it is recognized that the BOLD signal does not directly index dopamine availability or function. However, there is some data linking these two processes, including an in vivo study showing a relationship between striatal DA synthesis (FDOPA PET) and neural activation (BOLD signal) (Siessmeier, et al., 2006), as well as a review of evidence which suggests that a BOLD signal increase in the nucleus accumbens (during a relevant task) may predominantly reflect postsynaptic D1 receptor activation (Knutson & Gibbs, 2007). Therefore, the significant influence of SLC6A3 and COMT genotypes on neural activation may be suggestive of differences in activity resulting from differences in dopamine availability or function.
A second limitation concerns sample size. Although the final sample consisted of a sufficient number of participants, this sample was limited by the unbalanced sample sizes within COMT genotype groups. It would be worthwhile to examine the possible interaction of both genotypes within the same sample, which we were unable to do here because of unbalanced sample sizes. The limitation of obtaining adequate sample sized of genotypes with infrequent alleles should be addressed by oversampling these individuals in future studies. Although the sample size is small relative to genetic association studies, the size of the current sample is large by imaging genetics standards. Nonetheless, based on our relatively small sample, unbalanced genotype groups, and the mixed ethnicity of our sample, caution should be used when drawing conclusions based on our results.
A third limitation concerns specificity. We predicted a task-specific influence of SLC6A3 and COMT alleles on dopamine availability and function. Although the present study provides evidence that such variation does influence neural activation, we cannot conclude that it is task-specific, as this investigation included only the Stop-signal task. Furthermore, we did not assess resting activation and cannot rule out differences in baseline activity as a function of genotype, and we did not assess structural features so we cannot rule out anatomical differences.
Conclusion
The purpose of the present study was to assess the influence of dopaminergic variation on neural activation during response inhibition, and these results provide evidence for the influence of SLC6A3 and COMT genotypes on activation in the frontostriatal network during inhibition. To our knowledge, this is the first report of the effect of both SLC6A3 and COMT on neural activation during performance of a Stop-signal task in healthy adults. These data suggest that the neurophysiological response during response inhibition may be a suitable intermediate phenotype as the influence of SLC6A3 and COMT variation was detectable on neural response. This study is a major step towards elucidating the biological correlates of inhibitory control and impulsive-related behaviors. As inhibitory control is of significance for a number of psychiatric disorders, it is likely that this line of research will be of considerable clinical significance in advancing the prediction, diagnosis, and treatment of a wide range of psychiatric disorders.
Acknowledgments
We would like to thank Kazufumi Omura, Jason-Flor Sisante, Elizabeth Ramjas, Nicole Marsan, Nicole Steigerwald, and Jeanette Mumford for their assistance. This research was supported by an NIH grant F31 MH079643 and a Stony Brook University Department of Psychology Alumni Summer Research Fellowship to E. C., a NSF grant BCS-0224221 to T. C., and a DFG grant KFO 125 to K. P. L.
Footnotes
It should be noted that the current sample is distinct from the previously published sample, and we did not examine DRD4, alone or in combination with SLC6A3, in the present study.
It should be noted that in the present sample we did not exclude participants based on ethnicity; however, genotype groups were matched on age, sex, ethnicity, and education. As there were no differences between genotype groups, we did not include these variables in further analyses.
Note that although small volume correction was applied to the ROI analyses, ROI analyses were subsequently thresholded at p < 0.01 uncorrected in order to examine the direction of differences between genotype groups and for better visualization.
Publisher's Disclaimer: This is a PDF file of an unedited manuscript that has been accepted for publication. As a service to our customers we are providing this early version of the manuscript. The manuscript will undergo copyediting, typesetting, and review of the resulting proof before it is published in its final citable form. Please note that during the production process errors may be discovered which could affect the content, and all legal disclaimers that apply to the journal pertain.
References
- Arnsten AF, Goldman-Rakic PS. Noise stress impairs prefrontal cortical cognitive function in monkeys: evidence for a hyperdopaminergic mechanism. Arch Gen Psychiatry. 1998;55(4):362–368. doi: 10.1001/archpsyc.55.4.362. [DOI] [PubMed] [Google Scholar]
- Aron AR, Poldrack RA. Cortical and subcortical contributions to Stop signal response inhibition: Role of the subthalamic nucleus. J Neurosci. 2006;26(9):2424–2433. doi: 10.1523/JNEUROSCI.4682-05.2006. [DOI] [PMC free article] [PubMed] [Google Scholar]
- Aron AR, Behrens TE, Smith S, Frank MJ, Poldrack RA. Triangulating a cognitive control network using diffusion-weighted magnetic resonance imaging (MRI) and functional MRI. J Neurosci. 2007;27(14):3743–3752. doi: 10.1523/JNEUROSCI.0519-07.2007. [DOI] [PMC free article] [PubMed] [Google Scholar]
- Aron AR, Robbins TW, Poldrack RA. Inhibition and the right inferior frontal cortex. Trends Cogn Sci. 2004;8(4):170–177. doi: 10.1016/j.tics.2004.02.010. [DOI] [PubMed] [Google Scholar]
- Band GP, van der Molen MW, Logan GD. Horse-race model simulations of the stop-signal procedure. Acta Psychol (Amst) 2003;112(2):105–142. doi: 10.1016/s0001-6918(02)00079-3. [DOI] [PubMed] [Google Scholar]
- Bannon MJ, Michelhaugh SK, Wang J, Sacchetti P. The human dopamine transporter gene: gene organization, transcriptional regulation, and potential involvement in neuropsychiatric disorders. Eur Neuropsychopharmacol. 2001;11(6):449–455. doi: 10.1016/s0924-977x(01)00122-5. [DOI] [PubMed] [Google Scholar]
- Bearden CE, Freimer NB. Endophenotypes for psychiatric disorders: Ready for primetime? Trends in Genetics. 2006;22(6):306–313. doi: 10.1016/j.tig.2006.04.004. [DOI] [PubMed] [Google Scholar]
- Bellgrove MA, Hawi Z, Kirley A, Fitzgerald M, Gill M, Robertson IH. Association between dopamine transporter (DAT1) genotype, left-sided inattention, and an enhanced response to methylphenidate in attention-deficit hyperactivity disorder. Neuropsychopharmacology. 2005;30(12):2290–2297. doi: 10.1038/sj.npp.1300839. [DOI] [PubMed] [Google Scholar]
- Bellgrove MA, Hawi Z, Kirley A, Gill M, Robertson IH. Dissecting the attention deficit hyperactivity disorder (ADHD) phenotype: Sustained attention, response variability and spatial attentional asymmetries in relation to dopamine transporter (DAT1) genotype. Neuropsychologia. 2005;43(13):1847–1857. doi: 10.1016/j.neuropsychologia.2005.03.011. [DOI] [PubMed] [Google Scholar]
- Bertolino A, Blasi G, Latorre V, Rubino V, Rampino A, Sinibaldi L, Caforio G, Petruzzella V, Pizzuti A, Scarabino T, Nardini M, Weinberger DR, Dallapiccola B. Additive effects of genetic variation in dopamine regulating genes on working memory cortical activity in human brain. J Neurosci. 2006;26(15):3918–3922. doi: 10.1523/JNEUROSCI.4975-05.2006. [DOI] [PMC free article] [PubMed] [Google Scholar]
- Bertolino A, Fazio L, Di Giorgio A, Blasi G, Romano R, Taurisano P, Caforio G, Sinibaldi L, Ursini G, Popolizio T, Tirotta E, Papp A, Dallapiccola B, Borrelli E, Sadee W. Genetically Determined Interaction between the Dopamine Transporter and the D2 Receptor on Prefronto-Striatal Activity and Volume in Humans. J Neurosci. 2009;29(4):1224–1234. doi: 10.1523/JNEUROSCI.4858-08.2009. [DOI] [PMC free article] [PubMed] [Google Scholar]
- Bertolino A, Rubino V, Sambataro F, Blasi G, Latorre V, Fazio L, Caforio G, Petruzzella V, Kolachana B, Hariri A, Meyer-Lindenberg A, Nardini M, Weinberger DR, Scarabino T. Prefrontal-Hippocampal Coupling During Memory Processing Is Modulated by COMT Val158Met Genotype. Biol Psychiatry. 2006;60(11):1250–1258. doi: 10.1016/j.biopsych.2006.03.078. [DOI] [PubMed] [Google Scholar]
- Bilder RM, Volavka J, Lachman HM, Grace AA. The catechol-O-methyltransferase polymorphism: Relations to the tonic-phasic dopamine hypothesis and neuropsychiatric phenotypes. Neuropsychopharmacology. 2004;29(11):1943–1961. doi: 10.1038/sj.npp.1300542. [DOI] [PubMed] [Google Scholar]
- Brookes KJ, Neale BM, Sugden K, Khan N, Asherson P, D’Souza UM. Relationship between VNTR polymorphisms of the human dopamine transporter gene and expression in post-mortem midbrain tissue. 2007;144B(8):1070–1078. doi: 10.1002/ajmg.b.30572. [DOI] [PubMed] [Google Scholar]
- Brown SM, Manuck SB, Flory JD, Hariri AR. Neural basis of individual differences in impulsivity: Contributions of corticolimbic circuits for behavioral arousal and control. Emotion. 2006;6(2):239–245. doi: 10.1037/1528-3542.6.2.239. [DOI] [PubMed] [Google Scholar]
- Bruder GE, Keilp JG, Xu H, Shikhman M, Schori E, Gorman JM, Gilliam TC. Catechol-O-methyltransferase (COMT) genotypes and working memory: Associations with differing cognitive operations. Biol Psychiatry. 2005;58(11):901–907. doi: 10.1016/j.biopsych.2005.05.010. [DOI] [PubMed] [Google Scholar]
- Buchsbaum BR, Greer S, Chang WL, Berman KF. Meta-analysis of neuroimaging studies of the Wisconsin card-sorting task and component processes. Hum Brain Mapp. 2005;25(1):35–45. doi: 10.1002/hbm.20128. [DOI] [PMC free article] [PubMed] [Google Scholar]
- Caldu X, Vendrell P, Bartres-Faz D, Clemente I, Bargallo N, Jurado MA, Serra-Grabulosa JM, Junque C. Impact of the COMT Val108/158 Met and DAT genotypes on prefrontal function in healthy subjects. NeuroImage. 2007;37(4):1437–1444. doi: 10.1016/j.neuroimage.2007.06.021. [DOI] [PubMed] [Google Scholar]
- Canli T, Congdon E, Gutknecht L, Constable RT, Lesch KP. Amygdala responsiveness is modulated by tryptophan hydroxylase-2 gene variation. J Neural Transm. 2005;112(11):1479–1485. doi: 10.1007/s00702-005-0391-4. [DOI] [PubMed] [Google Scholar]
- Canli T, Omura K, Haas BW, Fallgatter A, Constable RT, Lesch KP. Beyond affect: A role for genetic variation of the serotonin transporter in neural activation during a cognitive attention task. Proc Natl Acad Sci U S A. 2005;102(34):12224–12229. doi: 10.1073/pnas.0503880102. [DOI] [PMC free article] [PubMed] [Google Scholar]
- Chambers CD, Bellgrove MA, Stokes MG, Henderson TR, Garavan H, Robertson IH, Morris AP, Mattingley JB. Executive “brake failure” following deactivation of human frontal lobe. J Cogn Neurosci. 2006;18(3):444–455. doi: 10.1162/089892906775990606. [DOI] [PubMed] [Google Scholar]
- Chen J, Lipska BK, Halim N, Ma QD, Matsumoto M, Melhem S, Kolachana BS, Hyde TM, Herman MM, Apud J, Egan MF, Kleinman JE, Weinberger DR. Functional analysis of genetic variation in catechol-O-methyltransferase (COMT): Effects on mRNA, protein, and enzyme activity in postmortem human brain. Am J Hum Genet. 2004;75(5):807–821. doi: 10.1086/425589. [DOI] [PMC free article] [PubMed] [Google Scholar]
- Cohen JD, Braver TS, Brown JW. Computational perspectives on dopamine function in prefrontal cortex. Curr Opin Neurobiol. 2002;12(2):223–229. doi: 10.1016/s0959-4388(02)00314-8. [DOI] [PubMed] [Google Scholar]
- Congdon E, Canli T. The endophenotype of impulsivity: Reaching consilience through behavioral, genetic, and neuroimaging approaches. Behavioral and Cognitive Neuroscience Reviews. 2005;4(4):262–281. doi: 10.1177/1534582305285980. [DOI] [PubMed] [Google Scholar]
- Congdon E, Lesch KP, Canli T. Analysis of DRD4 and DAT polymorphisms and behavioral inhibition in healthy adults: Implications for impulsivity. American Journal of Medical Genetics B Neuropsychiatric Genetics. 2008;147B(1):27–32. doi: 10.1002/ajmg.b.30557. [DOI] [PubMed] [Google Scholar]
- Cools R. Role of dopamine in the motivational and cognitive control of behavior. Neuroscientist. 2008;14(4):381–395. doi: 10.1177/1073858408317009. [DOI] [PubMed] [Google Scholar]
- Cools R, Sheridan M, Jacobs E, D’Esposito M. Impulsive personality predicts dopamine-dependent changes in frontostriatal activity during component processes of working memory. Journal of Neuroscience. 2007;27(20):5506–5514. doi: 10.1523/JNEUROSCI.0601-07.2007. [DOI] [PMC free article] [PubMed] [Google Scholar]
- Diamond A, Briand L, Fossella J, Gehlbach L. Genetic and neurochemical modulation of prefrontal cognitive functions in children. Am J Psychiatry. 2004;161(1):125–132. doi: 10.1176/appi.ajp.161.1.125. [DOI] [PubMed] [Google Scholar]
- Durston S, Fossella JA, Casey BJ, Hulshoff Pol HE, Galvan A, Schnack HG, Steenhuis MP, Minderaa RB, Buitelaar JK, Kahn RS, van Engeland H. Differential effects of DRD4 and DAT1 genotype on fronto-striatal gray matter volumes in a sample of subjects with attention deficit hyperactivity disorder, their unaffected siblings, and controls. Mol Psychiatry. 2005;10(7):678–685. doi: 10.1038/sj.mp.4001649. [DOI] [PubMed] [Google Scholar]
- Durston S, Fossella J, Mulder M, Casey BJ, Ziermans TI, Vessaz M, Nathalie M, Van Engeland H. Dopamine transporter genotype conveys familial risk of Attention-Deficit/Hyperactivity Disorder through striatal activation. Journal of the American Academy of Child & Adolescent Psychiatry. 2008;47(1):61–67. doi: 10.1097/chi.0b013e31815a5f17. [DOI] [PubMed] [Google Scholar]
- Egan MF, Goldberg TE, Kolachana BS, Callicott JH, Mazzanti CM, Straub RE, Goldman D, Weinberger DR. Effect of COMT Val108/158 Met genotype on frontal lobe function and risk for schizophrenia. Proc Natl Acad Sci U S A. 2001;98(12):6917–6922. doi: 10.1073/pnas.111134598. [DOI] [PMC free article] [PubMed] [Google Scholar]
- Eickhoff SB, Stephan KE, Mohlberg H, Grefkes C, Fink GR, Amunts K, Zilles K. A new SPM toolbox for combining probabilistic cytoarchitectonic maps and functional imaging data. NeuroImage. 2005;25(4):1325–1335. doi: 10.1016/j.neuroimage.2004.12.034. [DOI] [PubMed] [Google Scholar]
- Faraone SV, Perlis RH, Doyle AE, Smoller JW, Goralnick JJ, Holmgren MA, Sklar P. Molecular genetics of attention-deficit/hyperactivity disorder. Biological Psychiatry. 2005;57(11):1313–1323. doi: 10.1016/j.biopsych.2004.11.024. [DOI] [PubMed] [Google Scholar]
- Foote SL, Freedman R, Oliver PA. Effects of putative neurotransmitter on neuronal activity in monkey auditory cortex. Brain Research. 1975;86:229–242. doi: 10.1016/0006-8993(75)90699-x. [DOI] [PubMed] [Google Scholar]
- Fossella J, Sommer T, Fan J, Wu Y, Swanson JM, Pfaff DW, Posner MI. Assessing the molecular genetics of attention networks. BMC Neurosci. 2002;3(1):14. doi: 10.1186/1471-2202-3-14. [DOI] [PMC free article] [PubMed] [Google Scholar]
- Frank MJ. Hold your horses: A dynamic computational role for the subthalamic nucleus in decision making. Neural Networks. 2006;19(8):1120–1136. doi: 10.1016/j.neunet.2006.03.006. [DOI] [PubMed] [Google Scholar]
- Friston KJ. Statistical parametric mapping. In: Thatcher R, editor. Functional neuroimaging: Technical foundations. San Diego, CA: Academic Press; 1994. pp. 79–93. [Google Scholar]
- Fuke S, Suo S, Takahashi N, Koike H, Sasagawa N, Ishiura S. The VNTR polymorphism of the human dopamine transporter (DAT1) gene affects gene expression. Pharmacogenomics J. 2001;1(2):152–156. doi: 10.1038/sj.tpj.6500026. [DOI] [PubMed] [Google Scholar]
- Furukawa TA, Kessler RC, Slade T, Andrews G. The performance of the K6 and K10 screening scales for psychological distress in the Australian National Survey of Mental Health and Well-Being. Psychological Medicine. 2003;33(2):357–362. doi: 10.1017/s0033291702006700. [DOI] [PubMed] [Google Scholar]
- Garavan H, Ross TJ, Murphy K, Roche RA, Stein EA. Dissociable executive functions in the dynamic control of behavior: Inhibition, error detection, and correction. Neuroimage. 2002;17(4):1820–1829. doi: 10.1006/nimg.2002.1326. [DOI] [PubMed] [Google Scholar]
- Garavan H, Ross TJ, Stein EA. Right hemispheric dominance of inhibitory control: An event-related functional MRI study. Proc Natl Acad Sci U S A. 1999;96(14):8301–8306. doi: 10.1073/pnas.96.14.8301. [DOI] [PMC free article] [PubMed] [Google Scholar]
- Gilbert DL, Wang Z, Sallee FR, Ridel KR, Merhar S, Zhang J, Lipps TD, White C, Badreldin N, Wassermann EM. Dopamine transporter genotype influences the physiological response to medication in ADHD. Brain. 2006;129(Pt 8):2038–2046. doi: 10.1093/brain/awl147. [DOI] [PubMed] [Google Scholar]
- Gottesman II, Gould TD. The endophenotype concept in psychiatry: Etymology and strategic intentions. Am J Psychiatry. 2003;160(4):636–645. doi: 10.1176/appi.ajp.160.4.636. [DOI] [PubMed] [Google Scholar]
- Grace AA. Phasic versus tonic dopamine release and the modulation of dopamine system responsivity: A hypothesis for the etiology of schizophrenia. Neuroscience. 1991;41(1):1–24. doi: 10.1016/0306-4522(91)90196-u. [DOI] [PubMed] [Google Scholar]
- Granon S, Passetti F, Thomas KL, Dalley JW, Everitt BJ, Robbins TW. Enhanced and impaired attentional performance after infusion of D1 dopaminergic receptor agents into rat prefrontal cortex. Journal of Neuroscience. 2000;20(3):1208–1215. doi: 10.1523/JNEUROSCI.20-03-01208.2000. [DOI] [PMC free article] [PubMed] [Google Scholar]
- Hariri AR, Weinberger DR. Imaging genomics. Br Med Bull. 2003;65:259–270. doi: 10.1093/bmb/65.1.259. [DOI] [PubMed] [Google Scholar]
- Heinz A, Goldman D, Jones DW, Palmour R, Hommer D, Gorey JG, Lee KS, Linnoila M, Weinberger DR. Genotype influences in vivo dopamine transporter availability in human striatum. Neuropsychopharmacology. 2000;22(2):133–139. doi: 10.1016/S0893-133X(99)00099-8. [DOI] [PubMed] [Google Scholar]
- Holmes A, Friston K. Generalisability, Random Effects & Population Inference. NeuroImage. 1998;7(S):754. [Google Scholar]
- Horn NR, Dolan M, Elliott R, Deakin JF, Woodruff PW. Response inhibition and impulsivity: An fMRI study. Neuropsychologia. 2003;41(14):1959–1966. doi: 10.1016/s0028-3932(03)00077-0. [DOI] [PubMed] [Google Scholar]
- Hunnerkopf R, Strobel A, Gutknecht L, Brocke B, Lesch KP. Interaction between BDNF Val66Met and dopamine transporter gene variation influences anxiety-related traits. Neuropsychopharmacology. 2007;32(12):2552–2560. doi: 10.1038/sj.npp.1301383. [DOI] [PubMed] [Google Scholar]
- Jacobsen LK, Staley JK, Zoghbi SS, Seibyl JP, Kosten TR, Innis RB, Gelernter J. Prediction of dopamine transporter binding availability by genotype: a preliminary report. Am J Psychiatry. 2000;157(10):1700–1703. doi: 10.1176/appi.ajp.157.10.1700. [DOI] [PubMed] [Google Scholar]
- Kessler RC, Adler L, Ames M, Demler O, Faraone S, Hiripi E, Howes MJ, Jin R, Secnik K, Spencer T, Ustun TB, Walters EE. The World Health Organization Adult ADHD Self-Report Scale (ASRS): A short screening scale for use in the general population. Psychol Med. 2005;35(2):245–256. doi: 10.1017/s0033291704002892. [DOI] [PubMed] [Google Scholar]
- Kessler RC, Adler L, Barkley R, Biederman J, Conners CK, Demler O, Faraone SV, Greenhill LL, Howes MJ, Secnik K, Spencer T, Ustun TB, Walters EE, Zaslavsky AM. The prevalence and correlates of adult ADHD in the United States: results from the National Comorbidity Survey Replication. Am J Psychiatry. 2006;163(4):716–723. doi: 10.1176/appi.ajp.163.4.716. [DOI] [PMC free article] [PubMed] [Google Scholar]
- Kessler RC, Andrews G, Colpe LJ, Hiripi E, Mroczek DK, Normand SL, Walters EE, Zaslavsky AM. Short screening scales to monitor population prevalences and trends in non-specific psychological distress. Psychol Med. 2002;32(6):959–976. doi: 10.1017/s0033291702006074. [DOI] [PubMed] [Google Scholar]
- Kessler RC, Barker PR, Colpe LJ, Epstein JF, Gfroerer JC, Hiripi E, Howes MJ, Normand SLT, Manderscheid RW, Walters EE, Zaslavsky AM. Screening for Serious Mental Illness in the General Population. Archives of General Psychiatry. 2003;60(2):184–189. doi: 10.1001/archpsyc.60.2.184. [DOI] [PubMed] [Google Scholar]
- Kirley A, Lowe N, Hawi Z, Mullins C, Daly G, Waldman I, McCarron M, O’Donnell D, Fitzgerald M, Gill M. Association of the 480 bp DAT1 allele with methylphenidate response in a sample of Irish children with ADHD. Am J Med Genet. 2003;121B(1):50–54. doi: 10.1002/ajmg.b.20071. [DOI] [PubMed] [Google Scholar]
- Knutson B, Gibbs S. Linking nucleus accumbens dopamine and blood oxygenation. Psychopharmacology. 2007;191(3):813–822. doi: 10.1007/s00213-006-0686-7. [DOI] [PubMed] [Google Scholar]
- Kramer UM, Cunillera T, Camara E, Marco-Pallares J, Cucurell D, Nager W, Bauer P, Schule R, Schols L, Rodriguez-Fornells A, Munte TF. The impact of Catechol-O-methyltransferase and Dopamine D4 Receptor genotypes on neurophysiological markers of performance monitoring. Journal of Neuroscience. 2007;27(51):14190–14198. doi: 10.1523/JNEUROSCI.4229-07.2007. [DOI] [PMC free article] [PubMed] [Google Scholar]
- Langbehn DR, Pfohl BM, Reynolds S, Clark LA, Battaglia M, Bellodi L, Cadoret R, Grove W, Pilkonis P, Links P. The Iowa Personality Disorder Screen: Development and preliminary validation of a brief screening interview. J Personal Disord. 1999;13(1):75–89. doi: 10.1521/pedi.1999.13.1.75. [DOI] [PubMed] [Google Scholar]
- Li CS, Huang C, Constable RT, Sinha R. Imaging response inhibition in a stop-signal task: Neural correlates independent of signal monitoring and post-response processing. J Neurosci. 2006;26(1):186–192. doi: 10.1523/JNEUROSCI.3741-05.2006. [DOI] [PMC free article] [PubMed] [Google Scholar]
- Li CS, Yan P, Sinha R, Lee TW. Subcortical processes of motor response inhibition during a stop signal task. NeuroImage. 2008;41(4):1352–1363. doi: 10.1016/j.neuroimage.2008.04.023. [DOI] [PMC free article] [PubMed] [Google Scholar]
- Logan GD. On the ability to inhibit thought and action: A user’s guide to the stop signal paradigm. In: Dagenbach D, Carr TH, editors. Inhibitory processes in attention, memory, and language. San Diego: Academic Press; 1994. pp. 189–239. [Google Scholar]
- Loo SK, Specter E, Smolen A, Hopfer C, Teale PD, Reite ML. Functional effects of the DAT1 polymorphism on EEG measures in ADHD. J Am Acad Child Adolesc Psychiatry. 2003;42(8):986–993. doi: 10.1097/01.CHI.0000046890.27264.88. [DOI] [PubMed] [Google Scholar]
- Lotta T, Vidgren J, Tilgmann C, Ulmanen I, Melen K, Julkunen I, Taskinen J. Kinetics of human soluble and membrane-bound catechol O-methyltransferase: a revised mechanism and description of the thermolabile variant of the enzyme. Biochemistry. 1995;34(13):4202–4210. doi: 10.1021/bi00013a008. [DOI] [PubMed] [Google Scholar]
- Malhotra AK, Kestler LJ, Mazzanti C, Bates JA, Goldberg T, Goldman D. A functional polymorphism in the COMT gene and performance on a test of prefrontal cognition. American Journal of Psychiatry. 2002;159:652–654. doi: 10.1176/appi.ajp.159.4.652. [DOI] [PubMed] [Google Scholar]
- Mannisto PT, Kaakkola S. Catechol-O-methyltransferase (COMT): biochemistry, molecular biology, pharmacology, and clinical efficacy of the new selective COMT inhibitors. Pharmacol Rev. 1999;51(4):593–628. [PubMed] [Google Scholar]
- Mattay VS, Goldberg TE, Fera F, Hariri AR, Tessitore A, Egan MF, Kolachana B, Callicott JH, Weinberger DR. Catechol O-methyltransferase val158-met genotype and individual variation in the brain response to amphetamine. Proc Natl Acad Sci U S A. 2003;100(10):6186–6191. doi: 10.1073/pnas.0931309100. [DOI] [PMC free article] [PubMed] [Google Scholar]
- Mill J, Asherson P, Browes C, D’Souza U, Craig I. Expression of the dopamine transporter gene is regulated by the 3′ UTR VNTR: Evidence from brain and lymphocytes using quantitative RT-PCR. Am J Med Genet. 2002;114(8):975–979. doi: 10.1002/ajmg.b.10948. [DOI] [PubMed] [Google Scholar]
- Mumford J, Poldrack RA. A guide to calculating percent signal change with Featquery. 2007 http://mumford.bol.ucla.edu/perchange_guide.pdf. Retrieved from http://mumford.bol.ucla.edu/perchange_guide.pdf.
- Nolan KA, Bilder RM, Lachman HM, Volavka J. Catechol O-methyltransferase Val158Met polymorphism in schizophrenia: Differential effects of Val and Met alleles on cognitive stability and flexibility. Am J Psychiatry. 2004;161(2):359–361. doi: 10.1176/appi.ajp.161.2.359. [DOI] [PubMed] [Google Scholar]
- Omura K, Constable RT, Canli T. Amygdala gray matter concentration is associated with extraversion and neuroticism. Neuroreport. 2005;16(17):1905–1908. doi: 10.1097/01.wnr.0000186596.64458.76. [DOI] [PubMed] [Google Scholar]
- Rieger M, Gauggel S, Burmeister K. Inhibition of ongoing responses following frontal, nonfrontal, and basal ganglia lesions. Neuropsychology. 2003;17(2):272–282. doi: 10.1037/0894-4105.17.2.272. [DOI] [PubMed] [Google Scholar]
- Robbins TW. Chemistry of the mind: Neurochemical modulation of prefrontal cortical function. J Comp Neurol. 2005;493(1):140–146. doi: 10.1002/cne.20717. [DOI] [PubMed] [Google Scholar]
- Rosa A, Peralta V, Cuesta MJ, Zarzuela A, Serrano F, Martinez-Larrea A, Fananas L. New evidence of association between COMT gene and prefrontal neurocognitive function in healthy individuals from sibling pairs discordant for psychosis. Am J Psychiatry. 2004;161(6):1110–1112. doi: 10.1176/appi.ajp.161.6.1110. [DOI] [PubMed] [Google Scholar]
- Rubia K, Russell T, Overmeyer S, Brammer MJ, Bullmore ET, Sharma T, Simmons A, Williams SC, Giampietro V, Andrew CM, Taylor E. Mapping motor inhibition: Conjunctive brain activations across difference versions of Go/No-Go and Stop Tasks. Neuroimage. 2001;13:250–261. doi: 10.1006/nimg.2000.0685. [DOI] [PubMed] [Google Scholar]
- Rubia K, Smith AB, Brammer MJ, Taylor E. Right inferior prefrontal cortex mediates response inhibition while mesial prefrontal cortex is responsible for error detection. Neuroimage. 2003;20(1):351–358. doi: 10.1016/s1053-8119(03)00275-1. [DOI] [PubMed] [Google Scholar]
- Schott BH, Seidenbecher CI, Fenker DB, Lauer CJ, Bunzeck N, Bernstein HG, Tischmeyer W, Gundelfinger ED, Heinze HJ, Duzel E. The dopaminergic midbrain participates in human episodic memory formation: evidence from genetic imaging. J Neurosci. 2006;26(5):1407–1417. doi: 10.1523/JNEUROSCI.3463-05.2006. [DOI] [PMC free article] [PubMed] [Google Scholar]
- Seamans JK, Yang CR. The principal features and mechanisms of dopamine modulation in the prefrontal cortex. Prog Neurobiol. 2004;74(1):1–58. doi: 10.1016/j.pneurobio.2004.05.006. [DOI] [PubMed] [Google Scholar]
- Siessmeier T, Kienast T, Wrase J, Larsen JL, Braus DF, Smolka MN, Buchholz HG, Schreckenberger M, Rosch F, Cumming P, Mann K, Bartenstein P, Heinz A. Net influx of plasma 6-[18F]fluoro-l-DOPA (FDOPA) to the ventral striatum correlates with prefrontal processing of affective stimuli. European Journal of Neuroscience. 2006;24(1):305–313. doi: 10.1111/j.1460-9568.2006.04903.x. [DOI] [PubMed] [Google Scholar]
- Smolka MN, Schumann G, Wrase J, Grusser SM, Flor H, Mann K, Braus DF, Goldman D, Buchel C, Heinz A. Catechol-O-methyltransferase val158met genotype affects processing of emotional stimuli in the amygdala and prefrontal cortex. J Neurosci. 2005;25(4):836–842. doi: 10.1523/JNEUROSCI.1792-04.2005. [DOI] [PMC free article] [PubMed] [Google Scholar]
- Szobot C, Roman T, Cunha R, Acton P, Hutz M, Rohde LA. Brain perfusion and dopaminergic genes in boys with attention-deficit/hyperactivity disorder. Am J Med Genet B Neuropsychiatr Genet. 2005;132(1):53–58. doi: 10.1002/ajmg.b.30096. [DOI] [PubMed] [Google Scholar]
- Tan HY, Chen Q, Goldberg TE, Mattay VS, Meyer-Lindenberg A, Weinberger DR, Callicott JH. Catechol-O-Methyltransferase Val158Met modulation of prefrontal parietal striatal brain systems during arithmetic and temporal transformations in working memory. Journal of Neuroscience. 2007;27(49):13393–13401. doi: 10.1523/JNEUROSCI.4041-07.2007. [DOI] [PMC free article] [PubMed] [Google Scholar]
- Tzourio-Mazoyer N, Landeau B, Papathanassiou D, Crivello F, Etard O, Delcroix N, Mazoyer B, Joliot M. Automated anatomical labeling of activations in SPM using a macroscopic anatomical parcellation of the MNI MRI single-subject brain. NeuroImage. 2002;15(1):273–289. doi: 10.1006/nimg.2001.0978. [DOI] [PubMed] [Google Scholar]
- Valdes IH, Steinberg JL, Narayana PA, Kramer LA, Dougherty DM, Swann AC, et al. Impulsivity and BOLD fMRI activation in MDMA users and healthy control subjects. Psychiatry Res. 2006;147(2–3):239–242. doi: 10.1016/j.pscychresns.2006.01.014. [DOI] [PubMed] [Google Scholar]
- van Dyck CH, Malison RT, Jacobsen LK, Seibyl JP, Staley JK, Laruelle M, Baldwin RM, Innis RB, Gelernter J. Increased dopamine transporter availability associated with the 9-repeat allele of the SLC6A3 gene. J Nucl Med. 2005;46(5):745–751. [PubMed] [Google Scholar]
- VanNess SH, Owens MJ, Kilts CD. The variable number of tandem repeats element in DAT1 regulates in vitro dopamine transporter density. BMC Genet. 2005;6:55. doi: 10.1186/1471-2156-6-55. [DOI] [PMC free article] [PubMed] [Google Scholar]
- Wahlstrom D, White T, Hooper CJ, Vrshek-Schallhorn S, Oetting WS, Brott MJ, Luciana M. Variations in the Catechol O-methyltransferase polymorphism and prefrontally guided behaviors in adolescents. Biological Psychiatry. 2007;61(5):626–632. doi: 10.1016/j.biopsych.2006.05.045. [DOI] [PubMed] [Google Scholar]
- Waldman ID, Rowe DC, Abramowitz A, Kozel ST, Mohr JH, Sherman SL, Cleveland HH, Sanders ML, Gard JM, Stever C. Association and linkage of the dopamine transporter gene and attention-deficit hyperactivity disorder in children: Heterogeneity owing to diagnostic subtype and severity. Am J Hum Genet. 1998;63(6):1767–1776. doi: 10.1086/302132. [DOI] [PMC free article] [PubMed] [Google Scholar]
- Williams GV, Goldman-Rakic PS. Modulation of memory fields by dopamine D1 receptors in prefrontal cortex. Nature. 1995;376(6541):572–575. doi: 10.1038/376572a0. [DOI] [PubMed] [Google Scholar]
- Yacubian J, Sommer T, Schroeder K, Glascher J, Kalisch R, Leuenberger B, Braus DF, Buchel C. Gene gene interaction associated with neural reward sensitivity. Proceedings of the National Academy of Sciences, USA. 2007;104(19):8125–8130. doi: 10.1073/pnas.0702029104. [DOI] [PMC free article] [PubMed] [Google Scholar]
- Yang B, Chan RCK, Jing J, Li T, Sham P, Chen RYL. A meta-analysis of association studies between the 10-repeat allele of a VNTR polymorphism in the 3prime-UTR of dopamine transporter gene and attention deficit hyperactivity disorder. American Journal of Medical Genetics Part B: Neuropsychiatric Genetics. 2007;144B(4):541–550. doi: 10.1002/ajmg.b.30453. [DOI] [PubMed] [Google Scholar]
- Zheng D, Oka T, Bokura H, Yamaguchi S. The key locus of common response inhibition network for no-go and stop signals. J Cogn Neurosci. 2008;20(8):1434–1442. doi: 10.1162/jocn.2008.20100. [DOI] [PubMed] [Google Scholar]