Abstract
Background
To investigate influencing factors of the metastatic lymph nodes ratio (MLR) and whether it is related to survival in patients with gastric adenocarcinoma.
Methods
We retrospectively evaluated the clinical features of 121 patients with gastric adenocarcinoma enrolled in our hospital between 2000 and 2007. The receiver operating characteristic (ROC) curve was used to determine the cutoff of the MLR, and CK20 immunohistochemical staining was used to detect micrometastasis of the lymph nodes.
Results
The areas under the ROC curve of MLR used to predict the death of 3-year and 5-year postoperative patients were 0.826 ± 0.053 and 0.896 ± 0.046. Thus MLR = 30.95% and MLR = 3.15% were designated as cutoffs. The MLR was then classified into three groups: MLR1 (MLR<3.15%); MLR2(3.15% ≤ MLR ≤ 30.95%); and MLR3 (MLR>30.95%). We found that patients with a higher MLR demonstrated a much poorer survival period after radical operation than those patients with a lower MLR (P = 0.000). The COX model showed that MLR was an independent prognostic factor (P = 0.000). The MLR could also discriminate between subsets of patients with different 5-year survival periods within the same N stage (P < 0.05). The MLR has been shown to be 34.7% (242/697) by HE staining and 43.5% (303/697) by CK staining (P = 0.001). The clinicopathological characteristics of lymph vessel invasion and the depth of invasion could significantly affect the MLR.
Conclusion
MLR is an independent prognostic factor in gastric cancer. The combined ROC curve with MLR is an effective strategy to produce a curve to predict the 3-year and 5-year survival rates.
Background
The metastatic lymph nodes ratio (MLR, N ratio) is a powerful independent prognostic factor in gastric cancer, even when only a few lymph nodes metastases were found [1-6]. The MLR reflects the efficacy of the resection of lymph nodes, which is the best method to prevent stage migration [3,4]. However, the criteria for MLR classification are controversial. In order to investigate the relationship between MLR and prognosis, N stage, and clinical characteristics, we used a receiver operating characteristic curve (ROC curve) to determine the MLR cutoff. Additionally, the influence of MLR on micrometastasis was also evaluated.
Methods
Patients
Between 2000 and 2007, 121 patients with gastric adenocarcinoma were enrolled in this study from the Department of General Surgery, No. 3 People's Hospital, Shanghai Jiao-Tong University School of Medicine. All patients were underwent a curative gastrectomy and none of the patients received preoperative treatments. These patients consisted of 77 men and 44 women, ranging in age from 29 to 82, with a median age of 64. Total gastrectomy was performed in 9 patients, distal subtotal gastrectomy in 90 patients, and proximal subtotal gastrectomy in 22 patients. Additionally, 2 patients underwent D1 lymphadenectomy, 110 patients underwent D2 lymphadenectomy, and 9 patients underwent D3 lymphadenectomy. Postsurgery pathological examination showed 16 early adenocarcinomas, 4 fungating type adenocarcinomas, 16 ulcerative type adenocarcinomas, 71 invasion ulcerative type adenocarcinomas, and 14 diffuse infiltrative type adenocarcinomas. All clinicopathological profiles were evaluated in accordance with the criteria of the Japanese Gastric Cancer Association [7]. Moreover, N stage was also evaluated according to the TNM classification of the 6th edition criteria of the International Union against Cancer (UICC) [8]. Patient follow-up ended on April 30, 2008 and the mean follow-up was 23 months. During the follow-up period, 46 patients died of recurrence or metastasis, 6 patients died of other diseases, and 20 patients were lost to follow-up. The survival time ranged from 6 to 93 months.
Immunohistochemistry
CK20 immunohistochemical staining and hematoxylin-eosin (HE) staining were performed on 695 consecutive lymph node sections from 45 gastric cancer patients. The tissue sections were deparaffinized, dehydrated, and incubated in 3% hydrogen peroxide to block endogenous peroxidase activity. For the purpose of antigen retrieval, samples were microwaved for 10 minutes and were then washed with PBS. Immunohistochemical staining was performed with mouse monoclonal antibody against human CK20 primary antibodies (Changdao, Shanghai, China). Positive controls consisted of gastric cancer histological sections (Changdao, Shanghai, China), and negative controls used PBS in place of the primary antibody.
Criterion of lymph node micrometastasis
CK20 is expressed in the cytoplasm. Lymph node sections with an N0 of HE staining, positive CK20 immunohistochemical staining, and a tumor diameter in the lymph nodes ranging from 0.2 to 2 mm were defined as lymph node micrometastasis. The results above were analyzed by two pathologists.
Statistical analysis
All statistical calculations were performed using the SPSS 13.0 statistical software. ROC curves were used to assess the accuracy of the MLR prediction survival. Comparison of the MLR with CK20 immunohistochemical staining and HE staining was examined with a χ2 test. Patient survival was analyzed using the Kaplan Meier product limit method. The log rank test was used to evaluate the difference between groups. The relationship between MLR and clinical characteristics was examined with the Mann-Whitney U test. Statistical significance was defined as P < 0.05.
Results
Postsurgery survival rate
Of all patients, the postsurgery 1-year to 7-year survival rates were 74%, 50%, 40%, 29%, 17%, 13%, and 8%, respectively.
ROC curve analysis correlation between MLR and survival
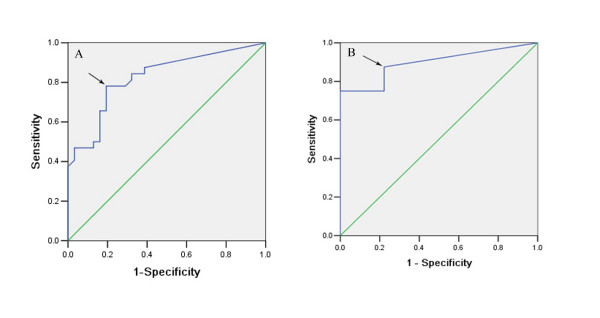
After excluding from the original 121 patients that had died of other diseases or were lost to follow-up in 3 years, the ROC curve was drawn according to the survival of the remaining 63 patients (Figure 1A). Similarly, after excluding the patients that had died of other diseases or were lost to follow-up in 5 years, the ROC curve was drawn according to the survival of the remaining 49 patients (Figure 1B). The areas under the curves described above were 0.826 ± 0.053 (95% CI: 0.723 – 0.929) (P = 0.000) for the three-year survival ROC curve and 0.896 ± 0.046 (95% CI: 0.806 – 0.986) (P = 0.000) for the five-year survival curve. According to Youden's index, the maximum J value was 0.587 and 0.653, respectively (J = Sensitivity + Specificity - 1). Cutoffs of MLR = 30.95% (Figure 1A, arrow) and MLR = 3.15% (Figure 1B, arrow) were designated, respectively. Under these circumstances, the sensitivity was 78.1% and 87.5% and the specificity was 80.6% and 77.8%.
Figure 1.
ROC curve of MLR for predicting survival rate. A. For predicting the 3-year survival rate; B. For predicting the 5-year survival rate.
Correlation between MLR grades and prognosis
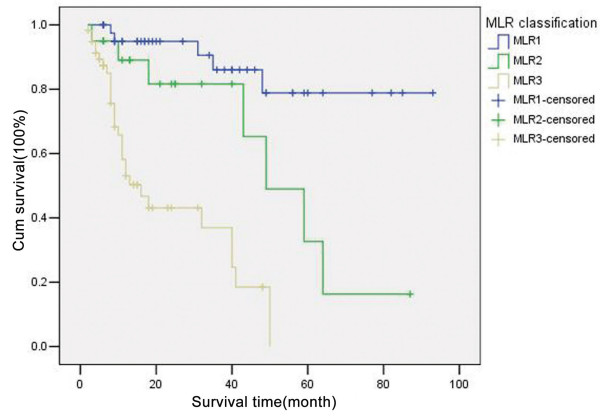
With MLR = 30.95% and MLR = 3.15% designated as cutoffs, the MLR was defined as MLR1 (MLR<3.15%), MLR2 (3.15% ≤ MLR ≤ 30.95%), and MLR3 (MLR>30.95%). Univariate survival analysis suggested that a significant difference in prognosis was found among the different MLR groups (X2 = 36.575, P = 0.000). Postsurgery survival time was shorter in patients with a higher MLR (Figure 2). As shown in Table 1, multivariate risk analysis showed that only MLR is an independent prognostic factor. Patients with a higher MLR suffered a higher death risk (RR = 2.801, P = 0.000, 95% CI: 1.680 – 4.668)(Table 2).
Figure 2.
Survival curves of patients in different MLR groups.
Table 1.
Influence of clinicopathological characteristics on the prognosis in 121 gastric adenocarcinoma patients.
| Characteristics | Samples | Five-year survival (%) |
Log-rank (X2value) |
P value |
| Gender (male/female) | 77/44 | 35.5/49.5 | 0.527 | 0.468 |
| Lauren type | ||||
| Intestinal type | 109 | 46.1 | 6.322 | 0.012 |
| Diffuse type | 12 | 0 | ||
| Type of histology | ||||
| 1–2 | 75 | 40.5 | 0.000 | 0.990 |
| 3 | 46 | 40.0 | ||
| Lymphatic vessel invasion | ||||
| Negative | 54 | 60.6 | 14.199 | 0.000 |
| Positive | 67 | 18.3 | ||
| Blood vessel invasion | ||||
| Negative | 100 | 43.7 | 13.455 | 0.000 |
| Positive | 21 | 28.8 | ||
| Lymph nodes metastasis | ||||
| Negative | 44 | 79.0 | 24.919 | 0.000 |
| Positive | 77 | 13.0 | ||
| Depth of invasion | ||||
| T1 | 18 | 94.1 | 25.835 | 0.000 |
| T2 | 31 | 56.0 | ||
| T3 | 31 | 36.7 | ||
| T4 | 41 | 0 | ||
| N stage (UICC) | ||||
| N0 | 43 | 78.9 | 34.320 | 0.000 |
| N1 | 44 | 22.1 | ||
| N2 | 24 | 0 | ||
| N3 | 10 | 0 | ||
| N stage (JRSGC) | ||||
| N0 | 42 | 78.9 | 38.976 | 0.000 |
| N1 | 38 | 12.6 | ||
| N2 | 31 | 16.4 | ||
| N3 | 10 | 0 | ||
| MLR | ||||
| MLR1 | 43 | 78.9 | 36.575 | 0.000 |
| MLR2 | 20 | 32.7 | ||
| MLR3 | 58 | 0 |
Table 2.
Multivariate risk analysis of 121 gastric adenocarcinoma patients.
| Characteristics | B | S.E. | Wald | df | Sig. | Exp (B) | 95.0%(CI)) |
| Lauren type | 0.901 | 0.439 | 4.218 | 1 | 0.04 | 2.462 | 1.042 – 5.819 |
| Depth of invasion | 0.684 | 0.223 | 9.397 | 1 | 0.002 | 1.981 | 1.280 – 3.067 |
| MLR | 1.030 | 0.261 | 15.610 | 1 | 0.000 | 2.801 | 1.680 – 4.668 |
Correlation between MLR and N stage in gastric adenocarcinoma
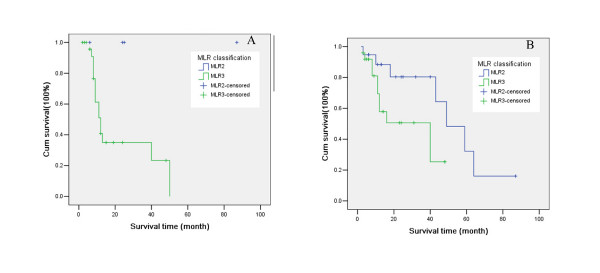
As shown in Table 3, patients with the same N stage may be in different MLR groups. Moreover, in N2 stage (JRSGC classification), differences in the patients' prognosis were seen among the different MLR groups (X2 = 4.372, P = 0.037) (Figure 3A). Similarly, in N1 stage (UICC classification), differences were also observed (X2 = 4.320, P = 0.038) (Figure 3B).
Table 3.
Correlation between MLR and N stage in gastric adenocarcinoma.
| MLR groups [n (%)] | MLR groups [n (%)] | ||||||||
| N stage (UICC) | Samples | MLR1 | MLR2 | MLR3 | N stage (JRSGC) | Samples | MLR1 | MLR2 | MLR3 |
| N0 | 43 | 43(100) | N0 | 43 | 43(100) | ||||
| N1 | 44 | 19(43.2) | 25(56.8) | N1 | 38 | 16(42.1) | 22(57.9) | ||
| N2 | 24 | 1(4.2) | 23(95.8) | N2 | 30 | 4(13.3) | 26(86.7) | ||
| N3 | 10 | 10(100) | N3 | 10 | 10(100) | ||||
Figure 3.
Survival curves in patients with the same N stage, but in different MLR groups. A. N2 stage (JRSGC classification); B. N1 (UICC classification).
Effects of lymph node micrometastasis on the MLR in gastric adenocarcinoma
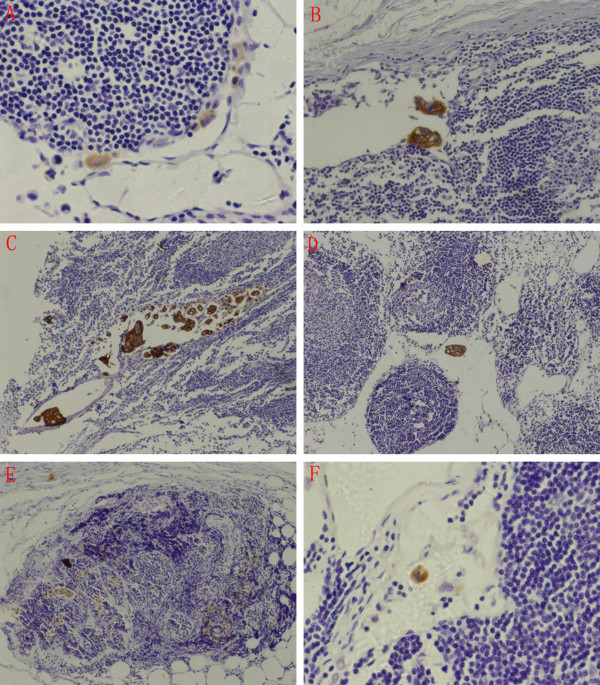
Lymph node micrometastasis was identified as a metastatic focus ranging from 0.2 to 2 mm in diameter and was mainly located at the marginal sinus with a nonclustered or clustered distribution. Occasionally, some were also observed at the medulla or cortex. In lymph nodes with positive HE staining, tumor cells were found gathered into a cluster. Additionally, some lymph nodes were disrupted by tumor cells (Figure 4).
Figure 4.
Distribution characteristics of lymph node micrometastasis. A. Marginal sinus type, nonclustered (×400); B. Marginal sinus type, clustered (×200); C. Intermediate sinus type, clustered and nonclustered (×100); D. Parenchymal type, clustered (×100); E. Diffuse type, clustered (×100); F. Isolated tumor cells (×400).
In total, 697 lymph nodes in 45 gastric adenocarcinomas patients were examined, with a median number of 13 nodes (ranging from seven to 46) and an average number of 15. In all, lymph node micrometastasis was identified in 35 of 45 patients and in 242 of 697 nodes (MLR = 34.7%, 242/697). All these nodes showed positive CK immunohistochemical staining. Furthermore, lymph nodes micrometastasis was identified by CK immunohistochemical staining in four of 10 nodes with N0 determined by HE staining. Lymph node micrometastasis was also identified in 61 of 455 (13.4%) lymph nodes with negative CK immunohistochemical staining. The MLR determined by CK staining was 43.5% (303/696). Notably, the MLR determined by HE staining and CK staining showed a significant difference (P = 0.001) (Table 4). Whether identified by HE or CK staining, the MLR was related to lymph vessel invasion and the depth of invasion (P < 0.05) (Table 5), but was not related to gender, Lauren classification, type of histology, and blood vessel invasion.
Table 4.
Patients with lymph node metastasis detected by HE and CK staining.
|
Lymph node metastasis Case No (%) |
P |
Lymph node metastasis LN No (%) |
P | |||
| Positive | Negative | Positive | Negative | |||
| HE | 35 (77.8) | 10 (22.2) | 0.25 | 303 (43.5) | 394 (56.5) | 0.001 |
| CK | 39 (86.7) | 6 (13.3) | 242 (34.7) | 455 (65.3) | ||
Table 5.
Correlation between MLR grades and clinical characteristics.
| Characteristics | Samples | MLR classification (HE) | P | MLR classification (CK) | P | ||||
| MLR1 | MLR2 | MLR3 | MLR1 | MLR2 | MLR3 | ||||
| Total | 45 | 10 | 12 | 23 | 6 | 9 | 30 | ||
| Gender | 0.607 | 0.508 | |||||||
| Male | 26 | 4 | 11 | 11 | 2 | 6 | 18 | ||
| Female | 19 | 6 | 1 | 12 | 4 | 3 | 12 | ||
| Lauren type | 0.823 | 0.870 | |||||||
| Intestinal type | 42 | 9 | 12 | 21 | 6 | 8 | 28 | ||
| Diffuse type | 3 | 1 | 0 | 2 | 0 | 1 | 2 | ||
| Type of histology | 0.808 | 0.833 | |||||||
| 1–2 | 28 | 5 | 10 | 13 | 3 | 7 | 18 | ||
| 3 | 17 | 5 | 2 | 10 | 3 | 2 | 12 | ||
| Lymphatic vessel invasion | 0.000 | 0.000 | |||||||
| Negative | 10 | 9 | 1 | 0 | 5 | 4 | 1 | ||
| Positive | 35 | 1 | 11 | 23 | 1 | 5 | 29 | ||
| Blood vessel invasion | 0.086 | 0.069 | |||||||
| Negative | 35 | 10 | 9 | 16 | 6 | 8 | 21 | ||
| Positive | 10 | 0 | 3 | 7 | 0 | 1 | 9 | ||
| Depth of invasion | 0.045 | 0.019 | |||||||
| pT1–2 | 15 | 6 | 4 | 5 | 5 | 3 | 7 | ||
| pT3–4 | 30 | 4 | 8 | 18 | 1 | 6 | 23 | ||
Discussion
The prognosis was significantly related to pathological characteristics. MLR is a simple and effective marker that can prevent stage migration. Nonetheless, the criteria of MLR classification need to be established [9,10]. The MLR cutoff was designated as 20% (N0, 0%; N1, <20%; N2, >20%) in a German gastric cancer study [9,10]. Yu and colleagues designated the MLR cutoff as 25% in gastric cancer patients that underwent D2 lymphadenectomy [11]. Kodera and colleagues defined the MLR as 0%, 1% – 19%, 20% – 60% and >60% in gastric cancer patient that underwent D2 lymphadenectomy [6]. Hyung and colleagues designated 10% MLR as N1 stage and 25% MLR as N2 stage in T3 gastric cancer [5]. Additionally, the MLR was defined as ≤ 25%, ≤ 50% and >50% [4] or 0%, 1% – 10%, 11% – 25% and >25% [3]. The MLR was also classified as 0%, 0% – 30%, 30% – 50% and >50% in a Chinese study [2]. All the studies mentioned above demonstrated that the MLR is an independent prognostic factor in gastric cancer. However, more effective criteria for MLR classification need to be further elucidated.
The ROC curve has been extensively used to measure diagnostic accuracy. The ROC curve also can be used to evaluate the predictive value of the scoring system [12,13]. By using the ROC curve in the current study to determine the cutoff, the MLR proved to be an independent prognostic factor in gastric cancer. In the N2 stage of the JRSGC classification and N1 stage of the UICC classification, differences in prognosis were seen among the different MLR groups. Three-year and five-year survival rates were believed to be effective markers for gastric cancer prognosis. Therefore, the combined ROC curve with MLR is an effective strategy for drawing the curve to predict three-year and five-year survival rates.
Metastatic foci in lymph nodes, ranging from 0.2 to 2 mm, <0.2 mm, and >2 mm in diameter, were identified as lymph node micrometastasis, isolated tumor cells (ITCs), and lymph node metastasis, respectively [8]. Metastatic foci in lymph nodes were in a nonclustered or clustered distribution: a single clustered metastatic focus with a maximum diameter ranging from 0.2 to 2 mm, multiple clustered metastatic foci with the maximum sum of diameters ranging from 0.2 to 2 mm, and nonclustered metastatic foci with the maximum area size, including cancer cells, ranging from 0.2 to 2 mm [14].
Lymph node metastasis is one of the most important prognostic factors in gastric cancer. Until now, HE staining as a routine pathological examination is the good standard for the diagnosis of lymph node metastasis. However, the occurrences of lymph node micrometastasis could not be identified by routine pathological detection. Recent advances in immunohistochemical and molecular biologic techniques have made it possible to detect the lymph node micrometastasis. Cytokeratin is a component of the cytoskeleton of epithelial cells, which dose not present in the lymph nodes. Immunohistochemical examination by CK20 as one of cytokeratin family and a gene marker of tumor has been applied for longer than a decade [15] and CK20 mRNA has also successfully been detected in lymph nodes without metastasis in routine histological examination [16]. In comparison with the detection of CK20 mRNA from lymph node, the immunohistochemical examination of CK20 has some advantages such as morphological observation and utilization of retrospective investigation.
Morphologically, cancer cells in lymph nodes were described as marginal sinus, intermediate sinus, parenchymal, and diffuse types. Marginal sinus is the most common type. This may be due to migrant cancer cells that were initially arrested in the marginal sinus [14,17]. In this study, metastatic foci in lymph nodes were mainly located at the marginal sinus with a nonclustered or clustered distribution, which is consistent with metastasis theory. A previous study indicated that micrometastasis in lymph nodes had proliferating activity and had the potential for developing metastasis [18].
Conclusion
In conclusion, our study suggests that the MLR is an independent prognostic factor in gastric cancer and, when combined with the ROC curve, is an effective strategy for drawing a curve for predicting the 3-year and 5-year survival rates. The results of lymph node micrometastasis make the MLR increase.
Competing interests
The authors declare that they have no competing interests.
Authors' contributions
JWY contributed in study concepts, manuscript preparation and manuscript editing. JGW carried out study design, definition of intellectual content, literature research, experimental studies, data acquisition, data analysis, statistical analysis and manuscript preparation. LHZ, BZ, XCN and BJJ contributed in clinical managements. XQL contributed in pathological studies. BJJ contributed in guarantor of integrity of the entire study, study concepts, study design and manuscript review.
Acknowledgments
Acknowledgements
This research is supported by a grant of Shanghai Bureau of Health (grant no. 034086). The authors appreciate Dr GY Du for the excellent supports in the pathological examinations. Written consent for publication was obtained from the patient or their relative. All authors read and approved the final manuscript.
Contributor Information
Ji-wei Yu, Email: jiweiyu919@hotmail.com.
Ju-gang Wu, Email: lemonimpass@163.com.
Lin-hai Zheng, Email: Zheng749@126.com.
Biao Zhang, Email: Zhb6914@hotmail.com.
Xiao-chun Ni, Email: nixiaochun1981@yahoo.com.cn.
Xiao-qiang Li, Email: duguangye@hotmail.com.
Bo-jian Jiang, Email: Jiang-bj2102@hotmail.com.
References
- Marchet A, Mocellin S, Ambrosi A, Morgagni P, Garcea D, Marrelli D, Roviello F, de Manzoni G, Minicozzi A, Natalini G. The ratio between metastatic and examined lymph nodes (N ratio) is an independent prognostic factor in gastric cancer regardless of the type of lymphadenectomy: results from an Italian multicentric study in 1853 patients. Ann Surg. 2007;245:543–552. doi: 10.1097/01.sla.0000250423.43436.e1. [DOI] [PMC free article] [PubMed] [Google Scholar]
- Yu JX, Wu YL, Yang LT. The value of metastatic lymph nodes ratio in predicting the prognosis of patients with T3 gastric carcinoma. Zhonghua Yi Xue Za Zhi. 2005;85:922–925. [PubMed] [Google Scholar]
- Bando E, Yonemura Y, Taniguchi K, Fushida S, Fujimura T, Miwa K. Outcome of ratio of lymph node metastasis in gastric carcinoma. Ann Surg Oncol. 2002;9:775–784. doi: 10.1007/BF02574500. [DOI] [PubMed] [Google Scholar]
- Inoue K, Nakane Y, Iiyama H, Sato M, Kanbara T, Nakai K, Okumura S, Yamamichi K, Hioki K. The superiority of ratio-based lymph node staging in gastric carcinoma. Ann Surg Oncol. 2002;9:27–34. doi: 10.1245/aso.2002.9.1.27. [DOI] [PubMed] [Google Scholar]
- Hyung WJ, Noh SH, Yoo CH, Huh JH, Shin DW, Lah KH, Lee JH, Choi SH, Min JS. Prognostic significance of metastatic lymph node ratio in T3 gastric cancer. World J Surg. 2002;26:323–329. doi: 10.1007/s00268-001-0227-9. [DOI] [PubMed] [Google Scholar]
- Kodera Y, Yamamura Y, Shimizu Y, Torii A, Hirai T, Yasui K, Morimoto T, Kato T, Kito T. Lymph node status assessment for gastric carcinoma: is the number of metastatic lymph nodes really practical as a parameter for N categories in the TNM Classification? Tumor Node Metastasis. J Surg Oncol. 1998;69:15–20. doi: 10.1002/(SICI)1096-9098(199809)69:1<15::AID-JSO4>3.0.CO;2-N. [DOI] [PubMed] [Google Scholar]
- Japanese Gastric Cancer Association Japanese Classification of Gastric Carcinoma – 2nd English Edition. Gastric Cancer. 1998;1:10–24. doi: 10.1007/PL00011681. [DOI] [PubMed] [Google Scholar]
- Sobin L, Wittekind C. International Union Against Cancer (UICC): TNM classification of malignant tumors. 6. New York: Wiley; 2002. [Google Scholar]
- Siewert JR, Bottcher K, Stein HJ, Roder JD. Relevant prognostic factors in gastric cancer: ten-year results of the German Gastric Cancer Study. Ann Surg. 1998;228:449–461. doi: 10.1097/00000658-199810000-00002. [DOI] [PMC free article] [PubMed] [Google Scholar]
- Wang Z, Zhan W, He Y. Lymph node metastasis versus peritoneal dissemination in patients with gastric cancer: analysis of the correlated factors and prognosis. Chinese J General Surgery. 2006;15:645–649. [Google Scholar]
- Yu W, Choi GS, Whang I, Suh IS. Comparison of five systems for staging lymph node metastasis in gastric cancer. Br J Surg. 1997;84:1305–1309. doi: 10.1002/bjs.1800840931. [DOI] [PubMed] [Google Scholar]
- Wu Y, Chen J, Yu J, Gao S, Shen H. A practical scoring system based upon ROC analysis for evaluating potential lymph nodes metastasis during gastric surgery. J Surg Oncol. 2006;93:534–540. doi: 10.1002/jso.20559. [DOI] [PubMed] [Google Scholar]
- Wu Y, Guo E, Yu J, Xie Q. High DcR3 expression predicts stage pN2–3 in gastric cancer. Am J Clin Oncol. 2008;31:79–83. doi: 10.1097/COC.0b013e3180ca77ad. [DOI] [PubMed] [Google Scholar]
- Yanagita S, Natsugoe S, Uenosono Y, Arima H, Kozono T, Ehi K, Arigami T, Higashi H, Aikou T. Morphological distribution of metastatic foci in sentinel lymph nodes with gastric cancer. Ann Surg Oncol. 2008;15:770–776. doi: 10.1245/s10434-007-9713-0. [DOI] [PubMed] [Google Scholar]
- Moll R, Lowe A, Laufer J, Franke WW. Cytokeratin 20 in human carcinomas. A new histodiagnostic marker detected by monoclonal antibodies. Am J Pathol. 1992;140:427–447. [PMC free article] [PubMed] [Google Scholar]
- Yanagita S, Natsugoe S, Uenosono Y, Arigami T, Arima H, Kozono T, Funasako Y, Ehi K, Nakajo A, Ishigami S, Aikou T. Detection of micrometastases in sentinel node navigation surgery for gastric cancer. Surg Oncol. 2008;17:203–210. doi: 10.1016/j.suronc.2008.04.008. [DOI] [PubMed] [Google Scholar]
- Nagata H, Arai T, Soejima Y, Suzuki H, Ishii H, Hibi T. Limited capability of regional lymph nodes to eradicate metastatic cancer cells. Cancer Res. 2004;64:8239–8248. doi: 10.1158/0008-5472.CAN-04-1182. [DOI] [PubMed] [Google Scholar]
- Yanagita S, Natsugoe S, Uenosono Y, Kozono T, Ehi K, Arigami T, Arima H, Ishigami S, Aikou T. Sentinel node micrometastases have high proliferative potential in gastric cancer. J Surg Res. 2008;145:238–243. doi: 10.1016/j.jss.2007.04.037. [DOI] [PubMed] [Google Scholar]


