Abstract
A rapid and selective method for simultaneous determination of cyclophosphamide and its metabolite carboxyethylphosphoramide mustard (CEPM) was developed using online sample preparation and separation with tandem mass spectrometric detection. Diluted plasma was injected onto an extraction column (Cyclone MAX 0.5×50 mm, > 30 μm), the sample matrix was washed with an aqueous solution, and retained analytes were transferred to an analytical column (Gemini 3μC18 110A, 100×2.0 mm) using a gradient mobile phase prior to detection by MS/MS. Analytes were detected in an API-3000 LC-MS/MS system using positive multiple reaction monitoring mode (m/z 261/140 and 293/221 for CTX and CEPM, respectively). Online extraction recoveries were 76% and 72% for cyclophosphamide and CEPM. Within-day and between-day variabilities were <3.0%, and accuracies were between −6.9% and 5.2%. This method has been used to measure plasma cyclophosphamide and CEPM concentrations in an ongoing Phase II study in children with newly diagnosed medulloblastoma.
Keywords: cyclophosphamide, carboxyethylphosphoramide mustard, high turbulence liquid chromatography and electrospray tandem mass spectrometry (HTLC, ESI-MS/MS)
1. Introduction
Cyclophosphamide, an oxazaphosphorine derivative, is one of the most widely used cytotoxic drugs, and it is currently used in the treatment of many adult and pediatric malignancies [1,2]. It is an inactive prodrug that requires enzymatic activation to form phosphoramide mustard, the active alkylating species [3]. The initial activation is catalyzed by hepatic cytochrome P-450 enzymes, which are the major pathway of elimination of the parent drug [4]. Hydroxylation of the oxazaphosphorine ring produces 4-hydroxycyclophosphamide (4-OHCTX), which is in aldo-keto equilibrium with the tautomer aldophosphamide. This spontaneously degrades to phosphoramide mustard and acrolein. Aldophosphamide may also be oxidized to carboxyethylphosphoramide (CEPM) by aldehyde dehydrogenase.
Cyclophosphamide has been in clinical use since the late 1950s, but very little has been published regarding the clinical pharmacokinetics of this compound and its metabolites in children with cancer [5]. This could in part be attributed to the difficulty in processing and measuring cyclophosphamide and 4-OHCTX plasma concentrations. 4-OHCTX is extremely unstable in biological fluids, and requires immediate bedside processing to stabilize the compound prior to analysis. Suitable internal standards are also very difficult to obtain for the analytical methods. However, the results of several studies have shown that systemic exposure to cyclophosphamide or its metabolites are related to pharmacologic effect. Specifically, McDonald and colleagues showed that exposure to CEPM was statistically related to liver toxicity after high-dose cyclophosphamide therapy, even after adjusting for age and radiation dosage, which are known risk factors for liver disease [6]. Thus, these authors showed that CEPM systemic exposure in this patient population was clinically significant, and suggested that monitoring cyclophosphamide pharmacokinetics may be clinically relevant [6].
Thus, to fully characterize the pharmacokinetics of cyclophosphamide and its metabolite CEPM in children with cancer will require the availability of a reliable, sensitive, and selective chromatographic assay method. Liquid chromatography with tandem mass spectrometry (LC-MS/MS) is currently the most widely used chromatographic approach to analyze small molecules in biological samples due to its high sensitivity, selectivity, and speed. To achieve optimal performance with LC-MS/MS, separation of matrix components from the analyte of interest requires sample preparation and processing. The routinely utilized approaches to sample processing and preparation including liquid-liquid extraction and solid phase extraction often become the rate- and cost-limiting factor in method development. Recently, online extraction, specifically turbulent flow chromatography, has been proposed as a method to remove matrix interference resulting in a cleaner sample that is introduced into the mass spectrometer. This has many advantages, including reducing ion suppression, improving throughput, and decreasing overall cost. To date, no analytical method with online extraction (i.e., TurboFlow chromatography with mass spectrometry; HTLC-ESI-MS/MS) for the simultaneous quantitation of cyclophosphamide and CEPM in human plasma has been published [7–9]. Herein, we describe a sensitive and specific online extraction HTLC–ESI-MS/MS method for measurement of both cyclophosphamide and CEPM in human plasma.
2. Experimental
2.1. Chemicals
Cyclophosphamide monohydrate (> 98% purity, C-0768, lot 43H0269) was purchased from Sigma (St. Louis, MO, USA). D6-cyclophosphamide (> 99% purity, Cat D655, tot 202) was purchased from Medical Isotopes, Inc (Pelham, NH 03076 USA). Carboxyethylphosphoramide mustard (CEPM) (> 98% purity, D-18849, CAS No 22788-18-7) was purchased from IIT GmbH (DE-33615 Bielefeld, Germany). D8-carboxyethylphosphoramide mustard (D8-CEPM) (> 77% purity, lot 1) was supplied by the Department of Chemical Biology and Therapeutics at St Jude Children’s Research Hospital (Memphis, TN, USA). HPLC grade acetonitrile (ACN) and methanol (MeOH) were obtained from Burdick & Jackson (Muskegon, MI, USA), whereas acetone, 2-propanol, and ammonium formate (Ultra ≥ 99%) were obtained from Fisher (Fairlawn, NJ, USA). Formic acid (> 95%), ammonium formate (HCOONH4; minimum 97.6%) and ammonium hydroxide (28–30%) were purchased from Sigma (St. Louis, MO, USA). Blank human plasma was obtained from Lifeblood (Memphis, TN, USA). All water was distilled, deionized, and further purified via a Millipore Milli-Q UV plus and Ultra-Pure Water System (Tokyo, Japan). Other chemicals were purchased from standard sources and were of the highest quality available.
2.2. Apparatus and conditions
2.2.1. Online extraction and chromatography
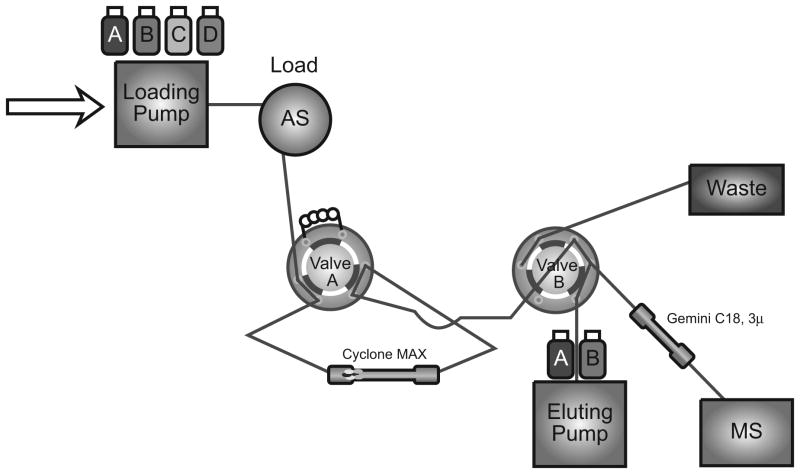
The Turboflow TLX-1 online extraction system was interfaced to a computer workstation running Aria® OS software (ThermoFisher Scientific, Franklin, MA), which contains both loading and eluting pumps with a proprietary valve-switching module. After an online injection of diluted plasma, a Cyclone MAX micro-bore large particle size column (0.5×50 mm, >30μm) was used to extract the analytes from human plasma. The chromatography of the analytes was performed at 50°C using a Gemini C18 (100×2.0 mm, 3μ) column preceded by a KrudKatcher disposable pre-column filter from Phenomenex (Torrance, CA, USA). The loading pump was coupled with a Shimadzu FCV-10ALvp and carried four loading solutions for the online extraction with the column: Loading Solution A (10mM HCOONH4, pH 10), Loading Solution B (the mixture of 40% IPA/40% ACN/20% acetone with 0.25% formic acid), Loading Solution C (the mixture of 35% ACN and 3mM HCOONH4, pH 3.5), and Loading Solution D (100% acetonitrile). The eluting pump delivered two eluting solutions for chromatographic separation on the analytical column with a gradient profile of (B% from 35 to 98): Eluting Solution A (3mM HCOONH4, pH 3.5) and Eluting Solution B (100% acetonitrile). A flow diagram and table of the focus mode for the HTLC method are depicted in Figure 1 (sample diagram of the focus mode on TLX-1) and Table 1.
Figure 1.
Flow diagram of the focus mode HTLC-MS/MS system
Table 1.
LC method for the focus mode HTLC online extraction method
| Step1 | Start | Sec2 | Loading pump Flow (mL/min) | Grad | %A | %B | %C | %D | Tee3 | Loop4 | Eluting pump Flow (mL/min) | Grad | %A | %B |
|---|---|---|---|---|---|---|---|---|---|---|---|---|---|---|
| 1 | 0.00 | 20 | 3.00 | Step | 100 | - | - | - | - | Out | 0.37 | Step | 98 | 2.0 |
| 2 | 0.33 | 120 | 0.07 | Step | 100 | - | - | - | T | In | 0.3 | Step | 98 | 2.0 |
| 3 | 2.33 | 60 | 2.00 | Step | - | 100 | - | - | - | In | 0.36 | Ramp | 65 | 35 |
| 4 | 3.33 | 45 | 2.00 | Step | - | 100 | - | - | - | Out | 0.37 | Step | 65 | 35 |
| 5 | 4.08 | 20 | 2.00 | Step | - | - | 80 | 20 | - | In | 0.38 | Ramp | 25 | 75 |
| 6 | 4.42 | 25 | 2.00 | Step | - | - | 80 | 20 | - | Out | 0.39 | Step | 2.0 | 98 |
| 7 | 4.83 | 25 | 2.00 | Step | - | - | 80 | 20 | - | In | 0.38 | Step | 98 | 2.0 |
| 8 | 5.25 | 90 | 2.00 | Step | 100 | - | - | - | - | Out | 0.37 | Step | 98 | 2.0 |
At each step, the mobile phases for both loading and eluting pump were introduced by step gradient
time as second
the loop connected to analytical column
the transfer loop connected to HT column
The plasma sample was diluted 3 times with 10% ACN water and then directly injected onto the micro-bore online extraction column. All the steps, times, flow rates, and % solutions used are listed in detail in Table 1. Briefly, cyclophosphamide, CEPM, and their internal standards (ISTDs) were retained on the extraction column while the plasma matrix components were rapidly washed out with 100% aqueous Loading Solution A for 20 s at a flow rate of 3.0mL/min. Analytes were eluted from the extraction column by back-flushing with 100% organic Loading Solution B. They were then transferred to the analytical column where baseline separation of cyclophosphamide and CEPM as well as ISTDs was accomplished. The analytes were eluted to the mass spectrometer using a linear two-step gradient (Eluting Solution B from 35% to 98% at flow rate 0.36mL/min for 115 s). The extraction column was washed with a combination of Loading Solution B, C, and D as specified in Table 1, and equilibrated with 100% Loading Solution A for 90 s at 2.0 mL/min prior to the next injection. The analytical column was also re-equilibrated with a higher aqueous content Eluting Solution (98%A/2%B) for 135 s at 0.38 mL/min prior to the next separation. We observed back pressure values of approximately 25 and 120 bars on the extraction and analytical column, respectively. Total run time for each sample was about 6.5 minutes per cycle, which included extraction, separation, and MS detection.
2.2.2. Mass spectrometry
Detection was performed on an API-3000 LC–MS/MS System (Toronto, Canada) equipped with a Turbo IonSpray® source (TIS; thermally and pneumatically assisted electrospray). The optimized conditions of MS/MS with electrospray and HTLC conditions were as follows: ion spray source temperature at 450°C, nebulizer (NEB) gas at 12, curtain (CUR) gas at 8.0, turbo gas flow at 5.0 L/min, ionspray voltage (IS) at 5500 V, and collision-activated dissociation (CAD) at 8.0 units; declustering potential (DP) at 36 V, focusing potential (FP) at 120 V, entrance potential (EP) at 10 V, collision energy (CE) at 25 V, and collision exit potential (CXP) at 24 V. The mass spectrometer was interfaced to a computer workstation running Aria® OS software and Analyst software (Version 1.4.1 Applied Biosystems, Foster City, CA) for data acquisition and processing. Data acquisition was performed via multiple-reaction monitoring (MRM). The ions representing the [M+H]+ species for both the analyte and internal standard were selected in MS1 and dissociated (collision-induced) with nitrogen gas to form specific product ions, which were subsequently monitored by MS2. The TIS interface and MS parameters were optimized to obtain maximum sensitivity at unit resolution. The precursor-to-product ion transitions monitored for cyclophosphamide, CEPM, D6-cyclophosphamide, and D8-CEPM were m/z 261→140, m/z 293→221, m/z, 267→126, and m/z 301→229, respectively.
2.3. Sample preparation
2.3.1. Stock solutions
Stock solutions were prepared by dissolving cyclophosphamide, CEPM, or the internal standards (ISTD) separately in a solution consisting of methanol/water/formic acid (80/20/0.1, v/v/v) to yield a concentration of 2.5 mg/mL for cyclophosphamide and D6-cyclophosphamide and 1.0 mg/mL for CEPM and D8-CEPM. Stock solutions were stored at −80 °C, and less than 5% of their nominal values were lost over 6 months. The working solutions (cyclophosphamide at 25, 250 μg/mL; CEPM at 5.0, 25, and 250 μg/mL; D8-CEPM at 25 μg/mL) were prepared at the time of assay from their stock solutions in the same manner.
2.3.2. Calibration curve and quality controls
The range of the calibration curves was made to reflect the range of expected plasma concentrations of cyclophosphamide and CEPM after administration of high-dose intravenous cyclophosphamide. Calibrators were made by adding working solutions of cyclophosphamide and CEPM to blank human plasma for final concentrations of cyclophosphamide 0.5, 1.0, 5.0, 10.0, 50.0, 100, and 150 μg/mL with 40μg/mL D6-cyclophosphamide, and CEPM 0.05, 0.10, 0.30, 0.5, 1.00, 6.00, and 10.0 μg/mL with 0.80μg/mL D8-CEPM. Three human plasma controls were prepared in triplicate using the same methodology at cyclophosphamide/CEPM concentrations of 0.70/0.06 μg/mL (Control 1), 15.0/0.60 μg/mL (Control 2), and 140/9.00 μg/mL (Control 3).
2.3.3. Plasma sample pretreatment
A total of 250 μL of spiked human plasma or patient plasma sample was spiked with 4.0μL of 2.5 mg/mL D6-cyclophosphamide and 8.0 μL of 25 μg/mL D8-CEPM in a 1.5mL centrifuge tube containing 500μL 10% ACN water and vortexed for 30 s, and then was centrifuged at 14,000 rpm for 5 min. The supernatant was transferred to an autosampler vial and10μL was injected onto the HTLC–ESI-MS/MS system.
2.4. Assay validation
2.5.1 Accuracy, precision, and linearity
The method developed for the measurement of cyclophosphamide and CEPM in human plasma was validated over five days by analysis of plasma quality control samples, and the within-day and between-day precision and accuracy for the method was determined. Two calibration curves were analyzed during the validation process. The linear regression of the ratio of both cyclophosphamide/D6-cyclophosphamide and CEPM/D8-CEPM peak areas were weighted by 1/x2. The coefficient of determination (R2) was used to evaluate the linearity of a calibration curve.
2.5.2 Selectivity and carryover
Selectivity of the assay was assessed by monitoring all selected ion transitions of CTX, CEPM, and their ISTDs after injection of blank human plasma from six different sources. Carryover was assessed by injecting cyclophosphamide/CEPM at 150/10 μg/ml and monitoring selected ion transitions of CTX, CEPM and their ISTDs through four blank plasma samples.
2.5.3 Ion suppression
Ion suppression was evaluated by post-column infusion of the analyte [10]. Briefly, a solution of neat cyclophosphamide (5 μg/mL), D6-cyclophosphamide (20 μg/mL), CEPM (0.25 μg/mL), and D8-CEPM (2 μg/ml) was infused, post-analytical column, through a Valco zero dead volume tee using a Harvard Apparatus syringe pump 11 (Harvard Apparatus, Holliston, MA, USA) at a constant flow rate of 5.0 μL/min into the LC effluent (300μL/min) prior to entering the mass spectrometer. Mobile phase solution and blank human plasma from 6 different sources were then injected onto the online extraction column for sample cleanup and then transferred onto the analytical column. Effluent from the HTLC combined with the infused compound, entered the electrospray interface and was analyzed under the operating conditions to evaluate the matrix effect, not only from one run, but also for late-eluting compounds that may not be detected until after several sequential analyses had been performed.
2.5.4 Stability
The stability of cyclophosphamide and CEPM at 4°C and room temperature (25°C) in human plasma for up to 24h and 50 h, respectively, and at −80°C for 135 days were evaluated at three concentrations (Controls 1, 2, and 3) for both analytes. The freeze-thaw stability of cyclophosphamide and CEPM at −80 °C was evaluated over three freeze-thaw cycles at three concentrations (Controls 1, 2, and 3) for both analytes.
2.6. Application of method to patient samples
Serial blood samples (1–2 ml) were collected from a pediatric patient after two 1.0 hr intravenous infusions of cyclophosphamide (2.0 g/m2) given 24 hrs apart. Samples (1–2 mL) were collected in k2 EDTA Vacutainer tubes (Plymouth, UK) and immediately centrifuged at 10,000 rpm for 3 min to separate the plasma. The plasma was removed and stored at −80 °C until analysis. Samples were diluted and then analyzed using the described method.
3. Results and discussion
3.1. Online sample extraction and chromatography
A widely used system to interface mass spectrometers with high turbulence liquid chromatography (HTLC) is the TLX-1 instrument coupled with Aria operating system [11,12]. It is now possible to develop online extraction and liquid chromatography-tandem mass spectrometry methods all on one TLX-1 instrument. The focus mode is commonly used for the online extraction of biological samples as this mode provides quick sample cleanup, rapid elution, sharp peaks, and low noise level. To successfully develop an online extraction method in the focus mode, the composition of the mobile phase, including the pH in both loading and eluting steps and the flow rate of the transfer step, must be carefully evaluated. First, during the extraction we used a TurboFlow column (0.5 mm i.d. × 50 mm length) rather than the conventional 1.0 mm i.d. column, which allowed for a reduced the flow rate (2.0 mL/min) without loss of extraction efficiency. Second, as the analytes were separated from the plasma matrix on the TurboFlow column, a wash with 100% aqueous loading solution A at pH 10, and a 100% combination-organic loading solution B with 0.25% formic acid was incorporated during the transfer step. This reduced the time for transfer of analytes between the extraction and the analytical column, which allowed for an optimized flow rate of 0.07 mL/min. In addition, a lower organic mobile phase (loading solution C: 35% acetonitrile in 3.0mM HCOONH4 at pH 3.5) was optimized to fill the transfer loop and reduce the combination-organic solvent strength via the tee while permitting a low organic eluting mobile phase containing 2% acetonitrile to focus the analytes prior to the analytical column. The analytes were then eluted by a gradient of acetonitrile from 35%–98%.
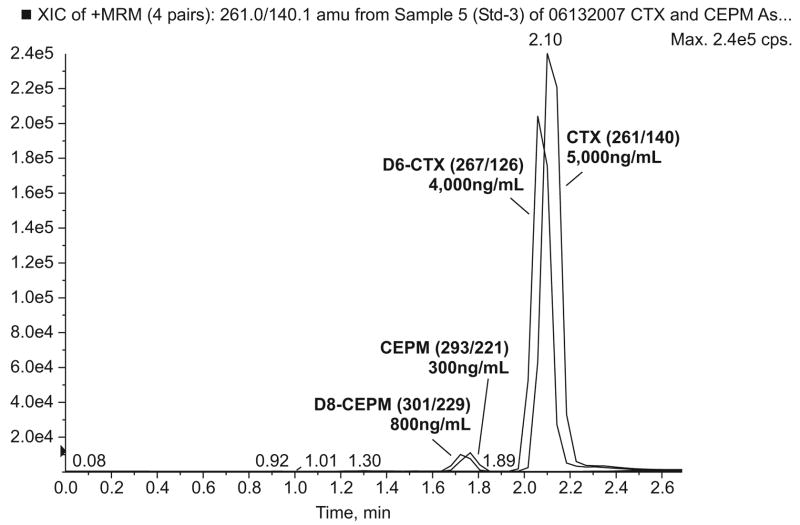
Finally, a Gemini C18 column with a smaller particle size and internal dimension (3μm and 2.0 mm i.d. × 100 mm length) was chosen for separation of cyclophosphamide and CEPM based upon their chemical structures and the column characteristics. The HPLC conditions were optimized to increase mass signal strength for both compounds in terms of counts per second (cps). An optimal gradient to improve signal response and peak separation was achieved by a gradient ACN from 2% to 35%, then to 75% and finally to 98% within 270 seconds. Column temperatures of 25°C, 30°C, 40°C, and 50°C were evaluated and a column temperature of 50°C resulted in the best signal response and a baseline separation within 5.0 min (data not shown). Under these conditions, the typical retention time was 1.75 min for CEPM/D8-CEPM and 2.10 min for cyclophosphamide/D6-cyclophosphamide (Figure 2).
Figure 2.
MRM chromatogram of human plasma spiked with cyclophosphamide and CEPM with ISTDs. (Note: cyclophosphamide with D6-cyclophosphamide and CEPM with D8-CEPM elute simultaneously at 2.1 min and at 1.75 min, respectively.)
3.2 Mass spectrometry
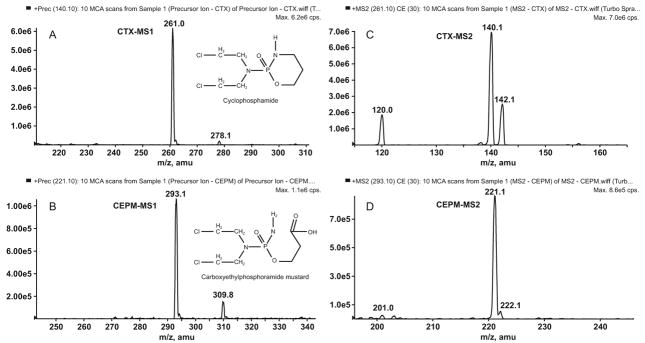
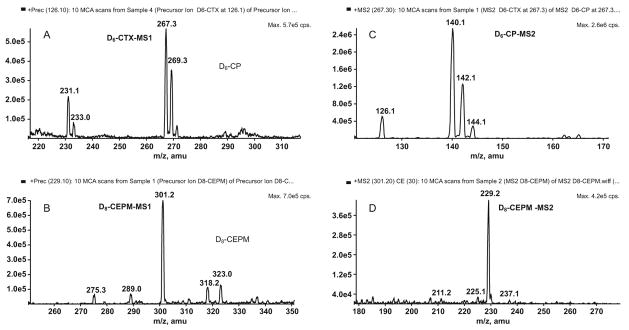
The full-scan MS1 positive-ion mass spectra, obtained by infusion of analytes in mobile phase, showed the protonated molecules [M+H]+ for cyclophosphamide at m/z 261 and CEPM at m/z 293 (Figure 3A,B). The protonated molecules [M+H]+ for the ISTDs D6-cyclophosphamide and D8-CEPM were seen at m/z 267 and 301, respectively (Figure 4A,B). The protonated molecules were selected as the precursor ions for MRM detection. The product ion full-scan spectrum of the cyclophosphamide [M+H]+ ion showed three major fragment ions at m/z 120, 140 and 142 (Figure 3C), whereas that of D6-cyclophosphamide showed four major fragment ions at m/z 126, 140, 142 and 144 (Figure 4C). The cyclophosphamide and D6-cyclophosphamide fragment ions at m/z 120 and 126 were chosen for MRM. The CEPM and D8-CEPM [M+H]+ ions each showed one major fragment ion at m/z 221 (Figure 3D) and 229 (Figure 4D), respectively, which were used for MRM.
Figure 3.
Positive-ion MS1 spectra for A) cyclophosphamide, and B) CEPM, and fragment ion MS2 spectra of precursor [M+H]+ ions of C) cyclophosphamide, and D) CEPM.
Figure 4.
Positive-ion MS1 spectra for the internal standards A) D6-cyclophosphamide, and B) D8-CEPM, and fragment ion MS2 spectra of precursor [M+H]+ ions of C) D6-cyclophosphamide, and D) D8-CEPM.
3.3. Assay validation
To assess within-day and between-day precision and accuracy, we evaluated validation parameters for cyclophosphamide and CEPM (Table 2). Ten injections of low, medium, and high concentration cyclophosphamide and CEPM control samples were made on days one and two to assess within-day variability and again on days three, four, and five to evaluate between-day variability. Variability was reported as relative standard deviation (%RSD) and accuracy was expressed as percentage error (%Error) in Table 2. The average recovery of plasma cyclophosphamide (0.5, 10, and 150 μg/mL in triplicate) and CEPM (0.05, 0.5, and 10 μg/mL in triplicate) in comparison to their neat samples at the same concentrations were 76% for cyclophosphamide (n = 3, SD = 2.06, CV = 4.29%) and 72% for CEPM (n = 3, SD = 1.37, CV = 3.14%). The plasma calibration curves were linear from 0.5 to 150 μg/mL for cyclophosphamide and from 0.05 to 10 μg/mL for CEPM, with correlation coefficients (R2) greater than 0.985 and 0.990, respectively. The lowest calibrator concentration, which was considered as the lower limit of quantitation (LLOQ), had a signal/noise >5 and within-day accuracy and precision of <20%.
Table 2.
Validation parameters of CTX and CEPM in human plasma
| Plasma CTX/CEPM (μg/mL) | Within-day (n=10) | Between-day (n= 5) | ||
|---|---|---|---|---|
| %RSD | %Error | %RSD | %Error | |
| 0.7/0.06 | 1.27/1.99 | 2.2/5.1 | 3.01/2.42 | 3.0/3.5 |
| 15.0/0.60 | 1.50/2.17 | 0.7/2.6 | 1.99/2.59 | 3.4/2.7 |
| 140/9.00 | 1.70/1.75 | −6.9/−5.2 | 2.36/1.85 | −5.2/−6.0 |
3.4. Selectivity, Carryover and Ion suppression
Selectivity of the assay was assessed by monitoring all selected ion transitions using blank human plasma from six different sources. No co-eluting peaks >10% of the cyclophosphamide and CEPM peak areas at the LOQ level, and no co-eluting peaks >5% of the peak area of the ISTDs were observed. After injection of cyclophosphamide/CEPM at 150/10 μg/ml, no carryover was seen through four sequential blank plasma samples.
Ion suppression is an important factor affecting the quantitative performance of a mass detector, especially when using an electrospray interface [13]. Ion suppression effects on both cyclophosphamide and CEPM were evaluated in mobile phase and TurboFlow Column extracted human blank plasma (n = 6). Shown in Figure 5 is the response obtained from a post-column infusion of cyclophosphamide, CEPM, and ISTDs during injection of mobile phase and blank human plasma from six sources. Elution times for cyclophosphamide and CEPM were 1.75 and 2.10 minutes, respectively. The relative standard deviations of each analyte/ISTD signal intensity ratio at the retention times of the analytes were <4.4%. These results demonstrate the absence of both relevant suppression or enhancement of CEPM and cyclophosphamide ion intensity at the analyte retention times with this HTLC-ESI-MS/MS method.
Figure 5.
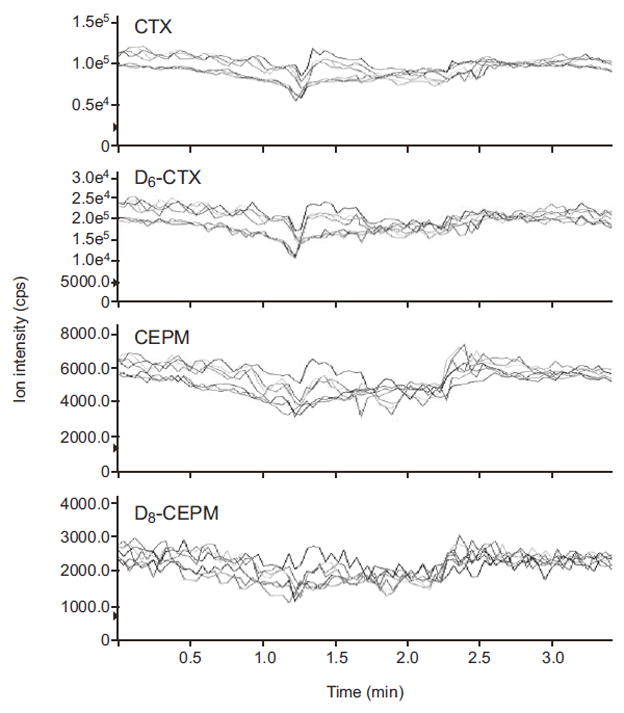
Infusion chromatograms for A) cyclophosphamide, B) D6-cyclophosphamide, C) CEPM, and D) D8-CEPM. A neat mixture of cyclophosphamide (5 μg/ml), D6-cyclophosphamide (20 μg/ml), CEPM (0.25 μg/ml), and D8-CEPM (2 μg/ml) was constantly infused, post-column, at a flow rate of 5.0 μL/min into the LC effluent while mobile phase and 6 blank plasma samples were injected into the column. The red line represents the mobile phase and other colors represent blank human plasma samples from six different sources.
3.5. Stability
Spiked plasma samples with low, medium, and high cyclophosphamide and CEPM concentrations (0.70/0.06, 15/0.6, and 140/9.0 μg/mL) were aliquotted in triplicate. Samples were stored separately at 4 °C (less than 6.2% and 8.5% change in 24 h for cyclophosphamide and CEPM, respectively; see Table 3a), 25 °C (less than 4.4% and 4.2% change for cyclophosphamide and CEPM in 24 h, respectively; see Table 3a), and −80 °C (less than 7.5% and 1.8% change in 135 days for cyclophosphamide and CEPM, respectively; see Table 3b). Internal standard was added to samples prior to injection and the stability for each concentration was determined. Data presented are the mean percent of initial concentration (<1 h) of three samples tested.
Table 3.
| Table 3a. Stability of CTX and CEPM in human plasma at 25°C and 4°C | |||||
|---|---|---|---|---|---|
| Plasma CTX/CEPM (μg/mL) | <1 h (PA × 105) | 24 h at 25°C (n = 3) in plasma | 24 h at 4°C (n = 3) In diluted plasma | ||
| 0.70/0.06 | 1.950/0.097 | 95.6/95.8 | 106.2/91.5 | ||
| 15.0/0.60 | 32.97/1.013 | 103.8/101.7 | 96.5/95.6 | ||
| 140/9.00 | 170.3/13.83 | 102.3/98.5 | 101.2/94.0 | ||
| Table 3b. Stability of CTX and CEPM in human plasma at −80 °C | |||||
|---|---|---|---|---|---|
| Pls CTX/CEPM (μg/mL) | <1 day (μg/mL) | 18 days (μg/mL) | 80 days (μg/mL) | 91 days (μg/mL) | 135 days (μg/mL) |
| 0.70/0.06 | 0.706/0.058 | 100.7/101.8 | 106.3/96.2 | 97.1/101.0 | 92.5/98.2 |
| 15.0/0.60 | 15.43/0.582 | 100.4/96.0 | 99.8/97.7 | 90.6/95.2 | 94.3/99.7 |
| 140/9.00 | 134.7/8.430 | 98.0/101.1 | 94.3/109.7 | 98.0/99.7 | 106.6/100.5 |
| Table 3c. Stability of plasma CTX and CEPM in 3 freeze-thaw cycles | |||||
|---|---|---|---|---|---|
| Plasma CTX/CEPM (μg/mL) | 1st cycle | 2nd cycle | 3rd cycle | ||
| 0.70/0.06 | 100.2/102.1 | 100.8/98.5 | 101.8/99.1 | ||
| 15.0/0.60 | 100.5/99.4 | 101.8/92.8 | 103.3/97.7 | ||
| 140/9.00 | 101.5/103.9 | 98.9/96.6 | 98.0/98.8 | ||
The Testing samples were separately stored (in triplicate) at 25 and 4°C and analyzed up to 24 h. Stability was assessed by the peak area of each compound. Data is expressed as mean percent of initial peak areas tested at 1 h.
Spiked samples (0.70/0.06, 15.0/0.60, and 140/9.00 μg/mL) were aliquotted in duplicate and stored at −80 °C. Samples were then assayed over 4.5 months and stability was assessed by the ratio of peak area (ΔCTX:D6-CTX and ΔCEPM:D8-CEPM). Data presented is mean % of initial peak ratio of three samples tested in duplicate.
To evaluate the freeze-thaw stability of cyclophosphamide and CEPM in plasma at −80 °C, we evaluated three concentrations of cyclophosphamide and CEPM (0.70/0.06, 15/0.6, and 140/9.0 μg/mL) that were stored at −80 °C overnight. The next day samples were thawed at room temperature for 15–20 min, an aliquot from each of the samples was analyzed on the HTLC-ESI-MS/MS in duplicate. The remaining unprocessed sample was returned to −80 °C storage until subsequent freeze-thaw tests. This was done for a total of three freeze-thaw cycles. After three freeze-thaw cycles, the cyclophosphamide controls had <3.3% change from baseline and the CEPM controls had 2.3% loss compared with baseline (see Table 3c).
3.6. Application of assay in patient blood sample
Plasma samples from a newly diagnosed patient with medulloblastoma receiving cyclophosphamide (2 g/m2 intravenously) were analyzed to demonstrate the clinical applicability of the method. Serial samples were collected, processed, and analyzed according to the methods described in this report. A representative plasma concentration-time profile for both cyclophosphamide and CEPM after intravenous cyclophosphamide administration is depicted in Figure 6.
Figure 6.
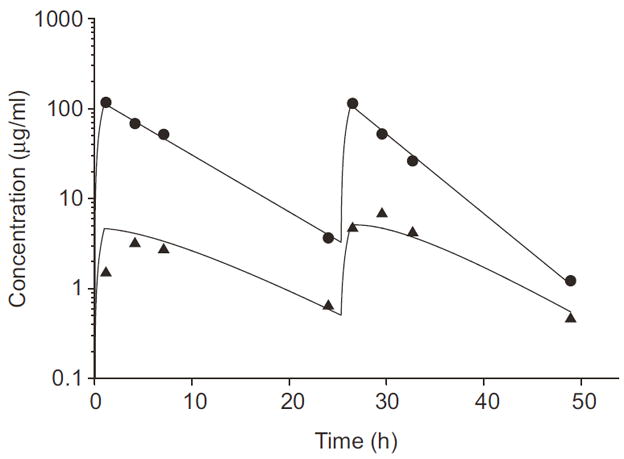
Cyclophosphamide and CEPM plasma concentration–time profile in a pediatric patient after two cyclophosphamide doses of 2 g/m2 given as 1 hr intravenous infusions. Plasma cyclophosphamide concentration–time points (●) are plotted and the solid line represents the best-fit curve resulting from the pharmacokinetic analysis. Plasma CEPM concentration-time points (▲) are plotted and the dashed line represents the best-fit curve resulting from the pharmacokinetic analysis.
4. Conclusion
We report here an online extraction HTLC–ESI-MS/MS method for the rapid and precise quantitation of cyclophosphamide and its metabolite, CEPM in human plasma samples. This method is rapid and selective, which further enhances its utility as an analytical method for use in clinical pharmacokinetic studies of cyclophosphamide and CEPM. Moreover, the use of turbulence flow online sample extraction decreases sample preparation time, saves labor, and reduces consumable expense. The use of a narrow-bore short column with a low flow rate reduces solvent costs and minimizes environmental impact of toxic solvents. This method was developed to facilitate the quantitation of cyclophosphamide and CEPM in human plasma samples and performs with sufficient precision (CV ≤ 3.0%) and accuracy (−6.9 ≤ %Error ≤ 5.1), for application in clinical studies of cyclophosphamide pharmacokinetics in both pediatric and adult populations. Finally, we have successfully applied this online extraction HTLC–ESI-MS/MS method by measuring cyclophosphamide and CEPM in relevant human plasma from a clinical pharmacokinetic study in a child treated with intravenous cyclophosphamide.
Acknowledgments
This research was supported by NIH Awards PO1 CA 23099, Cancer Center Support (CORE) Grant CA 21765, and ALSAC. The authors also acknowledge the kind technical assistance of Dr. Francois A. Espourteille, Sarah Vannozzi, Sherry Gregory, and Matt Weiss from ThermoFisher Scientific in support of TLX-1 installation and HTLC method development. We also thank Julie Groff for her assistance with the figures.
Footnotes
Publisher's Disclaimer: This is a PDF file of an unedited manuscript that has been accepted for publication. As a service to our customers we are providing this early version of the manuscript. The manuscript will undergo copyediting, typesetting, and review of the resulting proof before it is published in its final citable form. Please note that during the production process errors may be discovered which could affect the content, and all legal disclaimers that apply to the journal pertain.
References
- 1.Poole CJ, Earl HM, Hiller L, Dunn JA, Bathers S, Grieve RJ, Spooner DA, Agrawal RK, Fernando IN, Brunt AM, O’Reilly SM, Crawford SM, Rea DW, Simmonds P, Mansi JL, Stanley A, Harvey P, McAdam K, Foster L, Leonard RC, Twelves CJ. N Engl J Med. 2006;355:1851. doi: 10.1056/NEJMoa052084. [DOI] [PubMed] [Google Scholar]
- 2.Gajjar A, Chintagumpala M, Ashley D, Kellie S, Kun LE, Merchant TE, Woo S, Wheeler G, Ahern V, Krasin MJ, Fouladi M, Broniscer A, Krance R, Hale GA, Stewart CF, Dauser R, Sanford RA, Fuller C, Lau C, Boyett JM, Wallace D, Gilbertson RJ. Lancet Oncol. 2006;7:813. doi: 10.1016/S1470-2045(06)70867-1. [DOI] [PubMed] [Google Scholar]
- 3.Boddy AV, Yule SM. Clin Pharmacokinet. 2000;38:291. doi: 10.2165/00003088-200038040-00001. [DOI] [PubMed] [Google Scholar]
- 4.Huang Z, Roy P, Waxman DJ. Biochemical Pharmacology. 2000;59:961. doi: 10.1016/s0006-2952(99)00410-4. [DOI] [PubMed] [Google Scholar]
- 5.Yule SM, Price L, Cole M, Pearson AD, Boddy AV. Cancer Chemother Pharmacol. 2001;47:222. doi: 10.1007/s002800000220. [DOI] [PubMed] [Google Scholar]
- 6.McDonald GB, Slattery JT, Bouvier ME, Ren S, Batchelder AL, Kalhorn TF, Schoch HG, Anasetti C, Gooley T. Blood. 2003;101:2043. doi: 10.1182/blood-2002-06-1860. [DOI] [PubMed] [Google Scholar]
- 7.Anderson LW, Ludeman SM, Colvin OM, Grochow LB, Strong JM. J Chromatogr B Biomed Appl. 1995;667:247. doi: 10.1016/0378-4347(95)00036-i. [DOI] [PubMed] [Google Scholar]
- 8.Kalhorn TF, Howald WN, Cole S, Phillips B, Wang J, Slattery JT, McCune JS. J Chromatogr B Analyt Technol Biomed Life Sci. 2006;835:105. doi: 10.1016/j.jchromb.2006.03.022. [DOI] [PubMed] [Google Scholar]
- 9.Barbieri A, Sabatini L, Indiveri P, Bonfiglioli R, Lodi V, Violante FS. Rapid Commun Mass Spectrom. 2006;20:1889. doi: 10.1002/rcm.2527. [DOI] [PubMed] [Google Scholar]
- 10.Annesley TM. Clinical Chemistry. 2003;49:1041. doi: 10.1373/49.7.1041. [DOI] [PubMed] [Google Scholar]
- 11.Du L, Musson DG, Wang AQ. Rapid Commun Mass Spectrom. 2005;19:1779. doi: 10.1002/rcm.1984. [DOI] [PubMed] [Google Scholar]
- 12.Xu RN, Fan L, Rieser MJ, El-Shourbagy TA. J Pharm Biomed Anal. 2007;44:342. doi: 10.1016/j.jpba.2007.02.006. [DOI] [PubMed] [Google Scholar]
- 13.Bai F, Minkin P, Fraga CH, O’Shaughnessy MA, Gururangan S, Stewart CF. J Chromatogr B Analyt Technol Biomed Life Sci. 2007 doi: 10.1016/j.jchromb.2007.02.062. [DOI] [PubMed] [Google Scholar]


