

Since its passage in 1965, Medicare has provided financial support for much of the acute medical care provided to the nation's aged and disabled. Over the years since the program was enacted, however, the cost of these services has increased dramatically, raising concerns about how to make the system more efficient.
At first, payments to providers were based on the actual costs of delivering the care. In the early 1980s, Medicare moved its largest providers, acute care hospitals, to per-case payments based on the medical diagnoses for which the care was being provided (called DRGs, or diagnosis-related groups). This change gave hospitals an incentive to keep their treatment costs for each patient as small as possible. Inherent in such a system, however, are incentives to underserve beneficiaries by moving them out of care too quickly.
In 1997, the Balanced Budget Act (BBA) further reformed Medicare payments by extending per-case payment methodologies to all types of postacute care. In the early 1990s the use of all these services rose sharply because of both shortened hospital stays and class-action lawsuits in the late 1980s (Fox v. Bowen 1986 and Duggan v. Bowen 1988), which liberalized the definitions of eligibility for service provision and coverage. These changes, in turn, led to substantial increases in the number of providers and in the Medicare expenditures for these services.
From 1990 to 1996, expenditures increased by 350 percent for home health care agencies and almost 400 percent for skilled nursing facilities (SNFs). The expenditures for rehabilitation hospitals more than doubled from 1990 to 1994, and those for long-term care (LTC) hospitals increased by 300 percent (CMS 2000; ProPAC 1997). These increases raised concerns about not only the viability of the Medicare trust fund but also fraud and abuse by providers.
The BBA sought the future enactment of prospective payment systems (PPSs) for all these postacute care services as well as immediate relief from the dramatic increases in expenditures for home health care—a benefit widely thought to be provided inefficiently before the BBA—through the enactment of a home health care interim payment system (IPS). However, while the purpose of the reforms was to make the system more efficient, there also was concern that the IPS might result in less access by beneficiaries to needed home health care services, the substitution of more expensive kinds of postacute care, and/or an overall decline in the quality of care provided.
This article looks at the changes in the use of posthospital care services after the BBA was enacted and whether the number of adverse outcomes has risen, as measured by rehospitalizations, emergency room visits, and death. We first outline the BBA's postacute care service reforms, review previous research on posthospital care, and describe our research questions. We then discuss our methodology and findings and conclude with a discussion of the policy implications.
The Balanced Budget Act of 1997
The BBA substantially altered the payment of Medicare postacute care services. The changes were most immediate for home health care, one of Medicare's most popular services and one for which eligibility for coverage was most subjective. Patients discharged from acute care hospitals often need continued recuperative care in less intensive facilities or in their homes. Medicare will provide for this coverage if the patient meets specific eligibility criteria. Usually the patient's primary care physician, a hospital discharge planner (an employee of the hospital), the patient, and/or his or her family discuss and decide on options for further placement when the patient is discharged from the hospital. Providers are also part of this process as they decide whether the patient is a candidate for admission to their facility.
By 1995, many policymakers were concerned that the rapid increase in Medicare expenditures might be due to fraudulent and abusive billings. These billings were for providing services to ineligible beneficiaries, providing too many services, or providing services after a beneficiary's eligibility should have ended. In that same year, three government agencies—the Health Care Financing Administration (HCFA, now the Centers for Medicare and Medicaid Services [CMS]), the Administration on Aging (AOA), and the Office of the Inspector General (OIG)—created Operation Restore Trust (ORT). ORT provided for audits, criminal investigations, surveys, inspections, and the use of consumer hotlines to identify fraud and abuse in home health care agencies, nursing homes, and medical equipment suppliers. Initially begun in five states, ORT was expanded to 18 by 1998.
The Health Insurance Portability and Accountability Act (HIPAA) of 1996 also tried to strengthen the enforcement of home health care eligibility rules by imposing civil and monetary penalties on physicians who knowingly certified ineligible patients. In September 1997, HCFA implemented a six-month moratorium on certifying new home health care agencies and stepped up its cost audits and medical reviews of claims.
But despite these efforts, expenditures continued to rise, and administrative and legislative officials became increasingly interested in initiating payment reforms that would move all postacute care providers away from cost-based reimbursement systems. Under the BBA, HCFA was required to implement prospective payment systems for all these providers. Prospective payments for skilled nursing facilities (SNFs) began to be phased in in July 1998 but were not in place in either rehabilitation hospitals or LTC hospitals during our period of study.
Because expenditures on home health care were rising so rapidly and the PPS could not be put in place immediately, an interim payment system (IPS) was phased in, beginning October 1997 with the start of each agency's cost reporting period. The IPS limited reimbursement to agencies by both reducing the per-visit cost limits in place at the time and adding an aggregate per-beneficiary payment limit. This effectively limited the payments per agency by both the cost per visit (reduced from 112% of the mean national cost per visit to 105%) and the average payments per beneficiary per year applied on an aggregate basis. The aggregate average beneficiary cost limit for each agency was based on its 1994 cost reports: 75 percent of the agency's average patient cost and 25 percent of the average patient cost in the agency's census region.
Eligibility for Medicare home health care is limited to beneficiaries who are “homebound,” need “intermittent” skilled nursing or therapy services, and are under the care of a physician who is prescribing their plan of care. A beneficiary needing only personal care does not qualify. The IPS legislation also clarified some of the home health care eligibility criteria, such as excluding venipuncture (drawing blood) as a basis for qualifying for home health care services. Prior to this, some agencies and physicians used venipuncture to qualify beneficiaries who had no other skilled needs, thus making them eligible for the Medicare-funded personal care services.
It was widely reported that some home health care agencies misunderstood the IPS's per-beneficiary limit, believing that it was imposed on an individual rather than an aggregate basis, thereby increasing their reluctance to accept any patients who would require more than the average amount of treatment. In addition, to intensify agency incentives to refuse to admit ineligible beneficiaries, in June 1998 payments for home health care were required to be made “in sequence,” in this way tying up all Medicare reimbursement for any beneficiary who had a claim under review. This “sequential billing requirement” could cause cash-flow problems for agencies with questionable admissions, thus making them cautious about admitting Medicare beneficiaries who might later be deemed ineligible. In January 1999, OIG further raised the stakes for noncomplying physicians by issuing a Special Fraud Alert, which imposed criminal penalties (in addition to civil penalties) on physicians who falsely certified a medical necessity for home health care.
Thus the atmosphere post BBA emphasized the seriousness of the federal interest in closely regulating compliance with eligibility and coverage rules; in moderating cost escalations in the interim; and in imposing prospective payment systems that would require significant new administrative functions. Accordingly, physicians and agencies had incentives to be very careful to authorize or provide care only to eligible Medicare beneficiaries. Once a beneficiary was in care, the agency had incentives to be sure that his or her home health care treatment plan was designed to minimize total expenditures without increasing the actual cost per visit, a tricky proposition in an era of heightened expectations and greater administrative demands.
Previous Research on Posthospital Care
The earliest research on posthospital care was conducted for government agencies in order to monitor the effects of the hospital PPS. The Rand Corporation conducted several utilization studies, which examined data for random samples of Medicare hospital discharges before the PPS, immediately after the PPS, and three years later. These studies demonstrated the interrelationships between Medicare hospital use and postacute care use and how they could be affected by changes in reimbursement policy. The researchers found an immediate decrease in the length of hospital stays and increases in the use of home health care and skilled nursing care. Three years later, hospital stays were slightly longer than they had been just before the PPS was implemented; the use of skilled nursing facilities (SNFs) had fallen from that in the period immediately after PPS; but the use of home health care continued to rise (Neu and Harrison 1988; Neu, Harrison, and Heilbrunn 1989).
Other studies looked at the quality of care for selected diagnosis-related groups (DRGs), using both administrative and clinical data (Kane 1994; Kane et al. 2000; Steiner and Neu 1993). The clinical assessment examined factors associated with discharge to a particular type of postacute care and the outcomes for each type. This study found that patients who lived alone and were more functionally dependent were more likely to need institutional rather than home health postacute care. These findings also suggested that those receiving SNF care fared worse than did those receiving home health care or sent to a rehabilitation hospital, which might indicate differences in outcomes for alternative kinds of postacute care.
By the mid-1990s, as the importance of postacute care grew, several studies were conducted to better understand how the benefit was being used. An analysis of data from the Medicare Current Beneficiary Survey (MCBS) by Liu, Wissoker, and Rimes (1998) confirmed the earlier findings from Kane's analysis (1994) that older and unmarried beneficiaries were more likely to be in a SNF than to receive home health care. A review of Medicare claims identified the most prevalent DRGs receiving posthospital care and analyzed the incidence of use of various types of posthospital care. Researchers found that one-fifth of those receiving postacute care received more than one type of care, demonstrating that postacute care is often a continuum of services (Liu et al. 1999). Using the same database, Barbara Gage (1999a) looked at whether similar populations were being treated by different postacute care providers and concluded that for some DRGs (stroke, hip fracture) but not for others (chronic obstructive pulmonary disease [COPD], heart failure). the type of postacute care was related to the severity of the illness.
Research Questions
Our study analyzed the patterns of postacute care use for Medicare beneficiaries just before and after the BBA was enacted, and also explored whether potential adverse outcomes were more common after the BBA was enacted. During the period of our study, the home health care IPS was in effect; SNF prospective payment was just beginning to be instituted; and rehabilitation and LTC hospitals remained under cost reimbursement. The natural experiment created by the home health care reforms culminating with the 1997 BBA's interim payment system offered us an opportunity to examine the impact of changed incentives on service provision and outcomes. The heightened attention to compliance with eligibility and coverage rules combined with the IPS's more stringent payment methodology could result in fewer referrals to and/or acceptance for home health care, and thereby either the substitution of other types of postacute care or an increase in the number of beneficiaries receiving no postacute care.
While the goal of the IPS and the administrative and legislative reforms was to rein in what was perceived as an expanding and inefficient home health care benefit, there was concern that they would change home health care agencies’ behavior toward those Medicare beneficiaries needing the most care (Gage 1999b; Komisar and Feder 1998; Lewin Group 1998; Smith, Rosenbaum, and Schwartz 1998; U.S. GAO 1998). That is, in reaction, agencies could reduce the number of visits, shift the mix of visits, or not accept certain high treatment cases. For example, in interviews with home health care agencies and discharge planners, Smith, Maloy, and Hawkins (1999, 2000) found that after the BBA was enacted, it became more difficult for sicker and more vulnerable beneficiaries, especially those with diabetes, to receive care, and a little more than 40 percent of discharge planners believed that the percentage of home health patients who had a hospital readmission increased post BBA. In addition, these reforms, coupled with the need to collect a large amount of new information about each beneficiary, resulted in closures and consolidations in the industry.
Whereas other studies documented the dramatic declines in the use of home health care during the IPS period and found few adverse impacts on home health care users (Laguna Research Associates 2002; McCall et al. 2001, 2003; U.S. GAO 2000), our study addressed the BBA's impact on the overall system. We explored the utilization and outcomes for all beneficiaries discharged from acute care hospitals, that is, including those not receiving postacute care and those going to institutional care, not just those receiving home health care. We looked for any differences in the pattern of postacute care utilization for particular DRGs. Because any changes could be based on the patient's particular diagnosis, we examined pattern shifts for DRGs representing both those patients with distinct rehabilitative needs such as hip fractures and stroke discharges and those with more chronic long-term care needs such as heart failure, diabetes, and COPD. For example, patients discharged with DRGs typically associated with chronic care needs may have experienced larger decreases in the incidence, amount, and kind of postacute care use.
We also studied whether these shifts resulted in an increased incidence of adverse outcomes. To the extent that individuals were not receiving substitute services, or the services they were receiving were less appropriate, we hypothesized that they could have a greater incidence of rehospitalizations, emergency room visits, or even death.
Methodology
Data
Our analysis used a specially constructed data file from the CMS 5 percent sample of Medicare beneficiaries. The sample includes all live hospital discharges having five specific DRGs in the first six months of fiscal year (FY) 1997, the last full year before the home health care IPS began to be implemented, and during the first six months of FY 1999, the first full year after the IPS was fully implemented. The analysis file includes information on the utilization of Medicare part A services (hospital, home health care, SNF, rehabilitation hospital, and LTC hospital) during patients’ postacute care episode and for 60, 120, and 180 days after the date of their discharge from the hospital. We defined an episode of postacute care as a series of postacute care services separated by not more than 31 days between the services or an acute hospital admission, up to a maximum of 180 days. The population we studied was restricted to Medicare fee-for-service beneficiaries eligible for part A who resided in one of the 50 states or the District of Columbia. The data are linked to information from the CMS Medicare eligibility file and the Area Resources File.
Analytical Approach
This study shows how the pattern of postacute care changed, compares the use of postacute care services during the episode and for 120 days after the hospital discharge, and examines whether the incidence of adverse outcomes increased. For this last analysis we used logistic regression models with the dependent variable a dummy variable indicating whether the beneficiary had a particular outcome. The independent variables in the model included whether the observation was in the post-BBA period and a set of control variables.
Selection of DRGs
In selecting the DRGs to use for the study, we reviewed previous research (Kane 1994; Liu, Long, and Rimes 1999; Meiners and Coffey 1985; Neu and Harrison 1988) and published statistics (CMS statistical supplements and on-line data), and examined data in a 1 percent sample of Medicare claims. This latter examination looked at DRG incidence, postacute care use, and the distributions of diagnoses and procedure codes for selected DRGs. We also discussed typical postacute care treatment regimes with a gerontologist. We wanted to select DRGs having a sufficient number of discharges, likely to use postacute care services, and representing different needs for postacute care. Earlier studies (McCall et al. 2001, 2003) identified groups with lower- or higher-than-average reductions in home health care use after the BBA, and we also included that as a factor in our selection.
Based on these considerations we chose five DRGs: stroke (DRG 014), COPD (DRG 088), heart failure (DRG 127), hip fracture (DRG 210), and diabetes (DRG 294). In 1995, these five DRGs made up approximately 30 percent of the 32 most prevalent DRGs discharges to postacute care (Liu et al. 1999). Three of these DRGs—COPD (088), diabetes (294), and heart failure (127)—are chronic conditions that often can be discharged directly to home health care. The other two—stroke (014) and hip fracture (210)—are short- to medium-term high-intensity conditions that more typically are discharged to an institutional setting before progressing to home health care.
Defining the Outcomes
Defining outcomes is difficult because of the general lack of consensus on what kind of quantifiable outcomes can be expected from postacute care (Weissert, Chernew, and Hirth 2001). Obviously, death, hospitalization, and emergency room (ER) use are undesirable events, but how closely they can be tied to the care delivered to an individual is debatable, especially among members of a population that is deteriorating because of advancing age and increasing disability. Nonetheless, these measures are among the few available from claims data to provide insight about changes in the outcome of care. A number of studies of postacute care examined these types of utilization-defined outcomes (Chen 2000; Hedrick and Inui 1986; Hedrick, Koepsell, and Inui 1989; Hughes et al. 1997; Kane et al. 1994; Kemper, Applebaum, and Harrigan 1988; Schore 1994, 1995; Shaughnessy, Schlenker, and Hittle 1994; Weissert 1985; Weissert, Cready, and Pawelak 1988; Weissert and Hedrick 1994).
We defined six outcomes measures. They related to being rehospitalized, having an ER visit, or dying within 60, 120, and 180 days from the date of hospital discharge. The outcome variables for readmissions and ER visits included one for all admissions or visits and one for those with diagnoses within the same body system. We also included as an outcome measure being admitted to a hospital for a diagnosis that was thought could be avoided with good primary care (Blustein, Hanson, and Shea 1998; Culler, Parchman, and Przybylski 1998; Murtaugh and Litke 2000; Pappas et al. 1997; Weissman, Constantine, and Epstein 1992). We did not have data on admissions to chronic care nursing homes or assisted living facilities, services that could be paid for by Medicaid, private health insurance, or the patients themselves; such information would represent an important outcome measure if data on their use were available.
Specifying the Control Variables
We estimated the probability of having a specific outcome in a logistic regression that included an independent variable for the post-BBA period and a set of independent variables to control for the differences between the pre- and post-BBA periods. The control variables fell into four groups: (1) data on the demographic characteristics of the beneficiaries (age, gender, race, Medicaid buy-in status, original reason for entitlement); (2) data on the beneficiaries’ prior use of Medicare Part A services (number of inpatient days six months before the hospital admission, number of SNF days six months before the hospital admission) adjusted for time trends; (3) data on the hospitalization (length of hospital stay adjusted for time trends, primary diagnosis); and (4) data on the communities in which they lived, including general information (urbanization, census region, Medicare managed care penetration), supply of health resources (hospital occupancy, number of nursing home beds per 100 persons 65+ years of age, home health care employees per 100 persons 65+ years of age), and historical Medicare and Medicaid health care and home health care use. Not available to use as control variables was information on living arrangements, functional limitations, or clinical severity. (See appendix A for a complete specification of all the dependent and independent variables.)
Results
We first describe the sequence of settings and the number of services during the postacute care episode and then examine the pattern of use and expenditures for postacute care for a fixed period after the discharge. Because the length of time in postacute treatment was smaller in the post-BBA period, this comparison was a more accurate reflection of the costs to the Medicare program during the two time periods. Finally, using logistic regression models, we look at whether the incidence of adverse outcomes between the two periods changed.
The Postacute Care Episode
Settings
Table 1 shows the distribution of first and second postacute care settings before and after the enactment of the BBA for the five DRGs. As can be seen, there was a dramatic falloff for all DRGs in home health care, in both initial care and subsequent treatment.
TABLE 1.
First and Second Postacute Care Use during the Postacute Episode, Pre- and Post-BBA
| DRG 014 Stroke | DRG 088 COPD | DRG 127 Heart Failure | DRG 210 Hip Fracture | DRG 294 Diabetes | ||||||
|---|---|---|---|---|---|---|---|---|---|---|
| Pre | Post | Pre | Post | Pre | Post | Pre | Post | Pre | Post | |
| First Postacute Care Service Type | ||||||||||
| (N = 7,162) | (N = 6,228) | (N = 7,966) | (N = 8,461) | (N = 13,035) | (N = 12,503) | (N = 3,051) | (N = 2,820) | (N = 1,591) | (N = 1,563) | |
| None | 29.9 | 33.8 | 61.6 | 68.2 | 53.4 | 60.6 | 10.3 | 10.3 | 52.1 | 59.0 |
| Home health | 23.1 | 16.9 | 29.5 | 21.3 | 34.9 | 26.5 | 13.0 | 8.7 | 36.8 | 29.1 |
| SNF | 30.0 | 30.4 | 8.3 | 9.1 | 11.0 | 11.8 | 60.9 | 63.2 | 10.3 | 11.0 |
| Rehabilitation hospital | 16.3 | 17.7 | 0.5 | 0.7 | 0.6 | 0.7 | 15.0 | 16.9 | 0.6 | 0.6 |
| LTC hospital | 0.7 | 1.2 | 0.2 | 0.6 | 0.1 | 0.3 | 0.8 | 0.9 | 0.3 | 0.3 |
| Second Postacute Care Service Type | ||||||||||
| Initial Home Health | (N = 1,653) | (N = 1,053) | (N = 2,347) | (N = 1,806) | (N = 4,546) | (N = 3,319) | (N = 397) | (N = 245) | (N = 585) | (N = 455) |
| None | 84.7 | 86.8 | 93.3 | 95.1 | 94.8 | 94.3 | 64.2 | 75.1 | 95.0 | 95.6 |
| SNF | 11.8 | 9.4 | 6.0 | 4.0 | 4.8 | 5.1 | 25.7 | 20.0 | 4.3 | 3.5 |
| Rehabilitation hospital | 3.2 | 3.6 | 0.3 | 0.5 | 0.4 | 0.4 | 9.1 | 4.5 | 0.7 | 0.7 |
| LTC hospital | 0.3 | 0.2 | 0.4 | 0.4 | 0.1 | 0.2 | 1.0 | 0.4 | 0.0 | 0.2 |
| Initial SNF | (N = 2,146) | (N = 1,894) | (N = 658) | (N = 772) | (N = 1,435) | (N = 1,478) | (N = 1,857) | (N = 1,781) | (N = 164) | (N = 172) |
| None | 70.5 | 74.3 | 67.2 | 74.2 | 72.1 | 73.7 | 63.1 | 66.5 | 74.4 | 75.6 |
| Home health | 24.4 | 21.0 | 31.8 | 25.5 | 27.7 | 25.5 | 35.3 | 31.7 | 25.0 | 24.4 |
| Rehabilitation hospital | 4.9 | 4.3 | 0.9 | 0.0 | 0.2 | 0.7 | 1.5 | 1.6 | 0.6 | 0.0 |
| LTC hospital | 0.2 | 0.4 | 0.2 | 0.3 | 0.0 | 0.1 | 0.2 | 0.2 | 0.0 | 0.0 |
| Initial Rehabilitation | (N = 1,170) | (N = 1,100) | (N = 37) | (N = 62) | (N = 73) | (N = 90) | (N = 458) | (N = 477) | (N = 9) | (N = 10) |
| None | 35.4 | 45.3 | 45.9 | 56.5 | 35.6 | 40.0 | 21.8 | 31.2 | 33.3 | 30.0 |
| Home health | 44.8 | 35.3 | 43.2 | 38.7 | 52.1 | 50.0 | 61.1 | 51.4 | 55.6 | 70.0 |
| SNF | 19.6 | 19.2 | 10.8 | 4.8 | 12.3 | 10.0 | 17.0 | 17.4 | 11.1 | 0.0 |
| LTC hospital | 0.3 | 0.3 | 0.0 | 0.0 | 0.0 | 0.0 | 0.0 | 0.0 | 0.0 | 0.0 |
| Initial LTC | (N = 53) | (N = 74) | (N = 18) | (N = 52) | (N = 19) | (N = 38) | (N = 25) | (N = 26) | (N = 4) | (N = 4) |
| None | 39.6 | 44.6 | 44.4 | 61.5 | 63.2 | 68.4 | 16.0 | 26.9 | 50.0 | 50.0 |
| Home health | 39.6 | 29.7 | 38.9 | 30.8 | 15.8 | 21.1 | 48.0 | 42.3 | 0.0 | 25.0 |
| SNF | 18.9 | 24.3 | 16.7 | 5.8 | 21.1 | 10.5 | 36.0 | 30.8 | 50.0 | 25.0 |
| Rehabilitation hospital | 1.9 | 1.4 | 0.0 | 1.9 | 0.0 | 0.0 | 0.0 | 0.0 | 0.0 | 0.0 |
Sources: CMS Denominator and Standard Analytic Files.
The patterns of the DRGs differed. The three more chronic conditions—COPD, heart failure, and diabetes—substituted no postacute care for initial home health care. For each of these DRGs, 80 to 90 percent of the falloff in initial postacute home health care was reflected in the larger percentage of beneficiaries who received no postacute care.
This was not the case for the two conditions that typically relied more heavily on initial institutional care. For stroke patients, a little less than two-thirds of the smaller percentage of beneficiaries initially receiving home health care was reflected in the larger percentage receiving no postacute care. For hip fracture patients, the percentage discharged initially to home health care decreased, but without a corresponding increase in the percentage receiving no postacute care. The major drop-off in the use of home health care for hip fracture cases was in home health care use after being discharged from SNFs or rehabilitative or LTC hospitals.
The falloff in home health care as a postacute care service following initial institutional care applied to all the DRGs except diabetes. For discharges with COPD and initial institutional postacute care, the rate of subsequent home health care fell from 34 percent to 27 percent; for hip fractures, from 43 percent to 37 percent; and for stroke, from 35 percent to 30 percent. The rate for those discharges with a DRG of heart failure lost 2 percentage points from a rate of 29 percent before enactment of the BBA.
All the DRGs showed an increase in the use of rehabilitation hospital and LTC hospital care. More discharged patients for all the DRGs, except diabetes, went initially to rehabilitation and LTC hospitals. The percentage increases were largest for hip fractures and strokes, the DRGs that initially made the most use of these facilities. Before the BBA was enacted, 15 percent of all patients with hip fractures were discharged to rehabilitation hospitals, which rose to almost 17 percent after the BBA. The percentage of stroke patients going to rehabilitation hospitals increased from 16.3 percent to 17.7 percent, and the percentage going initially to LTC hospitals climbed from 0.7 percent to 1.2 percent. Small increases were also found for COPD and heart failure.
These changes may reflect several factors. First, during the period of our study, rehabilitation and LTC hospitals continued to be reimbursed on a cost basis. The phase-in of PPS, in which some postacute care settings moved to prospective reimbursement before others did, has the potential to result in shifts among the different providers in order to maximize payments. Second, the supply of rehabilitation and LTC hospitals has increased, making them more available to a wider range of individuals. Between 1997 and 1999, the number of rehabilitation hospitals rose by 4 percent, and the number of LTC hospitals increased by 23 percent. Third, home health care agencies may no longer have been willing to care for the more complex patients since the IPS applied an aggregate per-beneficiary limit on reimbursement. Fourth, home health care agencies may no longer have the staff to continue treating patients needing complicated care. Many agencies have lost or let go their more highly trained staff. Moreover, highly trained staff have more options for other placements and may leave voluntarily when faced with stagnant wages and fewer opportunities for growth.
Utilization during the Episode
The utilization of postacute care services during the episode of postacute care is shown in table 2. The number of home health care visits for all DRGs fell sharply, ranging from 39 percent to 54 percent. None of the other differences in utilization between the two periods was significant, although the rates of rehabilitation and LTC hospital use were longer for stroke, COPD, and heart failure.
TABLE 2.
Utilization of Postacute Services during the Postacute Episode, Pre- and Post-BBA
| Pre-BBA | Post-BBA | Difference | %Difference | |
|---|---|---|---|---|
| DRG 014: Stroke | (N = 7,162) | (N = 6,228) | ||
| Home health visits | 18.36 | 9.33 | –9.03a | –49.2 |
| SNF days | 10.10 | 9.55 | –0.55 | –5.5 |
| Rehabilitation hospital days | 4.13 | 4.36 | 0.23 | 5.5 |
| Long-term care hospital days | 0.38 | 0.44 | 0.06 | 14.6 |
| DRG 088: COPD | (N = 7,966) | (N = 8,461) | ||
| Home health visits | 11.95 | 5.45 | –6.50a | –54.4 |
| SNF days | 2.13 | 1.88 | –0.25 | –11.9 |
| Rehabilitation hospital days | 0.18 | 0.19 | 0.00 | 2.7 |
| Long-term care hospital days | 0.18 | 0.25 | 0.07 | 36.3 |
| DRG 127: Heart Failure | (N = 13,035) | (N = 13,035) | ||
| Home health visits | 14.19 | 7.45 | −6.74a | −47.5 |
| SNF days | 2.90 | 2.77 | −0.13 | −4.3 |
| Rehabilitation hospital days | 0.12 | 0.14 | 0.03 | 22.2 |
| Long-term care hospital days | 0.06 | 0.10 | 0.04 | 66.0 |
| DRG 210: Hip Fracture | (N = 3,051) | (N = 2,820) | ||
| Home health visits | 18.23 | 10.90 | –7.33a | –40.2 |
| SNF days | 21.09 | 20.17 | –0.92 | –4.3 |
| Rehabilitation hospital days | 2.87 | 2.79 | –0.08 | –2.8 |
| Long-term care hospital days | 0.28 | 0.39 | 0.10 | 37.0 |
| DRG 294: Diabetes | (N = 1,591) | (N = 1,563) | ||
| Home health visits | 17.95 | 11.05 | –6.90a | –38.5 |
| SNF days | 3.39 | 2.76 | –0.63 | –18.6 |
| Rehabilitation hospital days | 0.18 | 0.15 | –0.03 | –18.5 |
| Long-term care hospital days | 0.13 | 0.25 | 0.12 | 89.6 |
Significant at p ≤ .05.
Sources: CMS Denominator and Standard Analytic Files.
Utilization and Expenditures at a Fixed Period after Hospital Discharge
Because the average lengths of episodes were shorter after the BBA was enacted, we looked at the utilization and expenditures for postacute care services for a fixed period, 120 days after discharge from the hospital. This gave us a uniform way to compare utilization and expenditures to the program for the two periods. The reduction in number of home health care visits was significant for all DRGs (see table 3), although the range of the percentage differences was smaller (as expected) than that shown in table 2. The number of home health care visits within 120 days of discharge decreased from between 37 percent and 48 percent after the BBA, which was less than the 39 percent-to-54 percent range during the episode. All the reductions in home health care use were significant at the 5 percent level, as was the decrease in the use of Medicare SNF days for patients having had a stroke. The large drop in the number of SNF days for stroke patients may be a random finding, or it may reflect perceived underpayment in the per-diem reimbursement for SNFs for stroke patients under the new prospective payment system.
TABLE 3.
Utilization of Postacute Services during 120 Days after Hospital Discharge, Pre- and Post-BBA
| Pre-BBA | Post-BBA | Difference | % Difference | |
|---|---|---|---|---|
| DRG 014: Stroke | (N = 7,162) | (N = 6,228) | ||
| Home health visits | 21.05 | 11.46 | –9.59a | –45.6 |
| SNF days | 13.14 | 12.19 | –0.94a | –7.2 |
| Rehabilitation hospital days | 4.7 | 4.97 | 0.27 | 5.8 |
| Long-term care hospital days | 0.45 | 0.55 | 0.1 | 22.9 |
| DRG 088: COPD | (N = 7,966) | (N = 8,461) | ||
| Home health visits | 15.73 | 8.19 | –7.53a | –47.9 |
| SNF days | 3.69 | 3.33 | –0.36 | –9.7 |
| Rehabilitation hospital days | 0.31 | 0.34 | 0.03 | 9.7 |
| Long-term care hospital days | 0.25 | 0.36 | 0.1 | 39.9 |
| DRG 127: Heart Failure | (N = 13,035) | (N = 12,503) | ||
| Home health visits | 19.52 | 11.03 | –8.49a | –43.5 |
| SNF days | 4.82 | 4.68 | –0.15 | –3.1 |
| Rehabilitation hospital days | 0.26 | 0.33 | 0.07 | 26.8 |
| Long-term care hospital days | 0.12 | 0.19 | 0.08 | 65.2 |
| DRG 210: Hip Fracture | (N = 3,051) | (N = 2,820) | ||
| Home health visits | 19.9 | 12.63 | –7.27a | –36.5 |
| SNF days | 24.84 | 23.34 | –1.5 | –6.0 |
| Rehabilitation hospital days | 3.11 | 3.11 | –0.01 | –0.3 |
| Long-term care hospital days | 0.36 | 0.43 | 0.07 | 18.5 |
| DRG 294: Diabetes | (N = 1,591) | (N = 1,563) | ||
| Home health visits | 22.49 | 14.29 | –8.20a | –36.5 |
| SNF days | 5.59 | 4.67 | –0.92 | –16.5 |
| Rehabilitation hospital days | 0.45 | 0.41 | –0.04 | –8.5 |
| Long-term care hospital days | 0.2 | 0.4 | 0.19 | 96.3 |
Significant at p ≤ .05.
Sources: CMS Denominator and Standard Analytic Files.
Interim payment amounts reported in the claims files according to DRG for the two periods are shown in figure 1. (Interim payments do not reflect agency cost settlements, which take at least two years to complete.) These amounts demonstrate how the relatively low rates of use per beneficiary for some services can translate into large per-capita payments.
fig. 1.
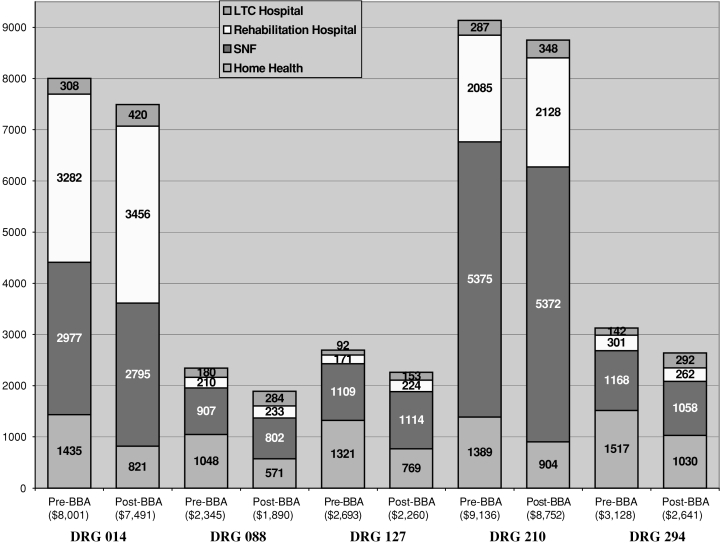
Payments per live discharge by type of postacute service during 120 days after discharge.
In both periods, the largest expenditure for stroke patients was rehabilitation hospital care (see figure 1), accounting for 43 percent of all the program payments before the BBA and 48 percent after the BBA. Even though the decreases in home health care were relatively strong (46%), they made up only 18 percent of the resources spent on stroke patients before the BBA and 11 percent after the BBA. The total payment for postacute care for each discharged stroke patient fell slightly less ($510) than did the payment for home health care ($614). The payments to SNFs also declined, although they were offset by increases in the payments per discharge to rehabilitation hospitals and LTC hospitals.
Three of the other four DRGs—COPD, heart failure, and hip fracture—showed a similar pattern of larger expenditure decreases for home health care ($477 to $552) than for total payments (78% to 95% of the drop in home health care), indicating a small shift to institutional care in rehabilitation hospitals and LTC hospitals. For the fourth DRG—diabetes—the decrease in total expenditures was the same as the decrease in expenditures for home health care. The payments to SNFs were smaller or about the same for all the DRGs.
Interim payments for home health care for COPD, heart failure, and diabetes patients made up the bulk of postacute care before the BBA but dropped to the second position behind SNF care after the BBA. The percentage of payments to rehabilitation hospitals and LTC hospitals rose. SNF care for COPD, heart failure, and diabetes patients made up the largest percentage of expenditures both before and after BBA.
In dollar terms, the average cost of postacute care for the five DRGs was $454 per discharged patient. The savings would have been an average of $523 if the use of rehabilitation and LTC hospitals had not risen. By DRG, the range was an overall decrease of $384 to $510, with hip fractures on the low end of the range and stroke on the high end.
Incidence of Potential Adverse Outcomes
To see whether the differences observed in postacute care resulted in an increase in the incidence of specific adverse outcomes, we estimated logistic regressions for their occurrence for each of the five DRGs at 60, 120, and 180 days from discharge: a total of 90 models. The models included independent variables for after the BBA as well as control variables for characteristics of the beneficiaries and their communities, their prior use of medical care, and the length and primary diagnoses of their hospitalization. We used these variables as control variables to adjust for any differences in the severity of the cases that may have occurred between the two periods. Because adverse outcomes are more prevalent among older, more disabled, sicker beneficiaries, any changes in the characteristics of the pre- and post-BBA study groups could affect the incidences of the outcome measures.
Table 4 shows the significant results at p ≤ .05 from the 90 regressions. The pre-BBA mean and estimated percentage difference due to being in the post-BBA period are also shown in order to give the reader an indication of the magnitude of the differences we found.
TABLE 4.
Significant Results from the 90 Logistic Regressions
| DRG and Outcome | Pre-BBA Mean (%) | Absolute Effect (%) |
|---|---|---|
| DRG 014: Stroke | ||
| Less avoidable hospitalizations within 120 days after discharge | 4.0 | –0.7 |
| DRG 088: COPD | ||
| Less emergency room use within 60 days after discharge | 15.3 | –1.2 |
| Less emergency room use for same body system within 120 days after discharge | 14.3 | –1.2 |
| More mortality within 60 days after discharge | 6.5 | 0.8 |
| DRG 127: Heart Failure | ||
| More emergency room use for same body system within 120 days after discharge | 11.6 | 1.0 |
| More emergency room use for same body system within 180 days after discharge | 14.5 | 1.1 |
| DRG 210: Hip Fracture | ||
| More mortality within 60 days after discharge | 9.4 | 2.4 |
| More mortality within 120 days after discharge | 14.2 | 2.0 |
Note: Regressions were run for five DRGs (stroke, chronic obstructive pulmonary disease, heart failure, hip fracture, and diabetes), and three time periods (60, 120, and 180 days after hospital discharge) and six outcomes (acute hospital admission, acute hospital admission for the same body system, avoidable hospitalizations, emergency room use, emergency room use for the same body system, and mortality). Results are shown for outcomes significant at p ≤ .05. The absolute effect shows the estimated percentage difference due to being in the post-BBA period. The difference in the incidence of having a specific outcome post-BBA is estimated from a logistic regression that controls for patient characteristics, prior medical use, and the characteristics of their hospitalization and communities.
Sources: CMS Denominator, Standard Analytic, and Provider of Services Files and Area Resource File.
For most DRGs and most time periods, we found no significant differences in the incidence of these outcomes after the BBA. Of the 90 logistic regressions, only eight showed significant results for this period. Three of them were in the direction of reduced incidence after the BBA, and five were in the direction of increased incidence.
Significant effects were found in both directions for having an emergency room visit: after the BBA was enacted, COPD patients more often had an ER visit within 60 days and less often had an ER visit for the same body system diagnosis within 120 days of discharge, and heart failure patients more often had an ER visit within 120 days and 180 days of discharge. After the BBA, a smaller percentage of stroke patients had an avoidable hospitalization within 120 days of discharge. However, three findings, which showed a larger percentage of deaths after the BBA, may signal an area for concern. More COPD patients died within 60 days of discharge, and more hip fracture patients died within 60 and 120 days of discharge. The increase in the mortality rate within 60 days of discharge for hip fractures was the largest—25 percent—and about half that relative increase was found for the other two significant mortality findings.
Discussion
The last twenty years have been marked by efforts by Medicare policymakers to change individual service reimbursement to provide incentives for efficient delivery of care. The 1997 Balanced Budget Act continued this trend by moving all types of postacute care reimbursement to prospective payment systems.
The patterns of postacute care treatment for the five DRGs we studied changed substantially after the BBA was first implemented. The use of home health care services fell both as initial postacute care and as subsequent treatment after the initial institutional postacute care. The use of rehabilitation and LTC hospitals increased. Expenditures for the five DRGs dropped an average of $454 per discharge, a savings that would have been 15 percent higher if the use of rehabilitation and LTC hospitals had not risen.
Given the incentives in the IPS, this decrease in home health care use should not be surprising. The drop-off in use was a little larger than the average decrease in utilization after the BBA for COPD, stroke, and heart failure patients and less than average for hip fracture and diabetes patients. This suggests that home health care is no longer an option for some beneficiaries, for most because their needs are not thought to be serious enough, but for some because the seriousness of their condition no longer makes them able to be served in home health care. Therefore, the interim payment system's incentives promoted—at least to a small extent—admissions to more intensive treatment regimes, a possible reverse of recent trends to serve individuals in the least restrictive settings possible.
We found only five significantly worse adverse outcomes out of a possible 90. Out of such a large number, finding only five that were significant could very likely be due to chance. Three of the five, however, indicated an increased incidence of death for COPD and hip fracture patients. This result would be troubling if it indeed was caused by the changes in postacute care use resulting from the BBA. But we should be careful in making such a linkage because only three of the 15 analyses of the incidence of death found a significant effect. In addition, some analysts might argue that mortality could just as easily be used as a control variable as an outcome measure (Gage 1999b; Liu, Wissoker, and Rimes 1998) and that its significance more likely indicates that the control variables in our model were inadequate. Furthermore, mortality's linkage to the provision of less postacute care is more tenuous than that of the other measures (Kane et al. 1994).
Nonetheless, death is the ultimate bad outcome, and to fully discredit the findings, one would need to argue that the severity of the condition of the Medicare beneficiaries with COPD and hip fractures who were discharged from the hospital had changed in ways we could not control for. The COPD and hip fracture patients were relatively frail and might have had better survival rates in an environment where they were more closely monitored by visiting nurses and aides. In any case, this finding may deserve closer study, including a review of clinical information.
The changes we observed in the use of postacute care immediately after the passage of the IPS demonstrate that Medicare providers are poised to alter use patterns substantially when financial incentives change. This suggests that reforms should be conducted carefully, and the results monitored. It also suggests an interrelationship among these services and the need for financial incentives to maximize their respective benefits as part of the continuum of care.
Medicare's postacute care has been plagued by an inability to view it as a continuum of care for an individual patient. Although the move to separate prospective payment systems for each of the postacute care providers legislated in the BBA may moderate the cost increases in the short term, these methodologies continue to compartmentalize service provision. They reimburse individual provider settings using different units of payment, and they collect different functional assessment and health status data to monitor quality and determine reimbursement. In addition, Medicare relies on physicians to control admissions and to manage treatment plans with little recognition of these roles and responsibilities in their Medicare reimbursement (OIG 2002).
As postacute care services have grown to become an important part of the Medicare program, their organization, payment strategies, and locus of control need to be rethought. MedPAC (2001) has recommended that the secretary of health and human services develop a patient classification system from a common core of data elements that predicts cost across settings. Some of the necessary research has already begun (Johnson et al. 2002). Such a classification system would be an important first step in designing a prospective payment system for postacute care providers that would offer more direct incentives to treat individual patients across all settings, thus maximizing quality of care and appropriate service payment.
Acknowledgments
This article is based on work funded by the Robert Wood Johnson Foundation (RWJF) through the Home Care Research Initiative at the Center for Home Care Policy and Research of the Visiting Nurse Service of New York. Additional funding was also provided by the Centers for Medicare and Medicaid Services (CMS) under contract number HCFA-00-0108 and the Office of the Assistant Secretary of Planning and Evaluation (ASPE) under contract number HHS-100-99-0021. The analysis and conclusions are solely those of the authors and do not express any official opinion of or endorsement by the funders.
The authors would like to thank Arden Hall and Richard West for their consultation on econometric issues. We also are grateful to Diana Valenzuela and Rena Korb for their aid in the production and editing of this article. Special thanks go to Penny Feldman and Christopher Murtaugh at the Visiting Nurse Service of New York, James Knickman of the Robert Wood Johnson Foundation, Sydney Galloway of CMS, and Kamal Hijjazi of ASPE for their help in gaining and maintaining access to these data. We are very grateful to Christopher Murtaugh, who gave us comments on an earlier version of this article.
Appendix
Variable Definitions
| Variable Name | Definition |
|---|---|
| Dependent Variables | |
| Acute hospital admission | Any dollars paid for acute inpatient claims (excludes long-term care or rehabilitation hospitals) |
| Acute hospital admission for the same body system | Any dollars paid for acute acute inpatient claims (excludes long-term care or rehabilitation hospitals) for the same body system as the home health admission |
| Avoidable hospitalization | Any admission to acute inpatient for ambulatory care sensitive conditions (ACSCs) as defined by inpatient primary diagnosis |
| Emergency room use | Any dollars paid for outpatient claim containing Revenue Code 450–459 |
| Emergency room use for the same body system | Any dollars paid for outpatient claim containing Revenue Code 450–459 for the same body system as the home health admission |
| Mortality | Died |
| Independent Variables | |
| Post-BBA | FFY 1999 (October 1, 1998, through September 30, 1999) |
| Demographic | |
| Age | Age at hospital discharge |
| Under 65 | |
| 65–74 | |
| 75–84 | |
| 85 and older | |
| Female | Female |
| Nonwhite | Race not white |
| State Medicaid buy-ina | Any months during fiscal year with state Medicaid buy-in within the 120 days following admission |
| Original Medicare entitlement Aged | Original Medicare entitlement Aged (OASI) |
| Prior Medicare Use | |
| Inpatient days 6 months prior to admission | Medicare inpatient days 6 months prior to home health admission adjusted for trend in Medicare inpatient useb |
| SNF days 6 months prior to admission | Medicare SNF days 6 months prior to home health admission adjusted for trend in Medicare SNF useb |
| Inpatient Hospitalization | |
| Length of hospital stay | Length of Medicare inpatient hospital stay adjusted for trend in Medicare average length of stayb |
| Community | Characteristics of the community where the beneficiary lives |
| General | |
| Urban | Metropolitan county as defined by urban/rural continuum code (Economic Research Service, U.S. Department of Agriculture) |
| Census Region | |
| New England | CT, ME, MA, NH, RI, VT |
| Middle Atlantic | NJ, NY, PA |
| South Atlantic | DE, DC, FL, GA, MD, NC, SC, VA, WV |
| East North Central | IL, IN, MI, OH, WI |
| East South Central | AL, KY, MS, TN |
| West North Central | IA, KS, MN, MO, NE, ND, SD |
| West South Central | AR, LA, OK, TX |
| Mountain | AZ, CO, ID, MT, NV, NM, UT, WY |
| Pacific | AK, CA, HI, OR, WA |
| Medicare managed care penetration | 1997 county percent Medicare managed care penetration |
| County Pt. A/B reimbursement per beneficiary (1000s) | 1991 total reimbursement Medicare Parts A and B divided by total enrollment Part A and/or B divided by 1000 |
| County Supply of Resources pre BBA | |
| Physicians per 10,000 residents | 1995 total county M.D.s and D.O.s per 10,000 population |
| Hospital occupancy rate | 1996 total county days in short term general hospitals divided by 365 times the number of beds x 100 |
| Nursing home beds per 100 persons >65 1997 | 1997 county number of Medicare and Medicaid nursing homes and SNFs per person over 65 |
| 1997 full time Medicare HHA employees/100 person 65+ | 1997 county number of full time Medicare home health agency employees per person over 65 |
State Medicaid buy-in beneficiaries include both those who have full Medicaid eligibility and those for whom Part B Medicare premiums are paid but are not eligible for Medicaid services.
For the six months before FY1997 and FY1999, Medicare inpatient number of days of care for the program as a whole decreased from 0.8958 to 0.8583 days, Medicare SNF days of care increased from 0.5025 to 0.5151 days, and average length of acute hospital stay decreased from 6.51 to 6.09 days. 1999 data were adjusted to 1997.
References
- Blustein J, Hanson K, Shea S. Preventable Hospitalizations and Socioeconomic Status. Health Affairs. 1998;17(2):177–89. doi: 10.1377/hlthaff.17.2.177. [DOI] [PubMed] [Google Scholar]
- Centers for Medicare and Medicaid Services (CMS) HCFA Review 2000 Statistical Supplement. Baltimore, Md.: 2000. [Google Scholar]
- Chen A. Princeton, N.J.: Mathematica Policy Research; 2000. The Impacts of Per-Episode Prospective Payment for Medicare Home Health Care on the Quality of Care: Less Is Not Necessarily Worse. Paper submitted to the Health Care Financing Administration. [Google Scholar]
- Culler SD, Parchman ML, Przybylski M. Factors Related to Potentially Preventable Hospitalizations among the Elderly. Medical Care. 1998;36(6):804–17. doi: 10.1097/00005650-199806000-00004. [DOI] [PubMed] [Google Scholar]
- Gage B. Impact of the BBA on Post-Acute Utilization. Health Care Financing Review. 1999a;20(4):103–26. [PMC free article] [PubMed] [Google Scholar]
- Gage B. Medicare Home Health and the IPS: Is Access a Problem? Washington, D.C.: Urban Institute; 1999b. [Google Scholar]
- Hedrick SC, Inui TS. The Effectiveness and Cost of Home Care: An Information Synthesis. Health Services Research. 1986;20:851–80. 6, pt. 2. [PMC free article] [PubMed] [Google Scholar]
- Hedrick SC, Koepsell TD, Inui T. Meta Analysis of Home Care on Mortality and Nursing Home Placement. Medical Care. 1989;27(11):1015–26. doi: 10.1097/00005650-198911000-00003. [DOI] [PubMed] [Google Scholar]
- Hughes SL, Ulasevich A, Weaver FM, Hendeson W, Manheim L, Kubal J, Bonango F. Impact of Home Care on Hospital Days: A Meta Analysis. Health Services Research. 1997;32(4):415–32. [PMC free article] [PubMed] [Google Scholar]
- Johnson M, Holthaus D, Harvell J, Coleman E, Eilertsen T, Kramer A. Medicare Post-Acute Care: Quality Measurement Final Report. Washington, D.C.: U.S. Department of Health and Human Services, Office of the Assistant Secretary for Planning and Evaluation; 2002. [Google Scholar]
- Kane RL. A Study of Post-Acute Care. Minneapolis: Institute for Health Services Research, School of Public Health, University of Minnesota; 1994. HCFA no. 17–C98891. [Google Scholar]
- Kane RL, Chen Q, Finch M, Blewett L, Burns R, Moskowitz M. The Optimal Outcomes of Post-Hospital Care under Medicare. Health Services Research. 2000;35(3):615–61. [PMC free article] [PubMed] [Google Scholar]
- Kane RL, Finch M, Chen Q, Blewett L, Burns R, Moskowitz M. Post-Hospital Home Health Care for Medicare Patients. Health Care Financing Review. 1994;16(1):131–53. [PMC free article] [PubMed] [Google Scholar]
- Kemper PR, Applebaum R, Harrigan M. Community Care Demonstrations: What Have We Learned? Health Care Financing Review. 1988;8(4):87–100. [PMC free article] [PubMed] [Google Scholar]
- Komisar H, Feder J. The Balanced Budget Act of 1997: Effects on Medicare's Home Health Benefit and Beneficiaries Who Need Long-Term Care. Washington, D.C.: Georgetown University Institute for Health Care Research and Policy; 1998. [Google Scholar]
- Laguna Research Associates. Final Report: Direct and Indirect Effects of the Changes in Home Health Policy as Mandated by the Balanced Budget Act of 1997. San Francisco: Laguna Research Associates; 2002. [Google Scholar]
- Lewin Group. Implications of the Medicare Home Health Interim Payment System of the 1997 Balanced Budget Act. Washington, D.C.: National Association for Home Care; 1998. [Google Scholar]
- Liu K, Gage B, Harvell J, Stevenson D, Brennan N. Medicare's Post-Acute Care Benefit: Background, Trends, and Issues to Be Faced. Washington, D.C.: Urban Institute; 1999. [Google Scholar]
- Liu K, Long SK, Rimes C. Medicare and Medicaid Interactions in Home Care: Who Uses What? Washington, D.C.: Urban Institute; 1999. HCFA Cooperative Agreement no. 17-90323. [Google Scholar]
- Liu K, Wissoker D, Rimes C. Determinants and Costs of Medicare Post-Acute Care Provided by SNFs and HHAs. Inquiry. 1998;35(1):49–61. [PubMed] [Google Scholar]
- McCall N, Komisar HL, Petersons A, Moore S. Medicare Home Health before and after the BBA. Health Affairs. 2001;20(3):189–98. doi: 10.1377/hlthaff.20.3.189. [DOI] [PubMed] [Google Scholar]
- McCall N, Petersons A, Moore S, Korb J. Utilization of Home Health Services before and after the BBA of 1997: What Were the Initial Effects? Health Services Research. 2003;38:85–106. doi: 10.1111/1475-6773.00106. 1, pt. 1. [DOI] [PMC free article] [PubMed] [Google Scholar]
- Medicare Payment Advisory Commission (MedPAC) Report to the Congress. Washington, D.C.: 2001. Prospective Payment for Post-Acute Care: Current Issues and Long-Term Agenda; pp. 89–107. chap. 6. [Google Scholar]
- Meiners M, Coffey R. Hospital DRGs and the Need for Long-Term Care Services: An Empirical Analysis. Health Services Research. 1985;20(3):359–84. [PMC free article] [PubMed] [Google Scholar]
- Murtaugh C, Litke A. Transitions among Post-Acute and Long-Term Care Settings. 2000. NIA Grant no. RO3 AG16105-01.
- Neu CR, Harrison SC. Posthospital Care before and after the Medicare Prospective Payment System. Santa Monica, Calif.: Rand Corporation; 1988. [Google Scholar]
- Neu CR, Harrison SC, Heilbrunn JZ. Medicare Patients and Postacute Care: Who Goes Where? Santa Monica, Calif.: Rand Corporation; 1989. [Google Scholar]
- Office of the Inspector General (OIG) The Physician's Role in Medicare Home Health 2001. Washington, D.C.: U.S. Department of Health and Human Services; 2002. [Google Scholar]
- Pappas G, Hadden W, Kozak LJ, Fisher GF. Potentially Avoidable Hospitalizations: Inequalities in Rates between US Socioeconomic Groups. American Journal of Public Health. 1997;87(5):811–16. doi: 10.2105/ajph.87.5.811. [DOI] [PMC free article] [PubMed] [Google Scholar]
- Prospective Payment Assessment Commission (ProPAC) Report and Recommendations to the Congress. Washington, D.C.: Prospective Payment Assessment Commission; 1997. [Google Scholar]
- Schore J. Princeton, N.J.: Mathematica Policy Research; 1994. Patient, Agency and Area Characteristics Associated with Regional Variation in the Use of Medicare Home Health Services. Paper submitted to Lewin-VHI. [Google Scholar]
- Schore J. Regional Variation in the Use of Medicare Home Health Services. In: Weiner JM, Clauser SB, Kennell DL, editors. Persons with Disabilities: Issues in Health Care Financing and Service Delivery. Washington, D.C.: Brookings Institution; 1995. pp. 267–90. [Google Scholar]
- Shaughnessy PW, Schlenker RE, Hittle DF. Home Health Care Outcomes under Capitated and Fee-for-Service Payment. Health Care Financing Review. 1994;16(1):187–222. [PMC free article] [PubMed] [Google Scholar]
- Smith BM, Maloy KA, Hawkins DJ. An Examination of Medicare Home Health Services: A Descriptive Study of the Effects of the Balance Budget Act Interim Payment System on Access to and Quality of Care. Washington, D.C.: George Washington University School of Public Health and Health Services, Center for Health Services Research and Policy; 1999. [PubMed] [Google Scholar]
- Smith BM, Maloy KA, Hawkins DJ. An Examination of Medicare Home Health Services: A Descriptive Study of the Effects of the Balanced Budget Act Interim Payment System on Hospital Discharge Planning. Washington, D.C.: George Washington University School of Public Health and Health Services, Center for Health Services Research and Policy; 2000. [PubMed] [Google Scholar]
- Smith B, Rosenbaum S, Schwartz R. Medicare Home Health Services: An Analysis of the Implications of the Balanced Budget Act of 1997 for Access and Quality. Washington, D.C.: George Washington University Medical Center, Center for Health Policy Research; 1998. [Google Scholar]
- Steiner A, Neu CR. Santa Monica, Calif.: Rand Corporation/UCLA/Harvard Center for Health Care Financing Policy Research; 1993. Monitoring the Changes in Use of Medicare Posthospital Services. [Google Scholar]
- U.S. General Accounting Office (GAO) Medicare Home Health Benefit. Impact of Interim Payment System and Agency Closures on Access to Services. Washington, D.C.: 1998. Publication no. GAO/HEHS-98-238. [Google Scholar]
- U.S. General Accounting Office (GAO) Medicare Home Health Care. Prospective Payment System Could Reverse Recent Declines in Spending. Washington, D.C.: 2000. Publication no. GAO/HEHS-00-176. [Google Scholar]
- Weissert WG. Seven Reasons Why It Is So Difficult to Make Community-Based Long-Term Care Cost Effective. Health Services Research. 1985;23(1):423–34. [PMC free article] [PubMed] [Google Scholar]
- Weissert WG, Chernew M, Hirth R. Beyond Managed Long-Term Care: Paying for Home Health Care Based on Risk of Adverse Outcomes. Health Affairs. 2001;20(3):172–79. doi: 10.1377/hlthaff.20.3.172. [DOI] [PubMed] [Google Scholar]
- Weissert W, Cready C, Pawelak J. The Past and Future of Home and Community-Based Long-Term Care. Milbank Quarterly. 1988;66(2):309–88. [PubMed] [Google Scholar]
- Weissert WG, Hedrick SC. Lessons Learned from Research on Effects on Community-Based Long-Term Care. Journal of the American Geriatrics Society. 1994;42(3):348–53. doi: 10.1111/j.1532-5415.1994.tb01763.x. [DOI] [PubMed] [Google Scholar]
- Weissman J, Constantine G, Epstein A. Rates of Avoidable Hospitalization by Insurance Status in MA and MD. Journal of the American Medical Association. 1992;268(17):2388–94. [PubMed] [Google Scholar]