“Pharmacy utilization and the Medicare Modernization Act,” the article by Vittorio Maio, Laura Pizzi, Adam R. Roumm, Janice Clarke, Neil I. Goldfarb, David B. Nash, and David Chess in this issue of the Milbank Quarterly (Maio et al. 2005), includes a timely review of studies evaluating drug insurance policies relevant to the Medicare Prescription Drug, Improvement, and Modernization Act (MMA) of 2003. Unfortunately, the review excludes the studies of one of the best-evaluated policies of drug insurance for seniors (Grootendorst et al. 2001, 2002; Hazlet and Blough 2002; Marshall, Grootendorst, et al. 2004; Narine, Senathirajah, and Smith 2001; Schneeweiss, Dormuth, et al. 2004; Schneeweiss, Maclure, and Soumerai 2002; Schneeweiss, Soumerai, Glynn, et al. 2002; Schneeweiss, Soumerai, Maclure, et al. 2003; Schneeweiss, Walker, et al. 2002). The studies may have been excluded because the policy, misleadingly called “Reference-Based Pricing,” sounds like a pricing policy. In fact, it is an insurance policy introduced in 1995 by British Columbia's public drug benefit plan, PharmaCare, covering all people over age 65 and families on income assistance or with unusually high drug needs. Although the British Columbian government belatedly renamed it the “Reference Drug Program,” a more descriptive name would have been “Equal Subsidy Program” because it offers the same dollar coverage for similar drugs, regardless of the manufacturers’ prices. Other Canadian provinces have adopted similar policies and called them Maximum Allowable Costs (MACs), as have some U.S. managed care organizations.
Relevance of Canada
Lessons from drug benefit plans in Canada are relevant to the United States for four major reasons.
-
The rate of growth of drug costs is similar in Canada and the United States. Expenditures have been rising more than 10 percent per year for more than a decade (Canadian Institute for Health Information 2003). Although the Canadian federal government's Patent Medicine Prices Review Board has kept drug prices lower in Canada than in the United States, the board has been unable to stem the steadily rising introductory prices of many new drugs. Indeed, some new drugs cost more than C$10,000 per patient per year, and numerous other expensive drugs are already in the pharmaceutical industry's development pipeline.
The growth of drug costs is so staggering, in fact, that it needs to be expressed in terms of daily acceleration. In Canada, the speed of public expenditures on drugs accelerated from C$6.8 billion per year in 2002 to C$7.5 billion per year in 2003. That is a daily acceleration of almost C$2 million per day. Such daily increases in spending are what it would cost Canadian taxpayers to hire 15 to 20 physicians in permanent positions every day. In the United States, which is ten times more populous than Canada, the rate of drug cost growth is about the same as if 150 to 200 new physicians were hired every day.
The relentless pressure of pharmaceutical innovation and marketing is forcing the United States and Canada to converge toward similar systems of prescription drug coverage. With the MMA, the United States is moving to a more public-pay system. At the same time, Canadian public drug plans are increasingly offloading costs to the private sector. It is a textbook case of “pass-the-buck” economics. As costs rise, provincial drug plans are turning to patients for more money by raising deductibles and copayments. Many patients send claims for their extra costs to their private health insurance company. The insurers pay the claims and raise the rates they charge employers. The employers then pass the tab to their employees and customers. In 2002, the Employer Committee on Health Care in Ontario and the Employer Committee on Health Care in Alberta stated, “As a result of passive privatization and delisting of services in addition to rising costs of medical services, in particular prescription drugs, the affordability of employer sponsored plans are at risk” (Bowyer and McQueen 2002, 17).
Both the U.S. and the Canadian health care systems have been forced to move money from health services budgets to drug budgets or to raise premiums and taxes. For example, in British Columbia, despite many millions of dollars saved by the Reference Drug Program, the government had to increase the PharmaCare budget by C$90 million to cover the projected growth of drug costs in 2004 at the same time as it cut C$100 million out of the main budget category covering hospital and community health services (Government of British Columbia 2004). In Ontario, after promising in the 2003 election not to raise taxes, the newly elected Ontario government decided that it had to back down and cover its rising health care costs by reintroducing health care premiums (Hurley 2004).
Canadian provinces and voters have appealed for help from Ottawa, just as state governments and voters in the United States have successfully appealed to Washington, D.C. In the June 2004 Canadian federal election, even the Conservative Party of Canada was calling for a national pharmacare plan. In August 2004, the premiers of all the Canadian provinces asked the federal government to cover all the costs of drugs by creating a national pharmacare program. Although the federal government refused, it promised a national pharmacare strategy by June 2005 that would include federal support for catastrophic drug coverage (Anis 2004).
Tools
To appreciate the relevance of MAC policies in general and the particular experience in British Columbia, it is necessary to understand the relationship of MAC to other tools for managing drug insurance. This can be done quickly with the help of a few graphs.
A starting point is a two-dimensional grid for classifying drug insurance policies (Figure 1). It shows two basic ideas, that (1) drug insurance should be for drugs that work, not for ineffective drugs, and (2) benefits should go to patients with greater needs, not to healthy people with little need.
Figure 1.
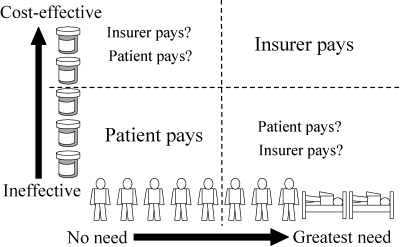
Insurance Is for Cost-Effective, Needed Use
Figure 2 shows the spectrum of policies for “channeling” drug benefits to patients with greater needs. Strategies range from those using only information about beneficiaries’ drug spending to those using information about drug effectiveness, patients’ health and financial status, and physicians’ expertise and prescribing quality.
Figure 2.
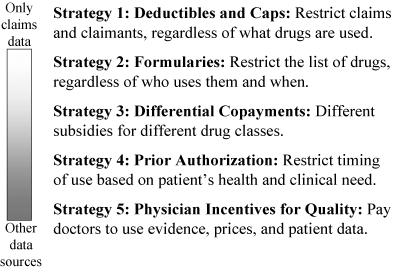
Spectrum of Policies for Funding the Needy
Strategy 1 is the traditional approach of private insurers to cover only those who have paid their premiums and to pay only the amount of a claim that exceeds an annual deductible and falls below a limit or cap, such as a maximum monthly or annual claim. Often there is also a fixed copayment for each prescription filled. Figure 3 shows how this strategy shrinks the population of claimants from both ends of the spectrum of need. For the insurer, the strategy is simple, requiring only financial information on the claimants’ drug expenditures. If an insurer lacks data on beneficiaries’ health, then it is rational to assume that those claimants who exceed the deductible are generally sicker and more needy than patients who have not reached the deductible. This assumption is often false, however. In a world where expensive new drugs are often inferior to time-tested inexpensive drugs, many claimants who exceed the deductible are healthier and have less need for their drugs than do those patients who use cheap but effective drugs and do not reach their deductible.
Figure 3.
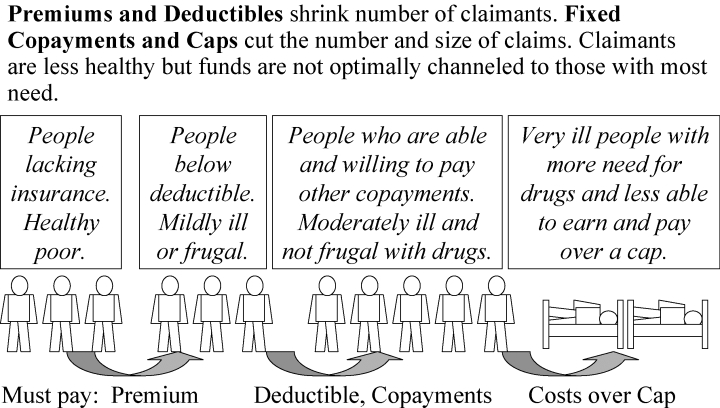
Strategy 1: Use Drug Spending Data Only
A cap is based on the opposite assumption: The more drugs you are using, the more likely you are not to need one of them. For example, when a Medicaid program covers only three prescriptions per month, there seems to be an assumption that a patient who takes four drugs probably needs the fourth less than other patients need their third drug. To clinicians, a cap seems irrational, for patients who exceed the cap are often much sicker and have a greater need for their drugs to be covered. Nonetheless, a cap may be rational to a Medicaid manager who wants to stem losses from the overuse, sharing, and resale of drugs.
Strategy 2 (Figure 4), the traditional approach of Canadian hospitals, is to allocate funds to cover drugs using evidence of their effectiveness and price. Rich and poor Canadians alike are given free drugs from the hospital formulary, and more expensive drugs that offer no additional benefit are not listed in the formulary and are rarely prescribed. Expensive drugs may be covered by the hospital if the attending physician documents the clinical need.
Figure 4.
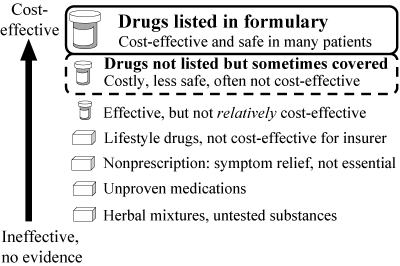
Strategy 2: Use Evidence of Drug Safety, Effectiveness, and Price to Create List of Covered Drugs
Strategy 3 (Figure 5) encompasses “differential copayment” policies. One of the most common is a three-tier copayment system. For each prescription filled, the patient pays a low copayment (e.g., C$10) for a generic drug, a moderate copayment (e.g., C$20) for a preferred low-cost brand, and a high copayment (e.g., C$30) for a less preferable, more expensive drug. In some programs, a portion of the copayment counts toward the deductible. Thus Strategy 3 uses information about both the drug's relative cost-effectiveness and the patient's cumulative expenditures.
Figure 5.
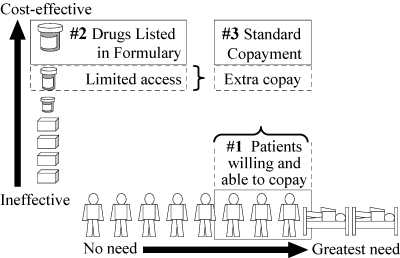
Strategy 3: Use Drug Evidence, Prices, Plus Data on Patients to Set Different Copayments
British Columbia's Reference Drug Program (RDP) also is a differential copayment system. Regardless of the patient's income, a copayment is required for more expensive brands of drugs in certain therapeutic classes that are subject to RDP (unless the physician has obtained a preauthorized exemption). The copayment is “differential” because it differs from drug to drug, and it equals the extra price of that drug above the “reference price”—the price of PharmaCare's choice of “reference drug” in the same therapeutic class. Unless the patient has been exempted, the copayment for the higher-priced drug does not count toward the patient's annual income-adjusted deductible. In British Columbia, only five drug classes are subject to referencing: histamine-2 receptor antagonists for gastric acid suppression (e.g., both brand and generic ranitidine and nizatidine are referenced to the least expensive drug in the class, generic cimetidine), nitrate patches for angina, nonsteroidal anti-inflammatory drugs, and two classes of blood pressure drugs: angiotensin converting enzyme inhibitors, and dihydropyridine-type calcium channel blockers.
Strategy 4 (Figure 6) includes “prior authorization” policies, in which physicians send to the insurer, by fax or phone, information about the patient's specific needs for the prescribed drug. In British Columbia, when a new drug class is included in the Reference Drug Program, PharmaCare “automatically” gives some patients prior-authorized exemptions, without physicians having to fax or phone, based on the patients’ indices of need in PharmaCare's databases. For example, patients who use certain other drugs that are markers of comorbidity or have a potential for adverse drug interactions are automatically exempted.
Figure 6.
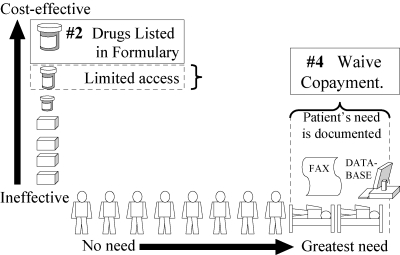
Strategy 4: Prior Authorization: Waive Copayment if Data Show Patient Has Special Need
Strategy 5 (no figure shown) adds a third dimension of information: the physician's characteristics and prescribing quality. For example, British Columbia's single on-line pharmacy record system, used by all pharmacies in the province, enables the full insurance coverage of certain drugs if they are prescribed by certain specialists, because their patients usually are sicker.
Different policies can be contrasted in Strategies 1 to 4 by graphing the amount paid by the patient versus that paid by the insurer (Figures 7 to 13). Figure 7 shows that an annual deductible requires the patient to initially pay the full price and therefore to be more sensitive to drug prices (vertical line showing the accumulation of the patient's expenditures while the insurer's expenditures remain zero). After a threshold has been passed, the insurer pays and the patient becomes insensitive to drug prices (horizontal line).
Figure 7.
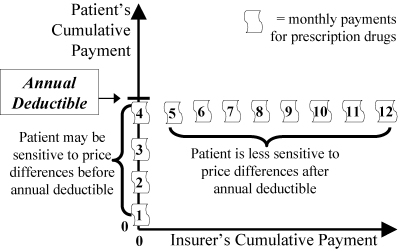
Annual Deductible (Strategy 1): Relation to the Patient's Sensitivity to Price Differences
Figure 13.
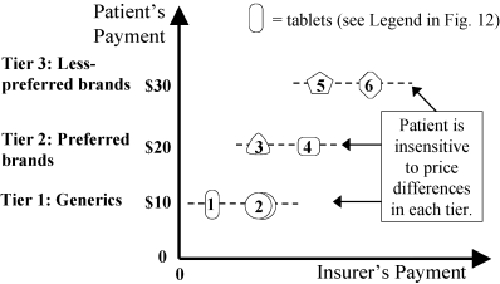
Three-Tier Copayments (Strategy 3): Patient Pays 1 of 3 Flat Fees. Insurer Pays the Rest.
In contrast, a simple cap policy (Figure 8) has the insurer pay (horizontal line) up to a certain threshold, above which the patient pays everything (vertical line). As Maio and colleagues (2005) argue, the major problem with a cap on the number or cost of all medications is that patients sometimes stop taking essential medications after they have exceeded the cap and thus may suffer adverse health consequences and have to increase their use of other health services.
Figure 8.
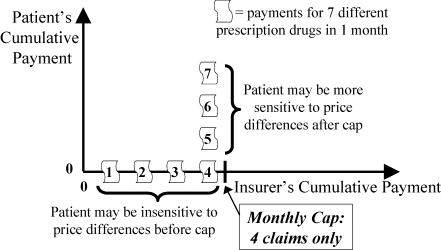
Monthly Cap (Strategy 1): Relation to the Patient's Sensitivity to Price Differences
An alternative to the patient's and the insurer's paying the full cost at different times (Figure 7: patient pays first, then insurer; Figure 8: insurer pays first, then patient) is for the patient and the insurer to share the cost simultaneously. This can be done by a variety of copayments. Figure 9 shows the simple idea of a 25 percent copayment by the patient, no matter what the cost or type of drug.
Figure 9.
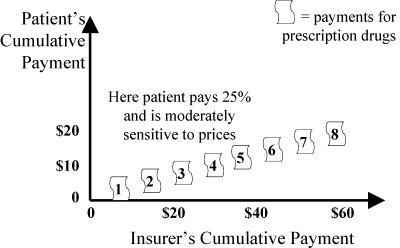
Fixed Coinsurance (Strategy 1): Patient or Second Insurer Pays a Fixed Percent of Drug Costs. Patient Is Sensitive to Price if He or She Copays.
For completeness, Figure 10 illustrates premiums. With each of the patient's payments for monthly premiums, the insurer's income from that patient accumulates.
Figure 10.
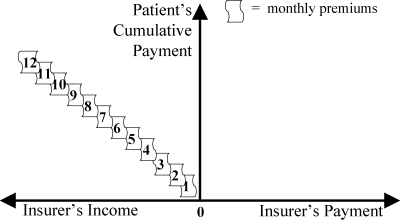
Monthly Premiums (Strategy 1)
Figures 7 to 10 can be combined to show the new U.S. Medicare drug program for seniors (Figure 11), as described by Maio and colleagues (2005).
Figure 11.
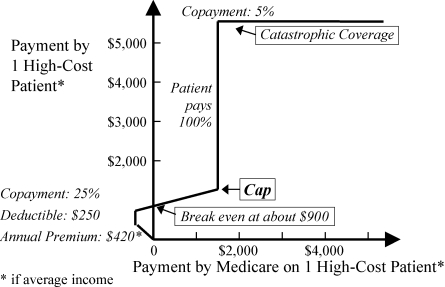
U.S. Medicare Program at a Glance
Specific Policies for Drug Classes
Whether and how a drug insurance policy is tailored to a particular drug class can radically change its performance. This fundamental idea deserves more attention than Maio and colleagues (2005) provide.
Whereas a cap on all drugs may cause a patient to stop taking an essential drug, a caplike MAC for one drug class in which prices vary widely can result in little or no adverse health effects. That is what studies of British Columbia's Reference Drug Program found. The most thorough evaluations (Schneeweiss, Soumerai, Maclure, et al. 2003; Schneeweiss, Walker, et al. 2002) showed that when the policy was applied to two classes of antihypertensive medications, it caused switching to less expensive drugs but no increase in stopping drug use nor any sign of adverse health events.
A similar type of graph is used to illustrate the differences among Strategies 2, 3, and 4 within a single drug class. Whereas Figures 7 through 9 show how patients and insurers share cumulative payments for all medications over time, Figures 12 through 17 illustrate how patients and insurers can share payments during a single purchase from one class of drugs. Consider, for example, the class of nonsteroidal anti-inflammatory drugs (NSAIDs). It includes inexpensive generic aspirin, ibuprofen, and naproxen, as well as much more expensive drugs, celecoxib (Celebrex) and the recently withdrawn rofecoxib (Vioxx). There are about 30 NSAIDs on the market, with prices ranging from about 5 cents to about C$1.80 per tablet in Canada. Figures 12 through 17 show patients’ sensitivity to the prices of six hypothetical NSAIDs, the least expensive being tablet 1 and the most expensive being tablet 6.
Figure 12.
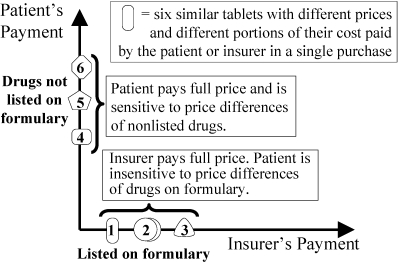
Formulary (Strategy 2): Patient Pays Full Price of Any Drug Not on Insurer's Approved List
Figure 17.
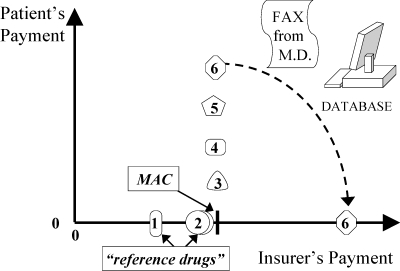
Prior Authorization (Strategy 4) within a Maximum Allowable Cost (MAC): Insurer Pays Full Price if Need Documented
Figure 12 shows that a simple formulary leaves patients completely insensitive to the price differences of drugs that are fully covered on the formulary (tablets 1 to 3) and highly sensitive to the price differences of unlisted drugs (tablets 4 to 6). Figure 13 shows that a three-tier copayment system makes patients only partially sensitive to price differences. Within each tier, patients are often unaware of large price differences among drugs that have no differences in effectiveness.
Figure 14 shows the rationale behind MAC policies like British Columbia's Reference Drug Program. Medications on the formulary (tablets 1 to 3) are fully covered. Medications that are “macked” or “referenced” (tablets 4 to 6) are partially covered. The patient pays any extra cost above the MAC (reference price). Patients are sensitive to such price differences over the MAC. Figure 14 is a simplification, as there are usually different MACs for different doses. A therapeutic MAC—a reference price for chemically distinct but therapeutically similar drugs—requires information about therapeutically similar doses of different drugs.
Figure 14.
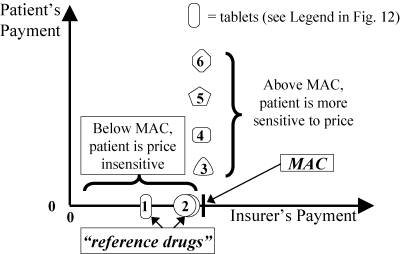
Maximum Allowable Cost (MAC) (Strategy 3). Patient Pays Extra Cost above a “Reference Price.”
A potential criticism of a MAC policy is the line's sudden change from horizontal to vertical. Manufacturers worry that such a sharp change might encourage a price war among rival companies as the arbitrary MAC is steadily lowered. Although their worry makes sense in theory, MAC policies by themselves do not seem to have caused major price reductions, at least not the kind of competitive low bidding that routinely occurs behind the closed doors of hospitals and managed care organizations.
An alternative policy, in theory less conducive to price wars, is three-tier coinsurance (Figure 15). The curve has a shape reminiscent of that of Figure 14 for the MAC policy, but with no sudden change. The patient is sensitive to price differences at every level, and price sensitivity increases when going from generics to preferred brands to less-preferred brands.
Figure 15.
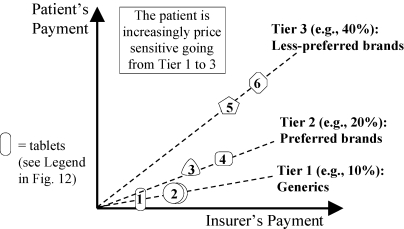
Three-Tier Coinsurance (Strategy 3). Patient Pays Lower Percent for Preferred Drugs.
According to Maio and colleagues (2005), prior authorization is explained as an exemption to a formulary restriction (Figure 16). Note that prior authorization is often used in conjunction with a MAC policy (Figure 17). For example, in British Columbia, more than 90 percent of physicians’ requests for exemptions to the Reference Drug Program are approved by PharmaCare, and yet the program still saves millions of dollars relative to that of other provinces in Canada (Marshall, Willison, et al. 2004).
Figure 16.
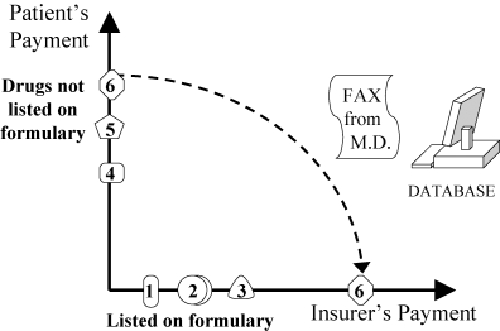
Prior Authorization (Strategy 4) within a Formulary: Insurer Pays if Need Is Documented
In conclusion, drug insurers have a growing menu of policy options for channeling payments to patients with greater financial and health needs. Rigorous impact evaluations are needed to establish which options are better. I predict that the best policies will be those that combine four types of information: (1) evidence of drug effectiveness, (2) relative prices for similar drugs, (3) individual patients’ health status, and (4) families’ financial needs.
Acknowledgments
Funding for this review was provided by Dr. Maclure's Distinguished Scholar Award from the Michael Smith Foundation for Health Research, Vancouver, B.C., and Contribution 6804-15-2003/5590012 from the Best Practice Contribution Program, Health Canada, Ottawa. Thanks to Bob Nakagawa and Dr. Steve Morgan for their helpful suggestions.
References
- Anis AH. National Pharmacare: A Dog's Tale. Canadian Medical Association Journal. 2004;171:565–6. doi: 10.1503/cmaj.1020352. 10.1503/cmaj.1020352. [DOI] [PMC free article] [PubMed] [Google Scholar]
- Bowyer S, McQueen N On Behalf of Employer Committee on Health Care in Ontario (ECHCO) Toronto Commission Consultations, May 31, 17. Saskatoon: Commission on the Future of Health Care in Canada; 2002. [accessed January 11, 2005]. appendix to Building on Values: The Future of Health Care in Canada, by R.J. Romanow Available at http://www.hc-sc.gc.ca/english/pdf/romanow/pdfs/Toronto_Day_1_E.pdf. [Google Scholar]
- Canadian Institute for Health Information. Spending on Prescribed Drugs Continues to Increase. 2003. [accessed January 11, 2005]. Available at http://secure.cihi.ca/cihiweb/en/media_23apr2003_fig4_e.html.
- Government of British Columbia, Ministry of Health Services. 2004/05–2006/07 Service Plan. Resource Summary. 2004. [accessed January 11, 2005]. Available at http://www.bcbudget.gov.bc.ca/sp2004/hs/hs_summary.htm.
- Grootendorst PV, Dolovich LR, Holbrook AM, Levy AR, O’Brien BJ. [accessed January 11, 2005];The Impact of Reference Pricing of Cardiovascular Drugs on Health Care Costs and Health Outcomes: Evidence from British Columbia. 2002 2 Technical Report SEDAP Research paper no. 71. Hamilton, Ont.: Social and Economic Dimensions of an Aging Population, McMaster University. Available at http://socserv.socsci.mcmaster.ca/sedap/p/sedap71.pdf. [Google Scholar]
- Grootendorst PV, Dolovich LR, O’Brien BJ, Holbrook AM, Levy AR. Impact of Reference-Based Pricing of Nitrates on the Use and Costs of Anti-Anginal Drugs. Canadian Medical Association Journal. 2001;165:1011–9. [PMC free article] [PubMed] [Google Scholar]
- Hazlet TK, Blough DK. Health Services Utilization with Reference Drug Pricing of Histamine-2 Receptor Antagonists in British Columbia Elderly. Medical Care. 2002;40:640–9. doi: 10.1097/00005650-200208000-00003. 10.1097/00005650-200208000-00003. [DOI] [PubMed] [Google Scholar]
- Hurley J. Health Care at a Premium. Canadian Medical Association Journal. 2004;170:1906–7. doi: 10.1503/cmaj.1040858. 10.1503/cmaj.1040858. [DOI] [PMC free article] [PubMed] [Google Scholar]
- Maio V, Pizzi L, Roumm A, Clarke J, Goldfarb N, Nash D, Chess D. Pharmacy Utilization and the Medicare Modernization Act. Milbank Quarterly. 2005;83(1):99–128. doi: 10.1111/j.0887-378X.2005.00337.x. [DOI] [PMC free article] [PubMed] [Google Scholar]
- Marshall DA, Willison D, Sykora K, Forde N, Mamdani M, Grootendorst P, LeLorier J, Maclure M, Morgan S, Warren L, Rahme E, Fortin PR. Montreal: 2004. Impact of Administrative Restrictions for Coxibs in Quebec (PQ), Ontario (ON) and British Columbia (BC). Paper presented at the first annual meeting of the Canadian Association of Health Services and Policy Research; pp. 26–28. May. [Google Scholar]
- Marshall JK, Grootendorst PV, O’Brien BJ, Dolovich LR, Holbrook AM, Levy AR. Impact of Reference-Based Pricing for Histamine-2 Receptor Antagonists and Restricted Access for Proton Pump Inhibitors in British Columbia. Canadian Medical Association Journal. 2004;166:1655–62. [PMC free article] [PubMed] [Google Scholar]
- Narine L, Senathirajah M, Smith T. An Assessment of the Impact of Reference-Based Pricing Policies on the H2 Antagonist Market in British Columbia, Canada. Journal of Research in Pharmaceutical Economics. 2001;11:63–78. 10.1300/J063v11n01_05. [Google Scholar]
- Schneeweiss S, Dormuth C, Grootendorst P, Maclure M. Net Health Plan Savings from Reference Drug Pricing for Angiotensin-Converting Enzyme Inhibitors in Elderly British Columbia Residents. Medical Care. 2004;42:653–60. doi: 10.1097/01.mlr.0000129497.10930.a2. 10.1097/01.mlr.0000129497.10930.a2. [DOI] [PubMed] [Google Scholar]
- Schneeweiss S, Maclure M, Soumerai SB. Prescription Duration after Drug Copay Changes in Older People: Methodological Aspects. Journal of the American Geriatric Society. 2002;50:521–5. doi: 10.1046/j.1532-5415.2002.50120.x. 10.1046/j.1532-5415.2002.50120.x. [DOI] [PubMed] [Google Scholar]
- Schneeweiss S, Soumerai SB, Glynn RJ, Maclure M, Dormuth C, Walker AM. Impact of Reference-Based Pricing for Angiotensin-Converting Enzyme Inhibitors on Drug Utilization. Canadian Medical Association Journal. 2002;166:737–45. [PMC free article] [PubMed] [Google Scholar]
- Schneeweiss S, Soumerai SB, Maclure M, Dormuth C, Walker AM, Glynn RJ. Clinical and Economic Consequences of Reference Pricing for Dihydropyridine Calcium Channel Blockers. Clinical Pharmacology and Therapeutics. 2003;74:388–400. doi: 10.1016/S0009-9236(03)00227-3. 10.1016/S0009-9236(03)00227-3. [DOI] [PubMed] [Google Scholar]
- Schneeweiss S, Walker AM, Glynn RJ, Maclure M, Dormuth C, Soumerai SB. Outcomes of Reference Pricing for Angiotensin-Converting-Enzyme Inhibitors. New England Journal of Medicine. 2002;346:822–9. doi: 10.1056/NEJMsa003087. 10.1056/NEJMsa003087. [DOI] [PubMed] [Google Scholar]


