

Abstract
Using two genetic approaches and seven different plant systems, we present findings from a meta-analysis examining the strength of the effects of plant genetic introgression and genotypic diversity across individual, community and ecosystem levels with the goal of synthesizing the patterns to date. We found that (i) the strength of plant genetic effects can be quite high; however, the overall strength of genetic effects on most response variables declined as the levels of organization increased. (ii) Plant genetic effects varied such that introgression had a greater impact on individual phenotypes than extended effects on arthropods or microbes/fungi. By contrast, the greatest effects of genotypic diversity were on arthropods. (iii) Plant genetic effects were greater on above-ground versus below-ground processes, but there was no difference between terrestrial and aquatic environments. (iv) The strength of the effects of intraspecific genotypic diversity tended to be weaker than interspecific genetic introgression. (v) Although genetic effects generally decline across levels of organization, in some cases they do not, suggesting that specific organisms and/or processes may respond more than others to underlying genetic variation. Because patterns in the overall impacts of introgression and genotypic diversity were generally consistent across diverse study systems and consistent with theoretical expectations, these results provide generality for understanding the extended consequences of plant genetic variation across levels of organization, with evolutionary implications.
Keywords: community and ecosystem genetics, meta-analysis, intraspecific variation, introgression, genotypic diversity, genes to ecosystems
1. Introduction
Recent reviews in the field of community and ecosystem genetics have provided strong evidence that plant genetic factors can have distinct community and ecosystem phenotypes, that these phenotypes can be heritable and that the community phenotype can feed back to affect the fitness of the individual plant genotypes (Fritz 1999; Whitham et al. 1999, 2003, 2006, 2008; Bradley & Pregitzer 2007; Johnson & Stinchcombe 2007; Hughes et al. 2008). Reviews to date have covered a range of conceptual topics including (i) the role of plant hybridization in maintaining associated biodiversity (Fritz 1999), (ii) genes to ecosystems links (Whitham et al. 2003, 2006), (iii) the importance of functional genomics to community genetics (Whitham et al. 2008), (iv) the role of genetically based feedbacks in community genetics (Whitham et al. 2003, 2006; Schweitzer et al. 2008b), and (v) the effects of genotypic diversity on community- and ecosystem-level properties (Whitham et al. 2006; Bradley & Pregitzer 2007; Johnson & Stinchcombe 2007; Hughes et al. 2008). Such a diverse array of topics clearly link genetic variation in plants to community and ecosystem processes, and provide compelling evidence for the importance of bridging community and ecosystem ecology with evolutionary biology. However, these reviews are largely qualitative, providing conceptual frameworks for understanding how genetic variation in one species may affect community traits and ecosystem services with little comparative synthesis of the broader patterns in the strength of plant genetic effects within or across systems.
Owing to the qualitative nature of the recent reviews described above, it remains unclear whether plant genetic variation affects all individual-, community- and ecosystem-level phenotypes equally or whether particular traits, community dynamics or ecosystem processes are more likely to be under genetic control. If there is significant variation in the effects of plant genetic variation across levels of organization, as we expect, then a finding of significant effects of plant genetic variation on community- and ecosystem-level phenotypes reveals the specific traits and processes upon which genetic variation may act most strongly relative to the background average effect size. Moreover, understanding the average effect size of plant genetic variation across levels of organization (i.e. individual-, community- and ecosystem-level phenotypes; sensu Whitham et al. 2006) provides a framework of comparison for future genes-to-ecosystems research. These results may provide novel insights into when and where we should expect genetic variation to have its strongest effects, potentially reveal new research questions and testable hypotheses that are relevant to investigate and advance the broad field of ecological genetics, and provide a comparison for other ecological effect sizes.
Here, we apply meta-analysis to evaluate the strength of plant genetic effects on individuals, populations, communities and ecosystems across multiple environmental gradients. Specifically, we focus on the role of (i) introgression in a Populus hybridizing system and (ii) genotypic diversity across multiple plant systems. While these same relationships are beginning to be examined in animal systems (Post et al. 2008; Palkovacs & Post in press; Palkovacs et al. 2009), we focus on the effects of plant systems and the linkage between plant genetics and community and ecosystem phenotypes. In terms of introgression, Populus represents a model system to examine how hybridization affects community dynamics and ecosystem processes across diverse environments. Populus spp. are recognized as a ‘foundation’ riparian forest tree (Ellison et al. 2005) that can have significant impacts on biodiversity and ecosystem functions, and it commonly hybridizes wherever two or more species co-occur (Eckenwalder 1984). Along the Weber River, Utah, the ranges of Populus fremontii S. Wats and Populus angustifolia James overlap in a 13 km zone, where the two species naturally hybridize with introgression occurring unidirectionally towards P. angustifolia (Keim et al. 1989; Martinsen et al. 2001). Owing to unidirectional introgression, hybridization represents a partial genetic continuum between P. fremontii and P. angustifolia, which results in a large amount of genetic variation (Keim et al. 1989; Martinsen et al. 2001) with associated variation in community and ecosystem phenotypes that affect individuals, community structure, biodiversity and ecosystem processes (Whitham et al. 2006). The abundance of ecological data on Populus has great potential for synthesizing the effects of introgression across levels of organization and environments (Bangert et al. 2008).
The second common approach for examining the strength of plant genetic effects on their associated communities and ecosystems in diverse systems is to examine the role of genotypic variation. Recent studies have focused on the effects of plant genotypic diversity on associated communities and ecosystem processes (described in §§2 and 3). By manipulating single and multiple genotype plots, studies of the effects of genotypic diversity provide insights into how increasing plant genetic variation and their associated phenotypes may influence species interactions and ecosystem processes.
Using these two approaches, we conducted a meta-analysis to examine the role of plant genetic factors on communities and ecosystems across environments to examine two specific questions. First, does the effect of genetic introgression vary across levels of organization? Community and ecosystem phenotypes clearly represent complex traits where the genes of one species are the environment of another species (i.e. interspecific indirect genetic effects; Thompson 2005; Shuster et al. 2006; Whitham et al. 2006; Wade 2007). Because the biotic environmental variation associated with community and ecosystem phenotypes increases, one would predict that the strength of the effects of introgression on community and ecosystem phenotypes is likely to decline across levels of organization, with the greatest effects occurring at the individual level and the weakest effects occurring at the ecosystem level (box 1). Second, focusing on genotypic diversity, we hypothesize that similar effects will be found, although with different genetic mechanisms. Specifically, we predict that the individual, community and ecosystem consequences of genotypic diversity may be weaker than those of introgression, as they result from the combined interactions of individuals within a population rather than the individual effects of introgression. Taking this two-tiered approach allows us to empirically examine the strength of genetic effects and understand the broad consequences of plant genetic factors across species and environmental gradients. Relative to the background average effect size in ecology of r=0.18–0.19 established in a meta-analysis of 42 meta-analyses based upon positive and negative statistical results (Møller & Jennions 2002), our results suggest that plant genetic factors may explain up to twice as much variation in effect size regardless of the level of organization.
Box 1.
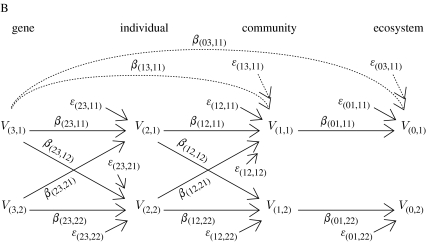
One would expect the effect size of genetic variation in one individual to decline across levels of organization. For example, consider a single gene V3 that determines the phenotype V2 of an individual. The phenotype of this individual affects the phenotype of its community V1, which in turn affects the phenotype of the ecosystem V0 to which this community belongs (figure A). For example, a single gene V3 determines foliar condensed tannin concentration V2 of an individual. Foliar condensed tannin concentration affects soil microbial community composition and activity V1, which in turn affects soil nutrient cycling V0. In this simple model, the gene is the independent variable and the ecosystem is the dependent variable. The phenotype and the community are intermediate variables. Assume that the relationship between any two variables is linear (if this were not true, consider small deviations from the mean, which makes a first-order approximation good enough). Let /σi be the standardized variable Vi (where is the mean value of variable i and σi is its standard deviation). The coefficient in each path joining variables Vi and Vj, βji, is the regression coefficient of variable Xj on Xi, i.e. Xj=βjiXi+ϵij, where ϵij is the error term. Coefficient βij measures the effect of a change in variable Vi on variable Vj, if all other variables remain constant. From path analysis (Wright 1934), the effect of a variable on another variable separated by n paths is the product of the coefficients corresponding to those paths, e.g. the effect of gene V3 on the ecosystem is X0=β01β12β23X3+δ03, where δ03=β01β12ϵ23+β01ϵ12+ϵ01 is the error term (note how the error term grows as we add paths). We are interested in determining under which conditions the effect of a variable Vi on the variables in its immediate superior level of organization Vj (where j>i) is greater than the effect of the same variable on variables in levels of organization above the immediate one Vk (where k>j), i.e. |βji|>|βki| for all k>j. Such condition implies that the effect of a particular variable decreases as we consider higher levels of organization. In the model presented, condition |βji|>|βki| translates into three inequalities: |β23|>|β13|; |β23|>|β03|; and |β13|>|β03|. That is, the effect of a gene on a plant phenotype must be greater than the effect of that gene on an community phenotype (as acting through that trait), the effects of a gene on a plant phenotype must be greater than the effect of that gene on an ecosystem phenotype (as acting through that plant trait in its community) and the effect of a gene on its community phenotype must be greater than the effect of that gene on its ecosystem phenotype. Using path analysis, we can replace coefficients β03 and β13 for the product of the coefficients joining variables V0–V3 and V1–V3, respectively, obtaining |β23|>|β23β12|, |β23|>|β23β12β01| and |β23β12|>|β23β12β01|. These inequalities yield two simple conditions, namely the effect of the phenotype on the community and of the community on the environment have to be less than 1, i.e. |β12|, |β01|<1. In general, if the effects of one variable on another variable are small, these conditions will be satisfied. If these effects are big, however, or the interaction between variables is not linear, the above conditions will not be satisfied. In a genes-to-ecosystems context, such nonlinear effects may be a consequence of (i) indirect genetic effects among interacting species and (ii) feedback loops among levels of organization. Indirect genetic effects occur when the genes of one individual influence the fitness and phenotype of an associated individual of the same species (intraspecific indirect genetic effects) or different species (interspecific indirect genetic effects; see Shuster et al. 2006), and are fundamental to the coevolutionary process.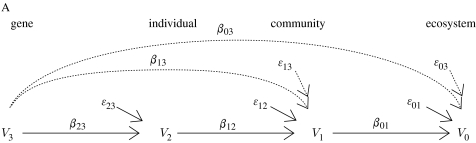 In figure B, we present a more complex interaction in which a gene in individual 1, V(3,1), affects two traits in different individuals, V(2,1) and V(2,2), which in turn affects the phenotype of the community the first individual belongs to, V(1,1). Let X(i,m) be the standardized variable V(i,m). The coefficient in each path joining variables Vi and Vj, βji, is the regression coefficient of variable X(j,n) on X(i,m), i.e. X(j,n)=β(ji,nm) X(i,m)+ϵ(ji,nm), where ϵ(ji,nm) is the error term. From path analysis, the effect of gene V(3,1) on its ecosystem is X(0,1)=β(01,11)(β(12,11)β(23,11)+β(12,12)β(23,21))X(3,1)+δ(03,11), where δ(03,11)=β(01,11)(β(12,11)ϵ(23,11)+β(12,12)ϵ(23,12)+ϵ(12,11)ϵ(12,12))+ϵ(01,11) is the error term. If we carry out a similar analysis, we can conclude that the effect size will decline across levels of organization only under more restrictive conditions. Hence, as we add indirect genetic effects and interactions among levels of organization there is a greater chance that genetic effect size will not decline across levels of organization.
2. Material and methods
Meta-analysis is a statistical method that allows for the combined analysis of independent studies that address a similar scientific question. This combined analysis is done by estimating a mean effect size for all tests (i.e. significant and non-significant) used in the meta-analysis and then identifying the factors that may influence the magnitude of the effect (Gurevitch & Hedges 2001). We conducted two independent meta-analyses to examine the strength of genetic effects on community and ecosystem processes across environments, one examining introgression and the other examining genotypic diversity. For both approaches, we compared genetic effect size across three sources of variation: (i) level of organization (i.e. individual, community or ecosystem), (ii) taxa (i.e. plants, arthropods and microbes/fungi), and (iii) environment (i.e. above- or below-ground, terrestrial or aquatic; see Whitham et al. (2006) for definitions). Although there are many data on the effects of hybridization on associated biodiversity (reviews by Strauss 1994; Fritz 1999; Whitham et al. 1999), these systems have generally not been characterized by molecular genetic techniques. We restricted ourselves to introgression datasets from the Populus system because it has been characterized with a range of molecular techniques to identify plant genotype and address the genetic basis of many community- and ecosystem-level phenotypes (Whitham et al. 1999, 2003, 2006). By restricting our dataset, we eliminate bias that can arise in estimates of genetic correlations due to variation in breeding design across studies (e.g. clones, full-sib and half-sib families). The final dataset consisted of 16 studies published since 2002 (i.e. when the molecular data became widely available), 6 unpublished datasets and 107 separate tests, examining the relationship between the proportion of introgressed P. fremontii molecular markers and associated phenotypes in a common garden experimental setting (see the electronic supplementary material for a complete list of studies and tests).
The second meta-analysis was focused on the strength of the effects of plant genotypic diversity in natural systems. In contrast to genetic introgression that focuses on the interspecific flow of genes between species, genotypic diversity is characterized as the intraspecific diversity of plant genotypes within a given location or population of a single species. We were specifically interested in those studies that experimentally manipulated the diversity of plant genotypes (e.g. 1, 2, 4, 8 and 16 genotype experimental units). Our search was conducted using the Web of Science search engine. We used the combination of the keywords, ‘plant genotypic diversity’, ‘biodiversity’ (for community phenotypes) and ‘ecosystem’. The search engine returned with 17 results (and several other studies were found within the literature cited of these papers). These were reduced to those studies conducted in natural systems and which experimentally manipulated the number of genotypes and focused on a range of community- and ecosystem-level phenotypes. When these studies included individual-level phenotypes, those were included as well, although studies focused solely on individual-level phenotypes were excluded from the analysis. For the second meta-analysis, we used 11 studies published since 2002, 1 unpublished dataset and 90 individual tests (see the electronic supplementary material). These studies covered seven different ecosystem types from aquatic seagrass (Zostera marina), herbaceous systems such as Oenothera biennis and Solidago altissima, to woody plants such as Quercus laevis and Populus spp. These plant systems are distributed broadly, primarily across North America. Data from these studies were characterized identically to the previous meta-analysis and the same methods of analysis were used (see the electronic supplementary material for a complete list of studies and tests). Because introgression and genotypic diversity are very different experimental approaches to the same types of questions, we believe that this is a robust approach to understanding the general consequences of plant genetic factors.
Meta-analysis was conducted using MetaWin v. 2.1 (Rosenberg et al. 2000). All studies used in these analyses examined the correlation between genetic introgression or genotypic diversity and individual-, community- and ecosystem-level phenotypes. Individual-level phenotypes that were surveyed included phytochemistry, architectural and physiological traits. Community-level phenotypes were characterized by species richness, total abundance and community composition. Ecosystem-level phenotypes were characterized by energy flow or energy transformation and included leaf litter decomposition studies, which are focused on productivity and carbon accumulation, as well as on soil nutrient dynamics. We used the Pearson product-moment correlation coefficient r to measure effect size. When correlation coefficients were not reported in a study, we calculated them from the F or Χ2 values presented in figures and tables or calculated the square root of the coefficient of determination (r2; see Rosenberg et al. 2000 for formulae). When these statistics could not be obtained, the study was excluded from the meta-analysis. Because we were interested in the percentage of variation explained by plant genetic factors, we disregarded the sign of the relationship between genetic introgression and genotypic diversity and the response variables and focused on the absolute value of the correlation coefficient. The correlation coefficient from each individual test was Z-transformed and weighted by their sample size. We used a mixed-effects model to combine the transformed coefficients. Mixed-effects models assume that differences among studies are due to sampling error and random variation (Gurevitch & Hedges 2001). We used bias-corrected 95% bootstrap confidence intervals (CIs) that were generated from 4999 iterations (Adams et al. 1997) to define the significance of the relationship between genetic introgression and the response variables.
To understand the factors that affect the magnitude of the correlation between introgression and the response variables that were measured, we subdivided studies on the basis of several potential explanatory variables/source of variation and examined among group heterogeneities, using a Χ2-test statistic Qb. To examine the range and distribution of the correlations used in these analyses, and to test for publication bias, we used a funnel plot approach (Light & Pillemer 1984; Palmer 1999). We found no evidence of publication bias, indicating that both positive and negative data were being reported.
3. Results
(a) Introgression
(i) Levels of organization and organism type
Consistent with our prediction, we found a significant decline in the strength of the effects of genetic introgression across individual- (e.g. chemical, morphological or resistance traits), community- (species richness, total abundance, composition or diversity) or ecosystem- (energy transformations or nutrient cycling) level phenotypes (Q2=6.47, p=0.042; figure 1a). The mean effect sizes of genetic introgression across levels of organization were moderate ranging from Z(r)=0.45 for individual-, Z(r)=0.29 for community- and Z(r)=0.20 for ecosystem-level phenotypes (back-calculated r=0.42, 0.28 and 0.20, respectively). These results are consistent with the hypothesis that when environmental variation increases, the role of plant genetic factors declines.
Figure 1.

Comparison of the effect size of (a) introgression and (b) genotypic diversity across levels of organization (i.e. on individual-, community- and ecosystem-level phenotypes). (a, b) When tests are characterized as individual-, community- or ecosystem-level phenotypes, there is a significant difference in the effect size of introgression. Bars represent mean effect size ±95% CI. Dashed line represents average effect size across all levels of organization.
Importantly, while the overall strength of the effects of introgression was moderate across levels of organization, there were still some relatively strong interactions at the community and ecosystem levels. For example, effect sizes ranged from Z(r)=0 to 1.47 among individual phenotypes, 0.05 to 1.22 among community phenotypes and 0 to 0.77 among ecosystem phenotypes. Such strong effects on particular groups suggest that specific organisms or processes may be more responsive than others to the effects of introgression.
Consistent with the prediction that there is variation in the effects of introgression among organism types, we found that the mean effects of introgression were larger on individual phenotypes of the plants, relative to the extended phenotypic effects on associated arthropods, microbes and fungi (Q2=54.39, p=0.001; figure 2a). The effect size was moderate overall and varied from Z(r)=0.1 for microbes and fungi to 0.62 for plant traits, with arthropods being intermediate (back-calculated r=0.1 for microbes and fungi, 0.55 for plants and 0.36 for arthropods). Effect sizes ranged from Z(r)=0.02 to 1.47 for plants, 0 to 1.22 for arthropods and 0 to 0.92 for microbes and fungi. These results indicate that there are broad effects of introgression across many types of organisms, but the effects tend to decline when the organisms are external to the plant itself.
Figure 2.

Comparison of the effect size of (a) introgression and (b) genotypic diversity across taxa. (a) When tests are characterized as effects on plants, arthropods or soil and litter microbes and fungi, there are significant differences among groups in the effect size of introgression. Genetic introgression acts more strongly on the phenotypes of the plants themselves than on associated arthropods or microbes; however, the effect size is large regardless. Panel (b) shows a similar pattern, but stronger effects on arthropods than either individual phenotypes or microbes. Bars represent mean effect size±95% CI. Dashed line represents average effect size across all levels of organization.
(ii) Environment type
Consistent with our data and expectations, we found that the effects of introgression were greater in aboveground than below-ground environments (Q1=35.54, p=0.001; figure 3a). The mean effect size was moderate for above-ground environments Z(r)=0.53 and weak for below-ground Z(r)=0.15 (back-calculated r=0.5 and 0.14, respectively), roughly a threefold difference. The effect sizes ranged from 0 to 1.37 for both above- and below-ground environments. However, as our sample sizes are skewed, where the measured microbes and fungi were associated with below-ground environments and canopy arthropods were associated with above-ground environments, it is difficult to accurately determine whether the effect sizes of introgression can be attributed to the specific organism upon which they are acting or to the environmental condition, but is probably some combination of the two. Because soil microbes generally mediate below-ground soil processes, it seems reasonable that the effects of introgression on below-ground environments are indirect.
Figure 3.

Comparison of the effect size of (a, b) introgression and (b, d) genotypic diversity across diverse environments. (a) When tests are characterized as above or below-ground, the effects of introgression are stronger on above-ground traits and processes than below-ground. (b) When tests are characterized as terrestrial or aquatic, there is no difference in the effects of introgression in aquatic versus terrestrial environments. (c) Patterns are similar for genotypic diversity, where a significant difference is found in the effects of genotypic diversity on above- and below-ground traits and processes. (d) The effects of genotypic diversity are not different in terrestrial and aquatic systems. Bars represent mean effect size±95% CI. Dashed line represents average effect size across all levels of organization.
In contrast to our prediction, the effects of introgression were not significantly different in aquatic versus terrestrial environments (Q1=0.92, p=0.93; figure 3b). Estimates of mean effect size were moderate for both environments. Effect sizes ranged from Z(r)=0.39 in aquatic environments to 0.40 in terrestrial systems. The effect sizes ranged from 0 to 1.37 for terrestrial environments and 0 to 1.47 for aquatic environments.
(b) Genotypic diversity
(i) Levels of organization and organism type
Consistent with the results from the introgression meta-analysis, we found a significant difference in the effects of genotypic diversity when the data were characterized as individual-, community- or ecosystem-level phenotypes (Q2=14.4, p=0.003; figure 1b). In general, the strongest effects of genotypic diversity were observed at the individual (Z(r)=0.29) and community (0.23) levels. These effects declined at the ecosystem level (0.13), where the strength of the effects of genotypic diversity was roughly half that at the individual or community level (back-calculated r=0.3, 0.25 and 0.13, respectively). We emphasize that while the overall mean strength of the effects of genotypic diversity was moderate across levels of organization, there were still some strong effects at the community and ecosystem levels. For example, effect sizes ranged from Z(r)=0 to 0.42 among individual phenotypes, 0 to 0.47 among community phenotypes and 0 to 0.49 among ecosystem phenotypes. Such effects on particular groups suggest that specific organisms or processes may be more responsive than others to genotypic diversity.
Results bearing on the strength of the effects of genotypic diversity on particular organisms were inconsistent with patterns that were found in the genetic introgression meta-analysis. There were significant differences in the strength of the effect of genotypic diversity on individual phenotypes of the plants, relative to the extended phenotypic effects on arthropods or microbes (Q2=9.37, p=0.027; figure 2b); however, the strongest mean effects of genotypic diversity were on the associated arthropods (Z(r)=0.15, 0.23 and 0.14, respectively). In general, the effects of genotypic diversity were twice as strong on arthropods as they were on the plants themselves or soil microbial communities (back-calculated r=0.27, 0.13 and 0.14, respectively). This may be an artefact of a small sample size in the category of individual-level plant phenotypes. Effect sizes ranged from Z(r)=0.03 to 0.42 for plants, 0 to 0.47 for arthropods and 0 to 0.49 for microbes and fungi.
(ii) Environment type
Consistent with the effects of introgression in Populus spp., there was a significant difference in the effects of genotypic diversity on above-ground versus below-ground traits (Q1=14.9, p=0.002; figure 3c). The effects of genotypic diversity were two times stronger above ground than below ground (Z(r)=0.24 and 0.13, respectively), which is consistent with the moderate effects of genotypic diversity on soil microbes (back-calculated r=0.27 and 0.13, respectively). However, interpretation is still confounded because the microbes and fungi quantified were associated with below ground environments.
Consistent with the introgression patterns, there was no difference in the mean effect sizes as they relate to genotypic diversity in terrestrial or aquatic environments (Q1=0.42, p=0.58; figure 3d). Overall, the effects of genotypic diversity were equivalent (Z(r)=0.18 and 0.22, respectively). These data indicate that genetically based links between terrestrial and aquatic systems may be important.
Consistent with the hypothesis that when environmental variation increases the role of plant genetic variation declines, there were significant differences in the strength of the effects of both genetic introgression and genotypic diversity (Q1=24.5, p=0.001). The effect size of introgression was twice that of genotypic diversity (Z(r)=0.39 and 0.20, respectively; back-calculated r=0.38 and 0.20). Effect sizes ranged from Z(r)=0 to 1.47 for the introgression study and 0 to 0.49 for the genotypic diversity study. This range of variation suggests that, irrespective of the approach, there can be strong effects of plant genetic factors on specific organisms or processes. As the study of genetic introgression is concerned with the specific genetic structure of individuals within populations and genotypic diversity is concerned with the genetic structure of populations, weaker genetic effects would be expected using a genotypic diversity approach due to increased environmental heterogeneity and subsequent selection gradients altering the genetic structure of the population.
4. Discussion
The results to date suggest broad generality for the consequences of plant genetic variation on shaping the phenotypes of individuals, their associated communities and even ecosystem processes. Although plant genetic variation does not always have strong effects on all species in all environments, it can strongly affect particular phenotypes and processes across all of the systems examined. That said, the overall mean effect size of plant genetic factors based upon these meta-analyses can be considered moderate relative to Cohen's benchmarks (Rosenberg et al. 2000; Møller & Jennions 2002). Because this meta-analysis was based upon both positive and negative statistical tests, the fact that the effects of plant genetic variation on community- and ecosystem-level phenotypes can be three times as high as the average ecological effect size from Møller & Jennions (2002) justifies a community genetics approach, and further analyses to determine under what circumstances these large effects occur. Our model (box 1) suggests that large effects at higher levels of organization arise from non-additive, nonlinear dynamics and interactions among levels of organization. While a few studies are emerging that demonstrate the importance of non-additivity and epistatic interactions among individuals to biodiversity and ecosystem function (Schweitzer et al. 2005; Crutsinger et al. 2006; Johnson et al. 2006; Hughes et al. 2008), the prevalence of and mechanisms for these effects are not well understood. Moreover, the consideration of multilevel selection in genes-to-ecosystems research (i.e. interaction among levels of organization) has not been well incorporated into the field and may provide novel theoretical inroads into the mechanisms of extended consequences of plant genetic factors (Shuster et al. 2006; Wade 2007).
(a) Declining effect size across individual, community and ecosystem levels
Although many aspects of communities and ecosystems are inherently variable (Lawton 1999), our results suggest that when plants provide the fundamental resources to organisms, there appears to be broad generality in the effects of plant genetic variation at the community and ecosystem levels. While interest continues to grow in the effects of genetic factors that extend beyond the individual, it is generally assumed that the role of plant genetics declines at levels higher than the population (Whitham et al. 2003, 2006). Consistent with this hypothesis, using two different approaches to understanding the effects of plant genetic factors, we found a significant difference in effect size across levels of organization. Although the effects of introgression and genotypic diversity were strongest at the individual level and declined at the community and ecosystem levels, in some systems, plant genetics strongly affects trophic interactions, carbon accumulation and the nitrogen cycle (Schweitzer et al. 2004; Whitham et al. 2008).
Two hypotheses that may be related to these patterns are that the effects of plant genetic factors vary by the type of organism they affect or depending upon the environment in which they act. We predicted that genetic effects would be expressed most strongly in the individual possessing those genes and decline with increasing species interactions. As ecosystem processes, by definition, are focused on energy and nutrient dynamics in a specific environment that are dependent upon species interactions, one might expect that the effects of plant genetics would vary among organism types. Consistent with this prediction, our results indicate that the strength of plant genetic effects is greatest on individual phenotypes and becomes weaker on arthropods and still weaker on microbes and fungi. However, specific examples indicate that the effects of plant genetics on microbial communities can be large. For example, Schweitzer et al. (2008a) found that plant genotype predictably structured soil microbial community composition in P. angustifolia, and affected microbial biomass nitrogen pools. Such results have important implications for our understanding of feedbacks in natural systems (Palkovacs & Post 2008; Palkovacs et al. 2009). Genetic variation for the process of nitrogen mineralization indicates that plants effectively determine their nutrient environment and affect their own fitness via interactions with soil microbes (Schweitzer et al. 2008a).
Our meta-analysis also indicated significantly reduced effects of plant genetic factors in below-ground versus above-ground environments. Because we cannot separate the effects of environment versus organism type (i.e. all microbes except one were sampled in below-ground environments and all arthropods were sampled above ground), it is difficult to say whether these reduced effects of plant genetic variation below ground are due to biotic or abiotic variation.
(b) Consistency of patterns across individual, community and ecosystem levels
We found consistency among studies in the patterns across levels of organization, in the effects of introgression and genotypic diversity across seven different plant systems broadly distributed across biomes of North America. Because these patterns were generally in accord with theoretical models, our results suggest broad generality for the consequences of plant genetic variation across different levels of organization. Recent hypotheses in genes-to-ecosystems research have suggested that as environmental variability increases, the strength of plant genetic effects declines (Johnson & Agrawal 2005; Bangert et al. 2006a,b). In general, as more variation is explained by environment, less will be explained by genetics. While this hypothesis has largely been focused on the role of spatial or abiotic environmental parameters, at the community and ecosystem levels, the role of biotic environmental variation has a critical role in the coevolutionary process.
Phenotypic traits can be characterized at a number of levels that depend on traits at lower levels (Conner & Hartl 2004). An organism's lifespan is influenced by behavioural, morphological and physiological traits, all governed by various gene loci. Typically, traits that are higher in this hierarchy are more complex and affected by more loci (Conner & Hartl 2004). Thus, the expression of complex traits often varies depending upon environmental factors (e.g. expression of phenotypic plasticity). Recent theory in the fields of community genetics (Shuster et al. 2006) and coevolution (Yoshida et al. 2003; Fussmann et al. 2005; Hairston et al. 2005; Thompson 2005; Jones et al. 2009) has provided independent but convergent evidence that community and ecosystem phenotypes represent complex traits related to the fitness consequences of interspecific indirect genetic interactions among all interacting species (Thompson 2005; Shuster et al. 2006; Whitham et al. 2006). Because community and ecosystem phenotypes represent complex traits, one would predict that they probably vary phenotypically depending upon abiotic and biotic environmental factors and may even show genetic variance for phenotypic plasticity. Similarly, the effects of genetics on community and ecosystem phenotypes probably decline with increasing biotic and abiotic environmental variations (Garant et al. 2008; Pelletier et al. 2008; Ezard et al. 2009; Porlier et al. 2009). The theoretical framework for quantifying the heritability of arthropod communities of individual tree genotypes, mathematically defined in Shuster et al. (2006), argues that when the environmental effects of associated species are large the effects of plant genetic variation in structuring communities will be small. Because environmental variation can have a substantial role in the coevolutionary process and in feedbacks, it is critical that we understand the strength of the effects of plant genetic variation across environmental gradients.
(c) Terrestrial and aquatic
Our results suggest that the effects of terrestrial plant genetic effects on both terrestrial and aquatic communities are similar. Given the recent genes-to-ecosystems research in aquatic systems that demonstrates remarkable effects of coevolution among fishes on associated communities and nutrient cycling (Palkovacs et al. 2009), these results suggest that links between forest and aquatic habitats could be stronger than previously appreciated (LeRoy et al. 2006, 2007). This review highlights an important research area warranting more attention.
(d) Odds and ends
Specific to the meta-analysis, only a few studies examined the effects of introgression or genotypic diversity on vertebrates (but see Bailey et al. 2004; Hughes & Stachowicz 2004). Owing to this disparity, these data were left out of the analysis of ‘organism type’, but were used for all other tests. More work needs to be conducted on the effects of introgression and genotypic diversity on vertebrate foraging, as the evidence suggests that the foraging by vertebrates can affect fitness and survival of plants and change plant population genetic structure (Bailey et al. 2004, 2007; Whitham et al. 2006). Determining how genotypic diversity may feed back to affect patterns of foraging may provide some novel insights into the long-term temporal dynamics of plant tolerance and resistance to herbivory. While there is substantial work on leaf litter decomposition and carbon storage, there appears to be no research on the effects of plant genotypic diversity on soil processes including the nitrogen or phosphorus cycle.
5. Conclusion
Our results indicate that the effects of plant genetic factors are moderate overall. Relative to the background average effect size in ecology of Pearson's r=0.19 (Møller & Jennions 2002), our study suggests that plant genetic factors may explain up to two times as much variation across the individual, community and ecosystem levels (r=0.2–0.39). In addition, the effects of plant genetic factors can be strong, suggesting that specific organisms and processes respond more to plant genetic factors than others. Having shown that community and ecosystem phenotypes can be broadly detected, and that they are often heritable (e.g. Bailey et al. 2006; Shuster et al. 2006; Schweitzer et al. 2008a; Whitham et al. 2008), it becomes important to determine under what conditions these phenotypes might feed back to affect the fitness of the individual plant genotype (Whitham et al. 2006; Schweitzer et al. 2008a). If they do feed back to affect the fitness of the individual plant, then it becomes especially important to (i) study ecology and evolution within a community and ecosystem context, (ii) understand the specific targets of selection (Johnson et al. 2009), and (iii) quantify the geographical variation in the strength and direction of the feed back to determine whether such selection results in a geographical mosaic of community structure and ecosystem processes. Our meta-analysis suggests that a community and ecosystem genetics approach is broadly applicable in diverse systems. We suspect that the consistency of our findings is largely due to the fact that all species have evolved in a community context of many interacting species and their abiotic environments.
Acknowledgments
We would like to thank the Centre for Population Biology at Imperial College, Silwood Park for supporting the Eco–Evo working group. We would like to thank Fanie Pelletier, Andrew Hendry and Dany Garant for organizing the meeting. In particular, we would like to thank Marc Johnson, Andrew Hendry and one anonymous reviewer for their helpful comments that significantly improved the manuscript. We thank the Ogden Nature Center and the Utah Department of Natural Resources for supporting our common garden facilities and the Bureau of Reclamation for implementing some of these ideas in current restoration efforts. Our research was supported by National Science Foundation DEB-0743437, DEB-0344019 and DEB-0425908 grants.
Footnotes
One contribution of 14 to a Theme Issue ‘Eco-evolutionary dynamics’.
Supplementary Material
Meta data
References
- Adams D.C., Gurevitch J., Rosenberg M.S. Resampling tests for meta-analysis of ecological data. Ecology. 1997;78:1277–1283. doi:10.2307/2265879 [Google Scholar]
- Bailey J.K., Schweitzer J.A., Rehill B.J., Lindroth R.L., Martinsen G.D., Whitham T.G. Beavers as molecular geneticists: a genetic basis to the foraging of an ecosystem engineer. Ecology. 2004;85:603–608. doi:10.1890/03-3049 [Google Scholar]
- Bailey J.K., Wooley S.C., Lindroth R.L., Whitham T.G. Importance of species interactions to community heritability: a genetic basis to trophic-level interactions. Ecol. Lett. 2006;9:78–85. doi: 10.1111/j.1461-0248.2005.00844.x. doi:10.1111/j.1461-0248.2005.00844.x [DOI] [PubMed] [Google Scholar]
- Bailey J.K., Irschick D.J., Schweitzer J.A., Rehill B.J., Lindroth R.L., Whitham T.G. Selective herbivory by elk results in rapid shifts in the chemical composition of aspen forests. Biol. Invasions. 2007;9:715–722. doi:10.1007/s10530-006-9071-z [Google Scholar]
- Bangert R.K., Allan G.J., Turek R.J., Wimp G.M., Meneses N., Martinsen G.D., Keim P., Whitham T.G. From genes to geography: a genetic similarity rule for arthropod community structure at multiple geographic scales. Mol. Ecol. 2006a;15:4215–4228. doi: 10.1111/j.1365-294X.2006.03092.x. doi:10.1111/j.1365-294X.2006.03092.x [DOI] [PubMed] [Google Scholar]
- Bangert R.K., et al. A genetic similarity rule determines arthropod community structure. Mol. Ecol. 2006b;15:1379–1391. doi: 10.1111/j.1365-294X.2005.02749.x. doi:10.1111/j.1365-294X.2005.02749.x [DOI] [PubMed] [Google Scholar]
- Bangert R.K., Lonsdorf E.V., Wimp G.M., Shuster S.M., Fischer D.G., Schweitzer J.A., Allan G.J., Bailey J.K., Whitham T.G. Genetic structure of a foundation species: scaling community phenotypes from the individual to the region. Heredity. 2008;100:121–131. doi: 10.1038/sj.hdy.6800914. doi:10.1038/sj.hdy.6800914 [DOI] [PubMed] [Google Scholar]
- Bradley K.L., Pregitzer K.S. Ecosystem assembly and terrestrial carbon balance under elevated CO2. Trends Ecol. Evol. 2007;22:538–547. doi: 10.1016/j.tree.2007.08.005. doi:10.1016/j.tree.2007.08.005 [DOI] [PubMed] [Google Scholar]
- Conner J.K., Hartl D.L. Sinauer; Sunderland, MA: 2004. A primer of ecological genetics. [Google Scholar]
- Crutsinger G.M., Collins M.D., Fordyce J.A., Gompert Z., Nice C.C., Sanders N.J. Plant genotypic diversity predicts community structure and governs an ecosystem process. Science. 2006;313:966–968. doi: 10.1126/science.1128326. doi:10.1126/science.1128326 [DOI] [PubMed] [Google Scholar]
- Eckenwalder J.E. Natural intersectional hybridization between North American species of Populus (Salicaceae) in sections Aigeiros and Tacamahaca. II. Taxonomy. Can. J. Bot. 1984;62:325–335. doi:10.1139/b84-051 [Google Scholar]
- Ellison A.M., et al. Loss of foundation species: consequences for the structure and dynamics of forested ecosystems. Front. Ecol. Environ. 2005;3:479–486. doi:10.1890/1540-9295(2005)003[0479:LOFSCF]2.0.CO;2 [Google Scholar]
- Ezard T.H.G., Côté S.D., Pelletier F. Eco-evolutionary dynamics: disentangling phenotypic, environmental and population fluctuations. Phil. Trans. R. Soc. B. 2009;364:1491–1498. doi: 10.1098/rstb.2009.0006. doi:10.1098/rstb.2009.0006 [DOI] [PMC free article] [PubMed] [Google Scholar]
- Fritz R.S. Resistance of hybrid plants to herbivores: genes, environment, or both? Ecology. 1999;80:382–391. doi:10.2307/176619 [Google Scholar]
- Fussmann G.G., Ellner S.P., Hairston N.G., Jr, Jones L.E., Shertzer K.W., Yoshida T. Ecological and evolutionary dynamics of experimental plankton communities. Adv. Ecol. 2005;37:221–243. doi:10.1016/S0065-2504(04)37007-8 [Google Scholar]
- Garant D., Hadfield J.D., Kruuk L.E.B., Sheldon B.C. Stability of genetic variance and covariance for reproductive characters in the face of climate change in a wild bird population. Mol. Ecol. 2008;17:179–188. doi: 10.1111/j.1365-294X.2007.03436.x. doi:10.1111/j.1365-294X.2007.03436.x [DOI] [PubMed] [Google Scholar]
- Gurevitch, J. & Hedges, L. V. 2001 Meta-analysis: combining the results of independent experiments. In Design and analysis of ecological experiments (eds S. M. Scheiner & J. Gurevitch), pp. 347–369, 2nd edn. Oxford, UK: Oxford University Press.
- Hairston N.G., Jr, Ellner S.P., Geber M.A., Yoshida T., Fox J.A. Rapid evolution and the convergence of ecological and evolutionary time. Ecol. Lett. 2005;8:1114–1127. doi:10.1111/j.1461-0248.2005.00812.x [Google Scholar]
- Hughes A.R., Stachowicz J.J. Genetic diversity enhances the resistance of a seagrass ecosystem to disturbance. Proc. Natl Acad. Sci. USA. 2004;101:8998–9002. doi: 10.1073/pnas.0402642101. doi:10.1073/pnas.0402642101 [DOI] [PMC free article] [PubMed] [Google Scholar]
- Hughes A.R., Inouye B.D., Johnson M.T.J., Underwood N., Vellend M. Ecological consequences of genetic diversity. Ecol. Lett. 2008;11:609–623. doi: 10.1111/j.1461-0248.2008.01179.x. doi:10.1111/j.1461-0248.2008.01179.x [DOI] [PubMed] [Google Scholar]
- Johnson M.T.J., Agrawal A. Plant genotype and environment interact to shape a diverse arthropod community on evening primrose (Oenothera biennis) Ecology. 2005;86:874–885. doi:10.1890/04-1068 [Google Scholar]
- Johnson M.T.J., Stinchcombe J.R. An emerging synthesis between community ecology and evolutionary biology. Trends Ecol. Evol. 2007;22:250–257. doi: 10.1016/j.tree.2007.01.014. doi:10.1016/j.tree.2007.01.014 [DOI] [PubMed] [Google Scholar]
- Johnson M.T.J., Lajeunesse M.J., Agrawal A.A. Additive and interactive effects of plant genotypic diversity on arthropod communities and plant fitness. Ecol. Lett. 2006;9:24–34. doi: 10.1111/j.1461-0248.2005.00833.x. doi:10.1111/j.1461-0248.2005.00833.x [DOI] [PubMed] [Google Scholar]
- Johnson M.T.J., Vellend M., Stinchcombe J.R. Evolution in plant populations as a driver of ecological changes in arthropod communities. Phil. Trans. R. Soc. B. 2009;364:1593–1605. doi: 10.1098/rstb.2008.0334. doi:10.1098/rstb.2008.0334 [DOI] [PMC free article] [PubMed] [Google Scholar]
- Jones L.E., Becks L., Ellner S.P., Hairston N.G., Jr, Yoshida T., Fussmann G.F. Rapid contemporary evolution and clonal food web dynamics. Phil. Trans. R. Soc. B. 2009;364:1579–1591. doi: 10.1098/rstb.2009.0004. doi:10.1098/rstb.2009.0004 [DOI] [PMC free article] [PubMed] [Google Scholar]
- Keim P., Paige K.N., Whitham T.G., Lark K.G. Genetic analysis of an interspecific hybrid swarm of Populus: occurrence of unidirectional introgression. Genetics. 1989;123:557–565. doi: 10.1093/genetics/123.3.557. [DOI] [PMC free article] [PubMed] [Google Scholar]
- Lawton J.H. Are there general laws in ecology? Oikos. 1999;84:177–192. doi:10.2307/3546712 [Google Scholar]
- LeRoy C.J., Whitham T.G., Keim P., Marks J.C. Plant genes link forests and streams. Ecology. 2006;87:255–261. doi: 10.1890/05-0159. doi:10.1890/05-0159 [DOI] [PubMed] [Google Scholar]
- LeRoy C.J., Whitham T.G., Wooley S.C., Marks J.C. Within-species variation in foliar chemistry influences leaf-litter decomposition in a Utah river. J. North Am. Benthol. Soc. 2007;26:426–438. doi:10.1899/06-113.1 [Google Scholar]
- Light R.J., Pillemer D.B. Harvard University Press; Cambridge, MA: 1984. Summing up: the science of reviewing research. [Google Scholar]
- Martinsen G.D., Whitham T.G., Turek R., Keim P. Hybrid populations selectively filter gene introgression between species. Evolution. 2001;55:1325–1335. doi: 10.1111/j.0014-3820.2001.tb00655.x. doi:10.1554/0014-3820(2001)055[1325:HPSFGI]2.0.Co;2 [DOI] [PubMed] [Google Scholar]
- Møller A.P., Jennions M.D. How much variation can be explained by ecologists and evolutionary biologists? Oecologia. 2002;132:492–500. doi: 10.1007/s00442-002-0952-2. doi:10.1007/s00442-002-0952-2 [DOI] [PubMed] [Google Scholar]
- Palkovacs E.P., Post D.M. Eco-evolutionary interactions between predators and prey: can predator-induced changes to prey communities feedback to shape predator foraging traits? Evol. Ecol. Res. 2008;10:699–720. [Google Scholar]
- Palkovacs, E. P. & Post, D. M. In press. Experimental evidence that phenotypic divergence in predators drives community divergence in prey. Ecology [DOI] [PubMed]
- Palkovacs E.P., Marshall M.C., Lamphere B.A., Lynch B.R., Weese D.J., Fraser D.F., Reznick D.N., Pringle C.M., Kinnison M.T. Experimental evaluation of evolution and coevolution as agents of ecosystem change in Trinidadian streams. Phil. Trans. R. Soc. B. 2009;364:1617–1628. doi: 10.1098/rstb.2009.0016. doi:10.1098/rstb.2009.0016 [DOI] [PMC free article] [PubMed] [Google Scholar]
- Palmer A.R. Detecting publication bias in meta-analysis: a case study of fluctuating asymmetry and sexual selection. Am. Nat. 1999;154:220–233. doi: 10.1086/303223. doi:10.1086/303223 [DOI] [PubMed] [Google Scholar]
- Pelletier, F., Réale, D., Garant, D., Coltman, W. & Festa-Bianchet, M. In press. Selection on heritable seasonal plasticity of body mass. Evolution [DOI] [PubMed]
- Porlier M., Bélisle M., Garant D. Non-random distribution of individual genetic diversity along an environmental gradient. Phil. Trans. R. Soc. B. 2009;364:1543–1554. doi: 10.1098/rstb.2009.0010. doi:10.1098/rstb.2009.0010 [DOI] [PMC free article] [PubMed] [Google Scholar]
- Post D.M., Palkovacs E.P., Schielke E.G., Dodson S.I. Intraspecific phenotypic variation in a predator affects zooplankton community structure and cascading trophic interactions. Ecology. 2008;89:2019–2032. doi: 10.1890/07-1216.1. doi:10.1890/07-1216.1 [DOI] [PubMed] [Google Scholar]
- Rosenberg M.S., Adams D.C., Gurevitch J. Sinauer; Sunderland, MA: 2000. MetaWin: statistical software for meta-analysis. [Google Scholar]
- Schweitzer J.A., Bailey J.K., Hart S.C., Woolbright S.A., Whitham T.G. A genetic component to ecosystem processes: the role of genetic variation, and condensed tannins on soil nitrogen dynamics. Ecol. Lett. 2004;7:127–134. doi:10.1111/j.1461-0248.2003.00562.x [Google Scholar]
- Schweitzer J.A., Bailey J.K., Hart S.C., Whitham T.G. Non-additive effects of mixing cottonwood genotypes on litter decomposition and nutrient dynamics. Ecology. 2005;86:2834–2840. doi:10.1890/04-1955 [Google Scholar]
- Schweitzer J.A., Bailey J.K., Fischer D.G., LeRoy C.J., Lonsdorf E.V., Whitham T.G., Hart S.C. Plant–soil–microorganism interactions: heritable relationship between plant genotype and associated soil microorganisms. Ecology. 2008a;89:773–781. doi: 10.1890/07-0337.1. doi:10.1890/07-0337.1 [DOI] [PubMed] [Google Scholar]
- Schweitzer J.A., et al. From genes to ecosystems: the genetic basis of condensed tannins and their role in nutrient regulation in a Populus model system. Ecosystems. 2008b;11:1005–1020. doi:10.1007/s10021-008-9173-9 [Google Scholar]
- Shuster S.M., Lonsdorf E.V., Wimp G.M., Bailey J.K., Whitham T.G. Community heritability measures the evolutionary consequences of indirect genetic effects on community structure. Evolution. 2006;60:991–1003. doi:10.1554/05-121.1 [PubMed] [Google Scholar]
- Strauss S.Y. Levels of herbivory and parasitism in host hybrid zones. Trends Ecol. Evol. 1994;9:209–214. doi: 10.1016/0169-5347(94)90245-3. doi:10.1016/0169-5347(94)90245-3 [DOI] [PubMed] [Google Scholar]
- Thompson J.N. University of Chicago Press; Chicago, IL: 2005. The geographic mosaic theory of coevolution. [Google Scholar]
- Wade M.J. The co-evolutionary genetics of ecological communities. Nat. Rev. Genet. 2007;8:185–195. doi: 10.1038/nrg2031. doi:10.1038/nrg2031 [DOI] [PubMed] [Google Scholar]
- Whitham T.G., Martinsen G.D., Floate K.D., Dungey H.S., Potts B.M., Keim P. Plant hybrid zones affect biodiversity: tools for a genetic-based understanding of community structure. Ecology. 1999;80:416–428. doi:10.2307/176622 [Google Scholar]
- Whitham T.G., et al. Community and ecosystem genetics: a consequence of the extended phenotype. Ecology. 2003;84:559–573. doi:10.1890/0012-9658(2003)084[0559:CAEGAC]2.0.CO;2 [Google Scholar]
- Whitham T.G., et al. A framework for community and ecosystem genetics: from genes to ecosystems. Nat. Rev. Genet. 2006;7:510–523. doi: 10.1038/nrg1877. doi:10.1038/nrg1877 [DOI] [PubMed] [Google Scholar]
- Whitham T.G., DiFazio S.P., Schweitzer J.A., Shuster S.M., Allen G.J., Bailey J.K., Woolbright S.A. Extending genomics to natural communities and ecosystems. Science. 2008;320:492–495. doi: 10.1126/science.1153918. doi:10.1126/science.1153918 [DOI] [PubMed] [Google Scholar]
- Wright S. The method of path coefficients. Ann. Math. Stat. 1934;5:161–215. doi:10.1214/aoms/1177732676 [Google Scholar]
- Yoshida T., Jones L.E., Ellner S.P., Hairston N.G., Jr Rapid evolution drives ecological dynamics in a predator–prey system. Nature. 2003;424:303–306. doi: 10.1038/nature01767. doi:10.1038/nature01767 [DOI] [PubMed] [Google Scholar]
Associated Data
This section collects any data citations, data availability statements, or supplementary materials included in this article.
Supplementary Materials
Meta data