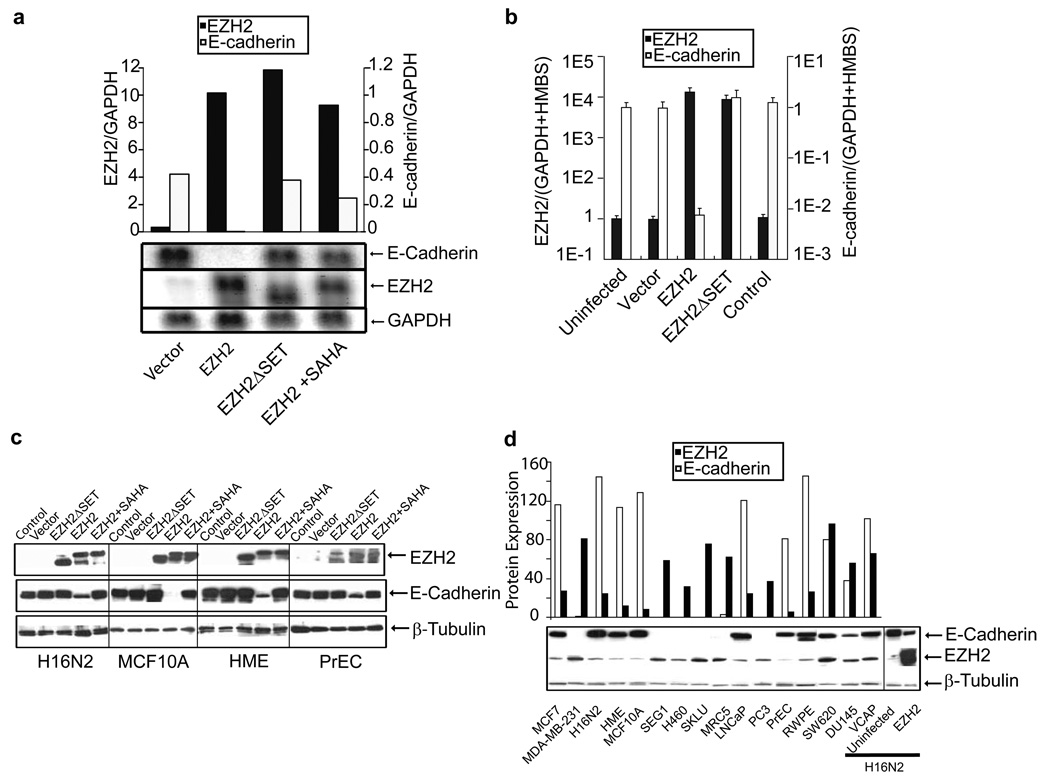
Figure 2. EZH2 mediates repression of E-cadherin transcript and protein.
(a) Northern blot analyses of the E-cadherin gene in EZH2 over expressing cells. Northern blot analysis was carried out using the RNA from H16N2 cells infected with EZH2 and control adenovirus as well as EZH2 infected cells treated with 500nM SAHA for 48 hours. EZH2, E-cadherin and GAPDH probes were labeled with p32dCTP and hybridized to the blots. Note that uninfected H16N2 cells do not express EZH2, while E-cadherin is expressed at high levels in these cells. (b) Quantitative SYBR green RT-PCR of EZH2 transcript in cell lines infected with EZH2 and control adenoviruses. RT-PCR on each sample was performed in duplicate, and a ratio was calculated relative to the housekeeping genes GAPDH and hydroxymethylbilane synthase (HMBS). (c) Immunoblot analysis of EZH2 and E-cadherin in breast cell lines H16N2, MCF10A, HME and primary prostate cell PrEC infected with EZH2, EZH2ΔSET mutant, and control adenovirus infected cells as well as EZH2 infected cells treated with 500nM SAHA for 48 hours. β-tubulin was included as a loading control. Experiments were performed three times and a representative immunoblot is shown. (d) Immunoblot analysis of EZH2 and E-cadherin in a panel of breast and prostate cell lines. The cultured lines include both invasive and non-invasive cells. β-tubulin was included as a loading control. Semi-quantitation of EZH2 and E-cadherin in multiple cell lines is represented in a graphical format (top panel).

