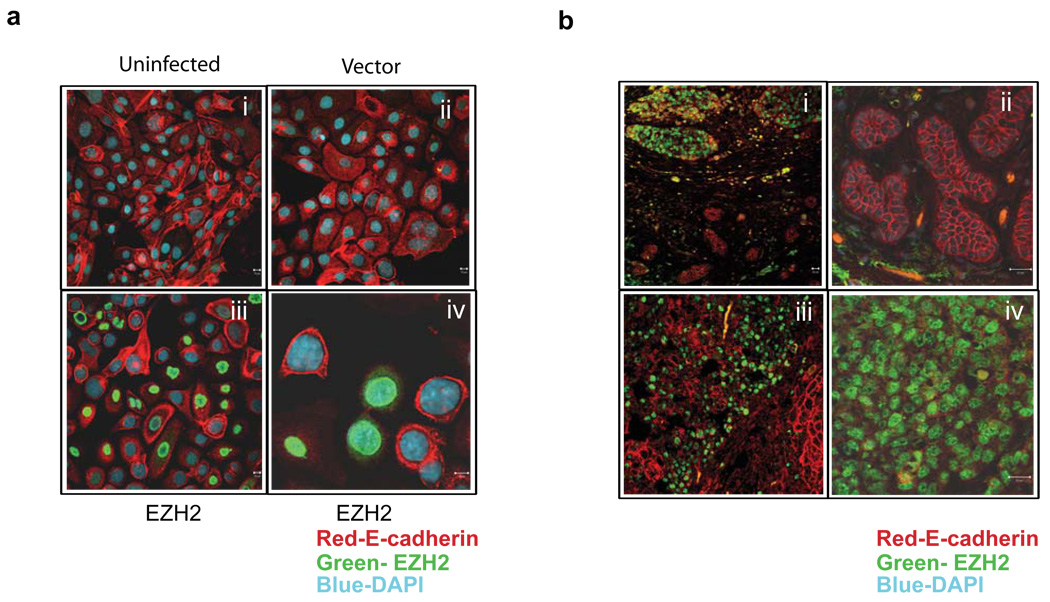
Figure 3. Co-Immunostaining indicates an inverse correlation between EZH2 and E-cadherin in cell lines and tumors.
(a) Immunostaining of the breast cell line H16N2 infected with EZH2 and control adenovirus (i, ii, iii and iv). Green staining represents EZH2 protein, red staining represents E-cadherin, and blue represents nuclear staining with DAPI. Lower right panel (iv) shows a higher magnification image. (b) Association between EZH2 and E-cadherin protein levels in human breast tumors by immunofluorescence. Upper left panel (i) shows invasive carcinoma of the breast with high EZH2 protein expression in the nuclei (green) and low E-cadherin expression (red), evidenced by a decrease in the membrane staining. A normal lobule is present in the lower part of the figure. Top right panel (ii) shows the higher magnification of the normal lobule shown with crisp membrane staining for E-cadherin. EZH2 staining is absent in this region. The lower left panel (iii) shows invasive carcinoma with foci of high EZH2 expression. The lower right panel (iv) shows higher magnification of a focus of invasive carcinoma with high EZH2 expression and nearly absent E-cadherin staining.

