

Abstract
Study Objectives:
Adherence to continuous positive airway pressure (CPAP) therapy for obstructive sleep apnea is poor. Risk factors for nonadherence are not well understood but may reflect individual or neighborhood socioeconomic factors. We sought to determine the association of socioeconomic status and initial CPAP adherence.
Design:
Retrospective cohort study, 2005 to 2006.
Setting:
Philadelphia VA Medical Center.
Participants:
Of 330 consecutive veterans who met study criteria for initiation of CPAP therapy for newly diagnosed sleep apnea, 266 had complete data for study inclusion.
Interventions:
N/A.
Measurements:
Through a multivariable logistic regression model, using an outcome of objectively measured CPAP use ≥ 4 h daily during the first week of treatment, we tested whether patients from higher socioeconomic neighborhoods had higher CPAP adherence. We measured neighborhood socioeconomic status with an index derived from the 2000 U.S. Census at the block group-level composed of median household income, male and female employment, adult high school completion, married households, and minority composition.
Results:
CPAP adherence ≥ 4 h occurred on 48.9% of 1,805 patient-days observed for the 266 subjects. After adjustment for individual sociodemographic characteristics and medical comorbidity, the probability of daily CPAP use ≥ 4 h ranged from 34.1% (95% CI, 26.4–42.7) for subjects from a low socioeconomic neighborhood (5th percentile) to 62.3% (95% CI, 53.8–70.1) for subjects from a high (95th percentile) neighborhood.
Conclusions:
In a retrospective cohort of veterans, initial CPAP adherence was closely associated with higher neighborhood socioeconomic factors. Future investigation should target specific impediments to adherence in the home and neighborhood environment.
Citation:
Platt AB; Field SH; Asch DA; Chen Z; Gupta R; Roche DF; Gurubhagavatula I; Christie JD; Kuna ST. Neighborhood of residence is associated with daily adherence to CPAP therapy. SLEEP 2009;32(6):799-806.
Keywords: Obstructive sleep apnea, continuous positive airway pressure, adherence, socioeconomic status
OBSTRUCTIVE SLEEP APNEA (OSA) IS A HIGHLY PREVALENT CONDITION AFFECTING 2% TO 7% OF ADULTS.1–3 THE PRIMARY TREATMENT FOR OSA, continuous positive airway pressure (CPAP) delivered by mask,4,5 reduces daytime sleepiness,6 improves quality of life,7 lowers the risk of driving-related accidents,8 and is associated with reduced cardiovascular morbidity.9–12 Yet, many patients do not adhere to CPAP. Only one-half of subjects use the treatment ≥ 4 h/day, a level frequently cited in the literature as a threshold for adequate use.13–17 Clinical factors have not been highly predictive of CPAP adherence,13,16 and although recent work has suggested that psychological attitudes may provide some important insights into patients' willingness to adhere to CPAP,18–20 nonadherence to CPAP overall remains poorly understood.13,16,17,19–24
Low socioeconomic status is a risk factor for poor health outcomes, including mortality,25,26 but its impact on CPAP adherence has not been well explored. Studies in this area have reported associations between individual race and CPAP adherence with limited adjustment for patients' socioeconomic status.16,27,28 Our aim was to determine the impact of socioeconomic status on initial, daily adherence to CPAP therapy. To do so, we examined both individual-level clinical and demographic characteristics as well as neighborhood-level measures of socioeconomic status of the communities in which patients reside.
METHODS
Design and Study Population
We performed a retrospective cohort study of consecutive veterans ≥ 18 years who were diagnosed with OSA (apnea hypopnea index [AHI] ≥ 5 events/h) and newly initiated on CPAP therapy at the Philadelphia VA Medical Center (PVAMC) from January 1, 2005, to December 31, 2006. We excluded patients who had previously used CPAP treatment or resided outside the referral area of Pennsylvania, New Jersey, and Delaware. The institutional review board of the Philadelphia VA Medical Center approved the study and ethical standards were observed during the investigation.
Covariates
We retrieved individual data on age, sex, racial classification, marital status, employment status, medical comorbidities by the Charlson Index29 at the time of CPAP initiation. The Charlson Index is commonly used in outcome studies as a measure of adjustment for patient medical comorbidity.30,31 From clinical notes and sleep study results, we confirmed the diagnosis of OSA, the body mass index (BMI), the Epworth Sleepiness Scale (ESS) score before initiation of CPAP therapy,32,33 AHI on the diagnostic sleep study, and the type of diagnostic sleep study used to make the diagnosis of OSA (in-laboratory, attended polysomnogram, or an in-home, unattended sleep study).
Neighborhood of Residence Socioeconomic Index
We assessed the socioeconomic status of the neighborhoods in which veterans reside using data from the 2000 U.S. Census, at the level of a census block group, consisting of median household income, percent male and female employment, percentage of adults ≥ 25 years of age who graduated from high school, prevalence of married households, and racial composition (measured as percent nonwhite). We obtained the census block group-level data from 2000 census data (Geocode DVD Version 2.1, Geolytics, East Brunswick, NJ) and matched the data to the 9-digit zip code for each veteran in the referral area of Pennsylvania, New Jersey and Delaware using commercially available, geographic mapping software (AccuZIP6 4.0, Atascadero, CA). The census block group has an optimum size of 1,500 persons, generally ranging from 600 to 3,000 persons. We chose the census block group as the unit of analysis of neighborhood socioeconomic status because it is the smallest geographic entity for which detailed income and employment data are available and because this subdivision was used in a report that linked neighborhood socioeconomic status to cardiovascular morbidity.34
Because of the high correlation among census variables, we performed principal component analysis using SAS (SAS, Cary, NC) to develop an index to designate overall neighborhood socioeconomic status. A single factor, with a high Eigenvalue of 4.0, explained 67% of the information provided by the 6 component census variables. The index was then standardized for the study population (mean [SD] value of 0.0 [1.0]) and modeled as a linear, continuous variable.
Sleep Studies
Veterans in the cohort were diagnosed with OSA in 1 of 2 ways: an in-laboratory, attended polysomnogram, or an in-home, unattended sleep study. The in-laboratory study was performed either as a full-night diagnostic polysomnogram generally followed by a full-night CPAP titration polysomnogram or as a single split-night study. All in-laboratory studies consisted of standard recordings of electroencephalograms (C3A2, O2A1), bilateral electroculograms, electromyograms of the chin and legs, oxygen saturation by finger oximetry, nasal airflow, snoring, respiratory effort, heart rate, body position, and an electrocardiogram. For the in-laboratory studies, data were collected with an experienced technician in attendance using Sandman software (Sandman Diagnostic Systems, Nellcor-Puritan Bennett Inc., Kanata, ON, Canada). For in-home testing, veterans were provided with a type 3 portable monitor (Suzanne Portable Recording System, Nellcor Puritan Bennett, Ontario, Canada; or Embletta, Embla, Broomfield, CO) that recorded nasal airflow, snoring, respiratory effort, body position, oxygen saturation, heart rate. Veterans diagnosed with OSA via an unattended study generally underwent an unattended automatic CPAP titration study (AutoSet Spirit, ResMed, Poway, CA) in the home for ≥ 3 nights. The in-laboratory and in-home diagnostic sleep studies were recorded and scored according to the policies and procedures of the American Academy of Sleep Medicine.35,36
CPAP Initiation
After the diagnostic sleep studies were performed, a board-certified sleep specialist prescribed fixed CPAP to each veteran. The pressure setting was identified from the in-laboratory titration polysomnogram or the 95th percentile pressure recorded on the home automatic CPAP titration study. All veterans received a CPAP unit (RemStar Pro, Respironics, Murrayville, PA) that recorded daily mask-on time, i.e., the time the CPAP circuit was pressurized at the prescribed level, on an electronic data card. The card was collected by a respiratory therapist during a scheduled home visit approximately one week after delivery of the CPAP device, or by the subject's mailing or bringing the card to the Philadelphia VA Medical Center. The first day of CPAP use was defined as the initial day during which any pressurized mask-on time was recorded by the CPAP electronic card monitor after delivery of the CPAP device to the veteran.
Outcome and Statistical Analysis
The primary outcome for all analyses was daily CPAP adherence ≥ 4 h (versus < 4 h), measured daily over the first week of therapy as electronically-recorded mask-on time. We selected a threshold of ≥ 4 h/day because this cut-off is widely used in the literature13–17 and may be followed by physicians as part of the adherence monitoring printouts generated by the current generation of CPAP appliances.
We modeled the dependent variable of daily CPAP adherence as a dichotomous, repeated outcome variable. We used general estimating equations to perform multivariable logistic regression with an exchangeable correlation structure to account for within-subject correlation of daily CPAP use (STATA 9.0; STATA Corporation, College Station, TX).37 As CPAP use on the first night was observed to be shorter than that on subsequent nights, we included a within-patient factor indicating whether the night observed was the first night versus the remaining nights.
In our model, we included a priori individual-level demographic characteristics and the neighborhood of residence socioeconomic index. We then added any clinical exposure variable with a P-value ≤ 0.20 in univariate analysis with the outcome of daily CPAP adherence.38 Finally, we calculated the fitted probability of daily CPAP use ≥ 4 h/day for every unique value of the index, after setting the other covariates in the final model to their respective sample means, to provide a clinically meaningful, graphical presentation of association of socioeconomic status and adherence.
RESULTS
Three hundred thirty patients met study criteria of newly initiating CPAP therapy for a diagnosis of OSA from 2005 to 2006. Of these, 266 (81%) with complete CPAP adherence and census block data were included in the analysis (see Figure 1). The study cohort had a mean (SD) age of 57 (12) years; 249 patients (94%) were male, and 132 (50%) were black. The level of OSA disease severity was high, with a mean (SD) AHI of 42 (29) events/h (Table 1). A comparison of the 266 subjects used in the analysis with the subjects excluded due to missing CPAP adherence (n = 45) or lack of an address match in the tri-state area (n = 19) demonstrated no significant differences in baseline demographic and clinical measures, neighborhood-level census block group variables, or median CPAP use. The 266 subjects were observed over 1,805 patient-days for a mean of 6.8 days (SD = 0.8) per patient. Across all patient days observed, median CPAP use equaled 3.9 hours (interquartile range 0.1–6.2) and CPAP adherence ≥ 4 h/day occurred on 48.9% of patient days observed.
Figure 1.

Philadelphia VA Study Cohort (2005-2006). Legend: Abbreviations: VA, Veterans Affairs; OSA, obstructive sleep apnea; CPAP, continuous positive airway pressure; BIPAP, bilevel positive airway pressure; PA, Pennsylvania; NJ, New Jersey; DE, Delaware.
Table 1.
Baseline Patient Characteristics (n = 266)
| Individual Characteristics | Value |
|---|---|
| Age, mean (SD), years | 56.8 (11.6) |
| Male, % | 93.6 |
| Race,*% | |
| Black | 49.6 |
| White | 41.7 |
| Other | 8.7 |
| Married,†% | 47.0 |
| Employment Status, % | |
| Occupation listed | 44.6 |
| Retired | 9.4 |
| Other‡ | 47.0 |
| Clinical Characteristics | |
| Medical comorbidities | |
| Charlson Index, median, interquartile range | 1 (0-2) |
| Hypertension (ICD-9), % | 77.4 |
| Diabetes mellitus (ICD-9), % | 51.1 |
| Coronary artery disease (ICD-9), % | 30.1 |
| Chronic obstructive lung disease (ICD-9), % | 28.2 |
| Body mass index, mean (SD), kg/m2 | 34.9 (6.6) |
| Epworth Sleepiness Scale, §mean (SD) | 12.4 (5.8) |
| Apnea hypopnea index,∥mean (SD) | 42.4 (28.5) |
| Type of diagnostic sleep study, In-laboratory (vs home, unattended), % | 59.4 |
| Neighborhood Socioeconomic Characteristics | Mean (SD) |
| Neighborhood socioeconomic index,¶mean (SD) | 0.0 (1.0) |
| Median household income, in thousands | $39.0 (18.7) |
| % Female employment | 49.7 (15.0) |
| % Male employment | 58.0 (17.3) |
| % Adults with high school degree | 78.3 (12.0) |
| % Married households | 45.0 (15.0) |
| % Nonwhite | 48.8 (38.8) |
Abbreviations: CI, confidence interval; SD, standard deviation.
Race self-identified (86%), determined by provider notes (8%) or missing (6%). Other race category consists of Pacific Islander, Asian, and Indian American (n = 7) and race classification missing (n = 16).
Non-married patients: separated/divorced (26.3%); never married (21.1%); widowed (5.6%).
Other employment category: unemployed/disabled (10.2%) and no occupation listed (36.8%).
Epworth Sleepiness Scale assessed before treatment. Data missing for 16 subjects.
Apnea hypopnea index, in events per hour, on diagnostic sleep study. Data missing for 2 subjects.
The socioeconomic index is derived from principal component analysis of 2000 U.S Census data on median household income, percent female and male employment, adults with a high school degree, married households, and minority composition of the census block group (“neighborhood”) in which patients reside.
Table 2 presents the crude and Table 3 the adjusted results for the association of individual and neighborhood-level characteristics and initial adherence to CPAP treatment. Each census block group (“neighborhood”) level variable (median household income, percent male and female employment, percent of adults with a high school degree and, inversely, percent nonwhite) was strongly associated with CPAP adherence, indicating that patients residing in neighborhoods with higher socioeconomic status had substantially higher odds of adhering to CPAP treatment. As with each component census-based measure, the composite neighborhood socioeconomic index was closely linked to CPAP adherence. Higher scores on the neighborhood socioeconomic index were associated with substantially higher odds of daily CPAP adherence (adjusted odds ratio [OR] = 1.4 for each standard deviation increase in the standardized index [95% CI, 1.2–1.7, P < 0.001]) (Table 3).
Table 2.
Crude Association of Individual Demographic, Clinical, and Neighborhood-level Characteristics and Initial Adherence to Continuous Positive Airway Pressure ≥ 4 h/day (n = 266)
| Variable | Crude Odds Ratio (95% CI) | P Value |
|---|---|---|
| Individual Demographic Characteristics | ||
| Age, per 10-year increase | 1.1 (0.9–1.2) | 0.39 |
| Race, versus white | ||
| Black | 0.9 (0.6–1.2) | 0.64 |
| Other* | 1.0 (0.5–1.7) | |
| Marital status, married, versus not married | 1.7 (1.2–2.3) | < 0.01 |
| Employment status, versus other† | ||
| Occupation listed | 1.4 (1.0–1.9) | 0.18 |
| Retired | 1.3 (0.7–2.4) | |
| Clinical Characteristics | ||
| Charlson Index, 2 or more, versus ≤ 1 | 0.8 (0.6–1.1) | 0.20 |
| Body mass index (BMI), per SD increase | 1.0 (0.9–1.2) | 0.63 |
| Epworth Sleepiness Scale (ESS),§ per SD increase | 1.0 (0.8–1.2) | 0.99 |
| Apnea hypopnea index (AHI),∥ per SD increase | 1.0 (0.9–1.2) | 0.56 |
| Diagnostic sleep study, unattended, versus in-lab | 1.2 (0.9–1.7) | 0.27 |
| First day CPAP used, versus subsequent days | 0.5 (0.4–0.6) | < 0.001 |
| Neighborhood Socioeconomic Characteristics | ||
| Neighborhood socioeconomic index,¶ per SD increase | 1.4 (1.2–1.6) | < 0.001 |
| Median household income, per SD increase | 1.4 (1.2–1.6) | < 0.001 |
| % Female employment, per SD increase | 1.4 (1.1–1.6) | < 0.001 |
| % Male employment, per SD increase | 1.3 (1.1–1.5) | < 0.01 |
| % Adults with high school degree, per SD increase | 1.4 (1.2–1.6) | < 0.001 |
| % Married, per SD increase | 1.3 (1.1–1.6) | < 0.01 |
| % Nonwhite, per SD increase | 0.8 (0.7–1.0) | 0.02 |
Abbreviations: CI, confidence interval; SD, standard deviation; BMI, body mass index; ESS, Epworth sleepiness scale; AHI, apnea hypopnea index.
Other race category: Pacific Islander, Asian, and Indian American (n = 7); race classification missing (n = 16).
Other employment category: unemployed/disabled (10.2%) and no occupation listed (36.8%).
Eworth sleepiness scale assessed before treatment. Data missing for 16 subjects.
Apnea hypopnea index, in events per hour, from diagnostic sleep study. Data missing for 2 subjects.
The socioeconomic index is derived from principal component analysis of 2000 U.S. Census data on median household income, percent female and male employment, adults with a high school degree, married households, and minority composition of the census block group (“neighborhood”) in which patients reside.
Table 3.
Adjusted Association of Individual and Neighborhood-level Characteristics and Initial Adherence to Continuous Positive Airway Pressure ≥ 4 h/day (n = 266)
| Risk factor | Adjusted Odds Ratio* (95% CI) | P Value |
|---|---|---|
| Age, per 10-year increase | 1.1 (0.9–1.3) | 0.21 |
| Race, vs. white | ||
| Black | 1.2 (0.8–1.8) | 0.66 |
| Other† | 1.1 (0.6–2.1) | |
| Married, vs. not married | 1.4 (1.0–1.9) | 0.08 |
| Employment status, vs. other‡ | ||
| Occupation listed | 1.4 (1.0–2.0) | 0.19 |
| Retired | 1.1 (0.6–2.0) | |
| Charlson Index, 2 or more, versus ≤ 1 | 0.9 (0.6–1.3) | 0.52 |
| Neighborhood socioeconomic index,§ per SD increase | 1.4 (1.2–1.7) | < 0.001 |
Abbreviations: CI, confidence interval; SD, standard deviation; CPAP, continuous positive airway pressure.
Adjusted for all the variables listed above and for CPAP use on the first day versus subsequent days in the first week of treatment.
Other race category: Pacific Islander, Asian, and Indian American (7) and race classification missing (16).
Other employment category: unemployed/disabled (10.2%); no occupation listed (36.8%).
The socioeconomic index is derived from principal component analysis of 2000 U.S. Census data on median household income, percent female and male employment, adults with a high school degree, married households, and minority composition of the census block group (“neighborhood”) in which patients reside.
Figure 2 illustrates the association of neighborhood socioeconomic index and the expected probability of daily CPAP use ≥ 4 h/day after adjustment for individual-level factors presented in Table 3. The adjusted probability of daily CPAP use ≥ 4 h/day ranged from 34.1% (CI, 26.4–42.7) for subjects from a low (5th percentile) socioeconomic neighborhood, to 62.3% (CI, 53.8–70.1) for subjects from a high (95th percentile) socioeconomic index neighborhood (Table 4).
Figure 2.
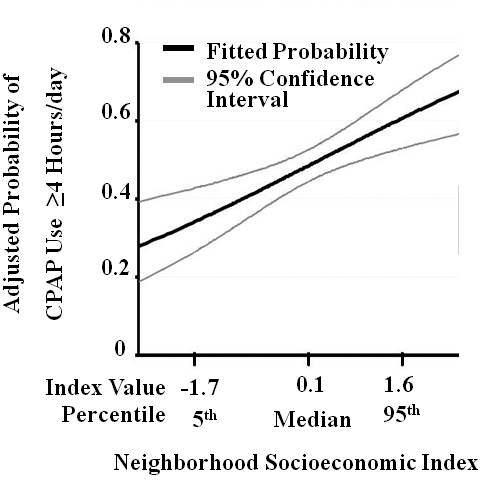
Adjusted Probability of Adherence to Continuous Positive Airway Pressure (CPAP), by Neighborhood Socioeconomic Index (n = 266). Legend: Higher probability of daily CPAP adherence ≥ 4 h in the first week of therapy is associated with a neighborhood socioeconomic index derived from 2000 U.S. Census data at the census block group (“neighborhood”) in which patients reside. The index is standardized for the study population (mean [SD] 0.0 [1.0]). The fitted probability for daily CPAP adherence is adjusted for individual age, race, employment status, marital status, the Charlson medical comorbidity index and CPAP use on the first day versus subsequent days. Abbreviations: CPAP, continuous positive airway pressure; SD, standard deviation.
Table 4.
Comparison of Crude and Adjusted Probabilities of Initial Daily CPAP Adherence ≥ 4 h/day, by Neighborhood Socioeconomic Index
| Expected Probability of CPAP Use ≥ 4 Hours per Day, First Week of Treatment |
|||
|---|---|---|---|
| Neighborhood Socioeconomic | Crude association (n = 266) | Adjusted for individual demographics & medical comorbidity† (n = 266) | Adjusted for individual demographics, medical comorbidity, and clinical sleep variables‡ (n = 248 |
| Index Percentile* | % Probability (95% CI) | % Probability (95% CI) | % Probability (95% CI) |
| 5th | 34.9 (28.1–42.4) | 34.1 (26.4–42.7) | 33.7 (25.8–42.8) |
| Median | 49.4 (45.4–53.4) | 49.4 (45.3–53.5) | 49.1 (44.9–53.4) |
| 95th | 61.7 (41.3–68.5) | 62.3 (53.8–70.1) | 62.2 (53.5–70.2) |
Abbreviations: CPAP, continuous positive airway pressure; CI, confidence interval.
The socioeconomic index is derived from principal component analysis of 2000 U.S. Census data on median household income, percent female and male employment, adults with a high school degree, married households, and minority composition of the census block group (“neighborhood”) in which patients reside.
Adjusted for all variables in the final model (Table 3) including age, individual race, marital status, employment status, Charlson Index of medical comorbidity, and first day of CPAP use versus subsequent days.
Adjusted for all variables in final model (Table 3) plus Epworth Sleepiness Scale, body mass index, apnea hypopnea index, and in-lab versus unattended sleep study for diagnosis of obstructive sleep apnea. Sample size equals n = 248 for this analysis due to missing data on Epworth (n = 16) and AHI (n = 2).
Among individual-level factors, patients who were married or employed had somewhat higher odds of daily CPAP use, but this association attenuated toward the null after adjustment (Tables 2 and 3). Individual race was not significantly related to daily CPAP adherence in crude or adjusted analyses. A racially stratified analysis revealed that the association of the socioeconomic status index and CPAP adherence was similar among blacks (OR = 1.6 [CI, 1.2–2.1], P = 0.003) and whites (OR = 1.5 [CI, 1.1–2.1], P = 0.02). A test for the interaction of race and the neighborhood socioeconomic status index was negative.
Of the clinical variables, only the Charlson Index29 was included in the final model. To test for bias in this modeling assumption, we added BMI, Epworth sleepiness scale, AHI, and method of diagnosis to the final adjusted model and found that these factors were not significantly associated with CPAP adherence and did not affect the estimated probabilities of the association of socioeconomic status and CPAP adherence (Table 4). To test for bias in our method of categorizing individual race, we limited our sample only to subjects with individual race categorized as black or white (n = 243) and found a continued strong adjusted association of neighborhood socioeconomic status and daily CPAP use (adjusted OR = 1.6 [CI, 1.3–2.0, P < 0.001]) without substantial change in the other variables in the model. No 2 subjects lived in the same census block group, so we did not need to adjust for geographic clustering. Adjusting for distance the patient traveled to the sleep center, modeled as the log of miles from the veteran's home to the sleep clinic, did not affect the association of neighborhood socioeconomic status and CPAP adherence (adjusted OR = 1.4 [CI, 1.1–1.7, P = 0.007]). There were too few women in the study (6%) to investigate gender-related differences; however female veterans compared to males had similar neighborhood socioeconomic status index values (mean [SD], −0.2 [1.2] versus 0.0 [1.0], P = 0.51) and similar median (IQR) daily CPAP use (3.8 [0-6.2] versus 3.9 [0.1–6.2] hours per day, P = 0.37). We tested for bias relating to variation in the length of observed CPAP follow-up among veterans by excluding the 9% of subjects with < 7 days of observation and found no substantial differences in the estimates. Lastly, as a sensitivity analysis regarding our outcome definition of daily CPAP adherence ≥ 4 h (versus < 4 h), we analyzed our final model using 2 alternate definitions of daily CPAP adherence: ≥ 2 h/day (versus < 2) and, alternatively, ≥ 5 h/day (versus < 5). We found no substantial difference in the results among these three different outcome definitions (results not shown).
DISCUSSION
In this retrospective cohort study of 266 veterans with newly diagnosed OSA initiated on CPAP therapy, adherence to CPAP was associated with a neighborhood-level socioeconomic status index, independent of individual characteristics such as age, race, marital status, employment status and medical comorbidity. As in some prior reports,16,17,21 CPAP adherence was not closely associated with clinical factors of BMI, AHI, and Epworth Sleepiness Scale scores that are pertinent in the detection and diagnosis of OSA. Our results suggest that socioeconomic status is an important influence on CPAP adherence, a critical determinant of the effectiveness of treatment.
Differential rates of follow-up for OSA patients treated in public versus private hospital outpatient settings have been noted previously,39,40 although the influence of socioeconomic status on objectively measured, daily CPAP use has not been evaluated fully. Prior studies have either relied on patient self-report of CPAP adherence or reported an association between race and CPAP adherence without adjustment for socioeconomic factors.16,27,28 In contrast, our study is one of the largest and the most comprehensive to examine socioeconomic risk factors for CPAP adherence using objectively recorded daily mask-on time, and the first to demonstrate differences in daily CPAP use that are associated with the socioeconomic characteristics of patients' neighborhoods.
Our observations are in accordance with prior literature that links individual25,41 and neighborhood34,42,43 level indicators of socioeconomic status to numerous poor health outcomes. A growing body of epidemiological research recognizes the influence of the characteristics of places people reside on health behaviors,44,45 health outcomes,46 disease burden,47 and mortality.48 Such research is receptive to the paradigm that disparities in health outcomes and health behaviors, such as CPAP adherence, can be related to area-level differences as importantly as individual-level differences. In our study the persistence of an independent effect of neighborhood socioeconomic status on CPAP adherence suggests that features of the social environment are not omissible factors.
We cannot demonstrate a causal relationship between lower neighborhood socioeconomic status and poor CPAP adherence, and the mechanism remains unclear. Residual disparities related to lower socioeconomic status may still intrude on adherence behavior even after patients surmount numerous obstacles to adherence such as clinic attendance, sleep study completion, CPAP equipment instruction and delivery, and return of the adherence download card. These residual disparities remain elusive but may be associated with such factors as economic hardship affecting living conditions and sleep patterns (e.g., worsening symptoms of insomnia among persons of lower socioeconomic status);49 the ability to wear CPAP (such as access to electricity); competing threats to personal health, safety or well-being related to the neighborhoods where subjects reside; or differences in how technical knowledge is received and understood by patients or family members at various points of contact with health care providers. These disparities, operating at both the individual or neighborhood level, may be captured by census-derived indices of socioeconomic status and might form a set of competing concerns that could negatively affect subjects' ability to adhere to CPAP therapy or, potentially, other types of medical treatment. Furthermore, to what extent the socioeconomic factors identified here may correlate with psychological attitudes toward CPAP treatment previously evaluated in the literature,18–20 or other factors unmeasured in our study, is an important question for future research.
Limitations
Our study has several limitations. First, we examined a predominantly male, veteran population at a single regional referral center, which may limit generalizability. However, our estimate of the influence of socioeconomic status on CPAP adherence may be a conservative one, as veterans were not charged for visits, sleep studies, or provision of masks and equipment. In contrast, patients living in similar neighborhoods who receive care outside the VA system face wider variations in insurance status, copayments, and other benefits, and thus confront additional barriers in accessing medical care. Second, our study was retrospective and cannot conclusively address causal direction. Third, information on individual-level education and income was not available. Because neighborhood socioeconomic status may serve both as an indicator of the subject's individual socioeconomic status as well as a marker for numerous environmental factors which affect adherence, we cannot more conclusively disentangle the impact of individual versus environmental effects on CPAP adherence. For example, individuals with relatively low education may have greater difficulty understanding the CPAP education materials and instruction provided at the time of treatment initiation; alternatively, these low education individuals may face additional barriers by living in a neighborhood where there are fewer individuals in the immediate environment who can assist them with technical know-how or easy access to information sources such as the internet.
As a fourth limitation, we examined CPAP adherence over the first week of therapy instead of a longer time period, an approach supported by the finding in numerous studies that adherence at one week is highly correlated with subsequent adherence at 1 month, 3 months, and 6 months14,16,50 Truncating our observation period to a 7-day window also avoided bias from the potential differential effect of interventions by sleep center staff on patients found to be nonadherent to CPAP after the first week of monitored therapy. Nonetheless, as a future direction it may be important to examine whether patient responses to educational, technical, or other specific initiatives to improve daily CPAP adherence vary over time by the socioeconomic factors reviewed. Lastly, we recognize that socioeconomic status is dynamic, and patients may move from one stratum to another during the given observation period. Such misclassification of exposure, however, might be expected to attenuate the result rather than show one where none exists.
In summary, we have demonstrated in a veteran cohort an association between high neighborhood socioeconomic status and higher adherence to CPAP, independent of individual demographic and clinical factors. Prospective investigation into how both the home and community environment influence adherence to CPAP therapy may identify targets of intervention to improve use among patients at highest risk for nonadherence. Further research will also be required to determine how such intervention programs could be structured, whether in the form of tailored education, more intensive monitoring or innovative means of follow-up.
DISCLOSURE STATEMENT
This was not an industry supported study. Dr. Kuna has received research support from Respironics. The other authors have indicated no financial conflicts of interest.
ACKNOWLEDGMENTS
We thank Jacqueline Ferguson, CRT, Elaine Dynako, RN, Avery Anderson, RRT, and Susan McCloskey, CRNP for their dedication in monitoring patient adherence. Dr. Platt presented the results from this paper in abstract form on June 9, 2008, at the 22nd Annual Meeting of the Associated Professional Sleep Societies, Baltimore, Maryland.
Funding: Dr. Platt received grant funding from Center for Health Equity Research and Promotion (CHERP), Philadelphia VA Medical Center, Philadelphia, PA and was supported by a training grant from National Institutes of Health (T-32 HL07713-14). The funding sources had no role in the design of the study, data collection, management, analysis and interpretation of the data, or preparation or review of the manuscript. Dr. Platt had full access to all of the data in the study and takes full responsibility for the integrity of the data and the accuracy of the data analysis. Dr. Gurubhagavatula is supported by NIH RO1-OH-009149-01.
REFERENCES
- 1.Young T, Palta M, Dempsey J, Skatrud J, Weber S, Badr S. The occurrence of sleep-disordered breathing among middle-aged adults. N Engl J Med. 1993;328:1230–5. doi: 10.1056/NEJM199304293281704. [DOI] [PubMed] [Google Scholar]
- 2.Young T, Peppard PE, Gottlieb DJ. Epidemiology of obstructive sleep apnea: a population health perspective. Am J Respir Crit Care Med. 2002;165:1217–39. doi: 10.1164/rccm.2109080. [DOI] [PubMed] [Google Scholar]
- 3.Punjabi NM. The epidemiology of adult obstructive sleep apnea. Proceedings of the American Thoracic Society. 2008;5:136–43. doi: 10.1513/pats.200709-155MG. [DOI] [PMC free article] [PubMed] [Google Scholar]
- 4.Gay P, Weaver T, Loube D, Iber C. Evaluation of positive airway pressure treatment for sleep related breathing disorders in adults. Sleep. 2006;29:381–401. doi: 10.1093/sleep/29.3.381. [DOI] [PubMed] [Google Scholar]
- 5.Sullivan CE, Issa FG, Berthon-Jones M, Eves L. Reversal of obstructive sleep apnoea by continuous positive airway pressure applied through the nares. Lancet. 1981;1:862–5. doi: 10.1016/s0140-6736(81)92140-1. [DOI] [PubMed] [Google Scholar]
- 6.Ballester E, Badia JR, Hernandez L, et al. Evidence of the effectiveness of continuous positive airway pressure in the treatment of sleep apnea/hypopnea syndrome. Am J Respir Crit Care Med. 1999;159:495–501. doi: 10.1164/ajrccm.159.2.9804061. [DOI] [PubMed] [Google Scholar]
- 7.Jenkinson C, Davies RJ, Mullins R, Stradling JR. Comparison of therapeutic and subtherapeutic nasal continuous positive airway pressure for obstructive sleep apnoea: a randomised prospective parallel trial. Lancet. 1999;353:2100–5. doi: 10.1016/S0140-6736(98)10532-9. [DOI] [PubMed] [Google Scholar]
- 8.George CF. Reduction in motor vehicle collisions following treatment of sleep apnoea with nasal CPAP. Thorax. 2001;56:508–12. doi: 10.1136/thorax.56.7.508. [DOI] [PMC free article] [PubMed] [Google Scholar]
- 9.Marin JM, Carrizo SJ, Vicente E, Agusti AG. Long-term cardiovascular outcomes in men with obstructive sleep apnoea-hypopnoea with or without treatment with continuous positive airway pressure: an observational study. Lancet. 2005;365:1046–53. doi: 10.1016/S0140-6736(05)71141-7. [DOI] [PubMed] [Google Scholar]
- 10.Young T, Finn L, Peppard PE, et al. Sleep disordered breathing and mortality: eighteen-year follow-up of the Wisconsin sleep cohort. Sleep. 2008;31:1071–8. [PMC free article] [PubMed] [Google Scholar]
- 11.Pack AI, Platt AB, Pien GW. Does untreated obstructive sleep apnea lead to death? A commentary on Young et al. Sleep 2008;31:1071-8 and Marshall et al. Sleep. 2008;31:1067–8. 1079-85. Sleep 2008;31. [PMC free article] [PubMed] [Google Scholar]
- 12.Marshall NS, Wong KK, Liu PY, Cullen SR, Knuiman MW, Grunstein RR. Sleep apnea as an independent risk factor for all-cause mortality: the Busselton Health Study. Sleep. 2008;31:1079–85. [PMC free article] [PubMed] [Google Scholar]
- 13.Kribbs NB, Pack AI, Kline LR, et al. Objective measurement of patterns of nasal CPAP use by patients with obstructive sleep apnea. Am Rev Respir Dis. 1993;147:887–95. doi: 10.1164/ajrccm/147.4.887. [DOI] [PubMed] [Google Scholar]
- 14.Weaver TE, Kribbs NB, Pack AI, et al. Night-to-night variability in CPAP use over the first three months of treatment. Sleep. 1997;20:278–83. doi: 10.1093/sleep/20.4.278. [DOI] [PubMed] [Google Scholar]
- 15.Weaver TE, Maislin G, Dinges DF, et al. Relationship between hours of CPAP use and achieving normal levels of sleepiness and daily functioning. Sleep. 2007;30:711–9. doi: 10.1093/sleep/30.6.711. [DOI] [PMC free article] [PubMed] [Google Scholar]
- 16.Budhiraja R, Parthasarathy S, Drake CL, et al. Early CPAP use identifies subsequent adherence to CPAP therapy. Sleep. 2007;30:320–4. [PubMed] [Google Scholar]
- 17.Richards D, Bartlett DJ, Wong K, Malouff J, Grunstein RR. Increased adherence to CPAP with a group cognitive behavioral treatment intervention: a randomized trial. Sleep. 2007;30:635–40. doi: 10.1093/sleep/30.5.635. [DOI] [PubMed] [Google Scholar]
- 18.Stepnowsky CJ, Jr, Bardwell WA, Moore PJ, Ancoli-Israel S, Dimsdale JE. Psychologic correlates of compliance with continuous positive airway pressure. Sleep. 2002;25:758–62. doi: 10.1093/sleep/25.7.758. [DOI] [PubMed] [Google Scholar]
- 19.Aloia MS, Arnedt JT, Stepnowsky C, Hecht J, Borrelli B. Predicting treatment adherence in obstructive sleep apnea using principles of behavior change. J Clin Sleep Med. 2005;1:346–53. [PubMed] [Google Scholar]
- 20.Weaver TE, Maislin G, Dinges DF, et al. Self-efficacy in sleep apnea: instrument development and patient perceptions of obstructive sleep apnea risk, treatment benefit, and volition to use continuous positive airway pressure. Sleep. 2003;26:727–32. doi: 10.1093/sleep/26.6.727. [DOI] [PubMed] [Google Scholar]
- 21.Hui DS, Choy DK, Li TS, et al. Determinants of continuous positive airway pressure compliance in a group of Chinese patients with obstructive sleep apnea. Chest. 2001;120:170–6. doi: 10.1378/chest.120.1.170. [DOI] [PubMed] [Google Scholar]
- 22.Wild MR, Engleman HM, Douglas NJ, Espie CA. Can psychological factors help us to determine adherence to CPAP? A prospective study. Eur Respir J. 2004;24:461–5. doi: 10.1183/09031936.04.00114603. [DOI] [PubMed] [Google Scholar]
- 23.Wells RD, Freedland KE, Carney RM, Duntley SP, Stepanski EJ. Adherence, reports of benefits, and depression among patients treated with continuous positive airway pressure. Psychosom Med. 2007;69:449–54. doi: 10.1097/psy.0b013e318068b2f7. [DOI] [PubMed] [Google Scholar]
- 24.Chasens ER, Pack AI, Maislin G, Dinges DF, Weaver TE. Claustrophobia and adherence to CPAP treatment. West J Nurs Res. 2005;27:307–21. doi: 10.1177/0193945904273283. [DOI] [PubMed] [Google Scholar]
- 25.Marmot MG, Rose G, Shipley M, Hamilton PJ. Employment grade and coronary heart disease in British civil servants. J Epidemiol Community Health. 1978;32:244–9. doi: 10.1136/jech.32.4.244. [DOI] [PMC free article] [PubMed] [Google Scholar]
- 26.Mackenbach JP, Stirbu I, Roskam AJ, et al. Socioeconomic inequalities in health in 22 European countries. N Engl J Med. 2008;358:2468–81. doi: 10.1056/NEJMsa0707519. [DOI] [PubMed] [Google Scholar]
- 27.Joo MJ, Herdegen JJ. Sleep apnea in an urban public hospital: assessment of severity and treatment adherence. J Clin Sleep Med. 2007;3:285–8. [PMC free article] [PubMed] [Google Scholar]
- 28.Scharf SM, Seiden L, DeMore J, Carter-Pokras O. Racial differences in clinical presentation of patients with sleep-disordered breathing. Sleep Breath. 2004;8:173–83. doi: 10.1007/s11325-004-0173-5. [DOI] [PubMed] [Google Scholar]
- 29.Deyo RA, Cherkin DC, Ciol MA. Adapting a clinical comorbidity index for use with ICD-9-CM administrative databases. J Clin Epidemiol. 1992;45:613–9. doi: 10.1016/0895-4356(92)90133-8. [DOI] [PubMed] [Google Scholar]
- 30.Needham DM, Scales DC, Laupacis A, Pronovost PJ. A systematic review of the Charlson comorbidity index using Canadian administrative databases: a perspective on risk adjustment in critical care research. J Crit Care. 2005;20:12–9. doi: 10.1016/j.jcrc.2004.09.007. [DOI] [PubMed] [Google Scholar]
- 31.D'Hoore W, Bouckaert A, Tilquin C. Practical considerations on the use of the Charlson comorbidity index with administrative data bases. J Clin Epidemiol. 1996;49:1429–33. doi: 10.1016/s0895-4356(96)00271-5. [DOI] [PubMed] [Google Scholar]
- 32.Johns MW. A new method for measuring daytime sleepiness: the Epworth sleepiness scale. Sleep. 1991;14:540–5. doi: 10.1093/sleep/14.6.540. [DOI] [PubMed] [Google Scholar]
- 33.Johns MW. Reliability and factor analysis of the Epworth Sleepiness Scale. Sleep. 1992;15:376–81. doi: 10.1093/sleep/15.4.376. [DOI] [PubMed] [Google Scholar]
- 34.Diez Roux AV, Merkin SS, Arnett D, et al. Neighborhood of residence and incidence of coronary heart disease. N Engl J Med. 2001;345:99–106. doi: 10.1056/NEJM200107123450205. [DOI] [PubMed] [Google Scholar]
- 35.Practice parameters for the indications for polysomnography and related procedures. Polysomnography Task Force, American Sleep Disorders Association Standards of Practice Committee. Sleep. 1997;20:406–22. [PubMed] [Google Scholar]
- 36.Kushida CA, Littner MR, Morgenthaler T, et al. Practice parameters for the indications for polysomnography and related procedures: an update for 2005. Sleep. 2005;28:499–521. doi: 10.1093/sleep/28.4.499. [DOI] [PubMed] [Google Scholar]
- 37.Liang KY, Zeger SL. Longitudinal data analysis using generalized linear models, Biometrika. 1986;73:13–22. [Google Scholar]
- 38.Sun GW, Shook TL, Kay GL. Inappropriate use of bivariable analysis to screen risk factors for use in multivariable analysis. J Clin Epidemiol. 1996;49:907–16. doi: 10.1016/0895-4356(96)00025-x. [DOI] [PubMed] [Google Scholar]
- 39.Greenberg H, Fleischman J, Gouda HE, et al. Disparities in obstructive sleep apnea and its management between a minority-serving institution and a voluntary hospital. Sleep Breath. 2004;8:185–92. doi: 10.1007/s11325-004-0185-1. [DOI] [PubMed] [Google Scholar]
- 40.Zonato AI, Bittencourt LR, Martinho FL, et al. A comparison of public and private obstructive sleep apnea clinics. Braz J Med Biol Res. 2004;37:69–76. doi: 10.1590/s0100-879x2004000100010. [DOI] [PubMed] [Google Scholar]
- 41.Marmot MG. Status syndrome: a challenge to medicine. JAMA. 2006;295:1304–7. doi: 10.1001/jama.295.11.1304. [DOI] [PubMed] [Google Scholar]
- 42.Lurie N, Dubowitz T. Health disparities and access to health. JAMA. 2007;297:1118–21. doi: 10.1001/jama.297.10.1118. [DOI] [PubMed] [Google Scholar]
- 43.Williams LK, Joseph CL, Peterson EL, et al. Race-ethnicity, crime, and other factors associated with adherence to inhaled corticosteroids. J Allergy Clin Immunol. 2007;119:168–75. doi: 10.1016/j.jaci.2006.09.029. [DOI] [PubMed] [Google Scholar]
- 44.Diehr P, Koepsell T, Cheadle A, Psaty BM, Wagner E, Curry S. Do communities differ in health behaviors? J Clin Epidemiol. 1993;46:1141–9. doi: 10.1016/0895-4356(93)90113-f. [DOI] [PubMed] [Google Scholar]
- 45.Duncan C, Jones K, Moon G. Smoking and deprivation: are there neighbourhood effects? Soc Sci Med (1982) 1999;48:497–505. doi: 10.1016/s0277-9536(98)00360-8. [DOI] [PubMed] [Google Scholar]
- 46.Diez-Roux AV, Nieto FJ, Muntaner C, et al. Neighborhood environments and coronary heart disease: a multilevel analysis. Am J Epidemiol. 1997;146:48–63. doi: 10.1093/oxfordjournals.aje.a009191. [DOI] [PubMed] [Google Scholar]
- 47.Robert SA. Community-level socioeconomic status effects on adult health. J Health Soc Behav. 1998;39:18–37. [PubMed] [Google Scholar]
- 48.Anderson RT, Sorlie P, Backlund E, Johnson N, Kaplan GA. Mortality effects of community socioeconomic status. Epidemiology. 1997;8:42–7. doi: 10.1097/00001648-199701000-00007. [DOI] [PubMed] [Google Scholar]
- 49.Mezick EJ, Matthews KA, Hall M, et al. Influence of race and socioeconomic status on sleep: Pittsburgh SleepSCORE project. Psychosom Med. 2008;70:410–6. doi: 10.1097/PSY.0b013e31816fdf21. [DOI] [PMC free article] [PubMed] [Google Scholar]
- 50.Aloia MS, Arnedt JT, Stanchina M, Millman RP. How early in treatment is PAP adherence established? Revisiting night-to-night variability. Behav Sleep Med. 2007;5:229–40. doi: 10.1080/15402000701264005. [DOI] [PubMed] [Google Scholar]