Abstract
Synthetic gene networks can be constructed to emulate digital circuits and devices, giving one the ability to program and design cells with some of the principles of modern computing, such as counting. A cellular counter would enable complex synthetic programming and a variety of biotechnology applications. Here we report two complementary synthetic genetic counters in E. coli that can count up to three induction events, the first comprised of a riboregulated transcriptional cascade and the second of a recombinase-based cascade of memory units. These modular devices permit counting of varied user-defined inputs over a range of frequencies and can be expanded to count higher numbers.
A counter is a key component in digital circuits and computing that retains memory of events or objects, representing each number of such as a distinct state. Counters would also be useful in cells, which often must have accurate accounting of tightly controlled processes or biomolecules to effectively maintain metabolism and growth. Counting mechanisms have been reportedly found in telomere length regulation (1, 2) and cell aggregation (3). These system behaviors appear to be the result of a thresholding effect in which some critical molecule number or density must be reached for the observed phenotypic change.
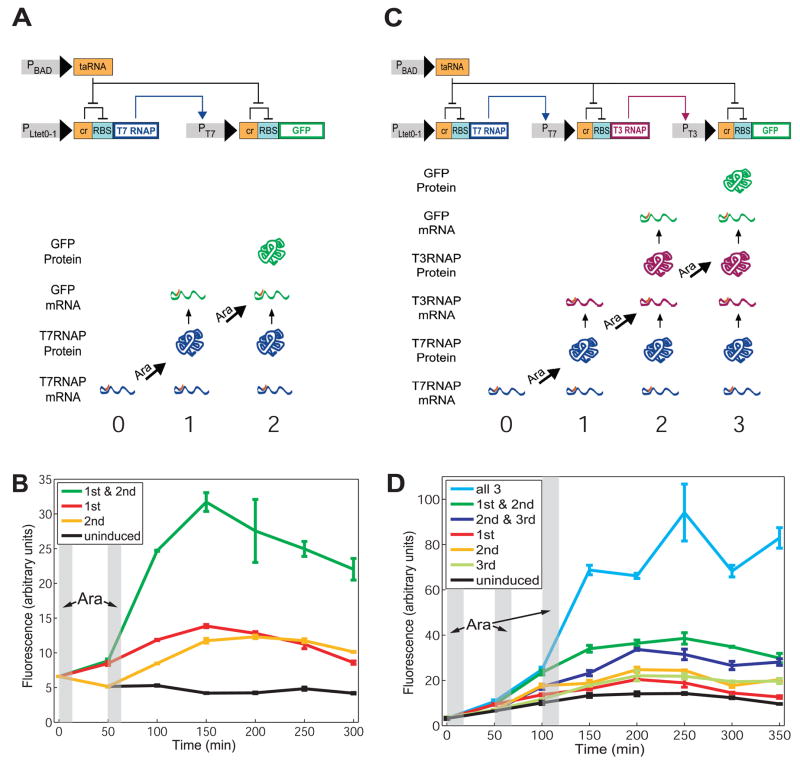
In this study, we first develop a counter, termed the Riboregulated Transcriptional Cascade (RTC) Counter, which is based on a transcriptional cascade with additional translational regulation. Figs. 1A and 1C illustrate two such cascades that can count up to 2 and 3, respectively (hence, the designations RTC 2-Counter and RTC 3-Counter). For the RTC 2-Counter, the constitutive promoter PLtet0–1 drives transcription of T7 RNA polymerase (RNAP), whose protein binds the T7 promoter and transcribes the downstream gene, in this case Green Fluorescent Protein (GFP). Both genes are additionally regulated by riboregulators (4), whose cis and trans elements silence and activate post-transcriptional gene expression, respectively. The cis-repressor sequence (cr) is placed between the transcription start site and the ribosome binding site (RBS), and its complementarity with the RBS causes a stem-loop structure to form upon transcription. This secondary structure prevents binding of the 30S ribosomal subunit to the RBS, inhibiting translation. A short, trans-activating, noncoding RNA (taRNA) driven by the arabinose promoter PBAD binds to the cis-repressor in trans, relieving RBS repression and allowing translation. With this riboregulation, each node (i.e., gene) in the cascade requires both independent transcription and translation for protein expression. This cascade is able to count brief arabinose pulses (see SOM for pulse definition) by expressing a different protein in response to each pulse (Fig. 1A). With cis-repressed T7 RNAP mRNAs in the cell, the first pulse of arabinose drives a short burst of taRNA production and consequently expression of T7 RNAP proteins. After the pulse is delivered, arabinose is removed from the cell environment, intracellular arabinose and taRNA are metabolized, and expression of T7 RNAP protein halts. The T7 RNAP proteins that have been translated then transcribe cis-repressed GFP transcripts, but few GFP proteins are made until the next arabinose pulse is delivered and translation is once again activated.
Fig. 1.
The RTC 2-Counter and RTC 3-Counter construct designs and results. (A) The RTC 2-Counter is a transcriptional cascade with two nodes. Shown at the bottom are expected expression profiles due to 0, 1, and 2 arabinose (Ara) pulses. (B) Mean fluorescence of three replicates of RTC 2-Counter cell populations over time, measured by a flow cytometer. Shaded areas represent arabinose pulse duration. (C) The RTC 3-Counter is a transcriptional cascade with three nodes. Shown at the bottom are expected expression profiles due to 0, 1, 2, and 3 arabinose pulses. (D) Mean fluorescence of three replicates of RTC 3-Counter cell populations over time, measured by a flow cytometer. Shaded areas represent arabinose pulse duration.
We built the RTC 2-Counter construct on a high copy plasmid and transformed it into E. coli strain K-12pro (See SOM for details). Cells containing this construct were pulsed with the inducer arabinose, and mean fluorescence over time was measured (Fig. 1B). Uninduced cells show no increase in mean fluorescence whereas cells that received either the first or second pulse show only small increases, indicating some degree of leakage – an effect in which the intended protein is expressed in each arabinose pulse but also some unintended, downstream proteins are expressed as well. Cells that received both arabinose pulses show a substantial increase in fluorescence when the second pulse is delivered, precisely when the cells are expected to express GFP proteins.
To extend the RTC counter’s capability to count to three, we built a second synthetic construct, the RTC 3-Counter, again with GFP as the quantitative readout. It is similar to the RTC 2-Counter but has three nodes in the cascade instead of two (Fig. 1C). T7 RNAP is the gene at the first node driving transcription of T3 RNAP, which ultimately drives transcription of GFP. All transcripts are likewise cis-repressed with the same riboregulator sequence. When pulsed with arabinose, this counter should primarily produce T7 RNAP proteins during the first pulse, T3 RNAP proteins during the second pulse, and GFP proteins during the third pulse (Fig. 1C).
Experimental results demonstrate that fluorescence increases substantially only when all three arabinose pulses are delivered (Fig. 1D). Flow cytometry measurements show this increase beginning at precisely the time of the third pulse, and the considerable slope at this juncture suggests that cells contain a high concentration of cis-repressed GFP transcripts ready for trans-activation. The data also reveal slight leakage in cells that are pulsed only once or twice, but their fluorescence remains comparatively low. This result, in combination with the RTC 2-Counter evidence, shows that the temporal progression of RNA and protein species logically predicted by the counter network architecture is indeed responsible for the observed effect.
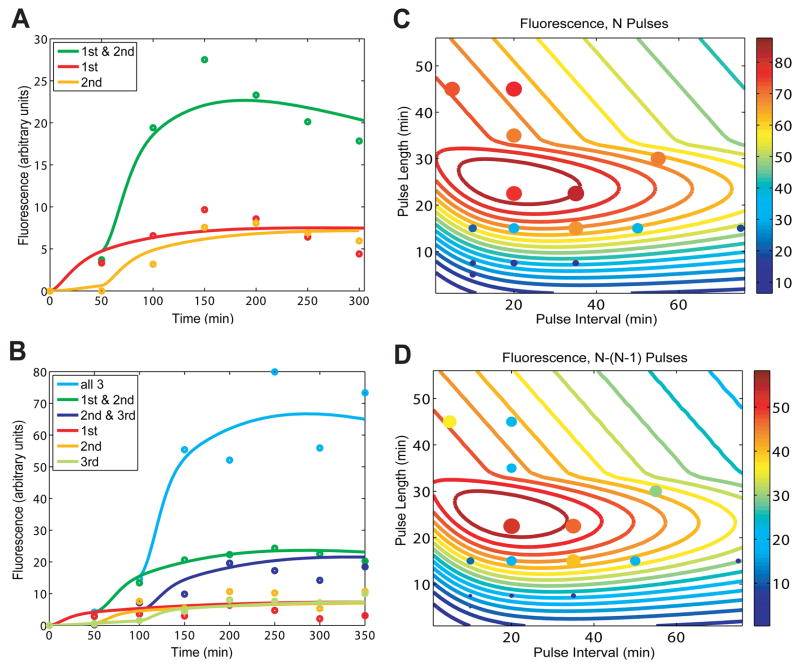
To further support these results, we constructed and analyzed a mathematical model based on the design of the RTC 2-Counter and 3-Counter constructs. This model, with fitted parameters (see SOM Materials and Methods Section 6 for details), was able to match both the RTC 2-Counter and 3-Counter experimental results (Figs. 2A, B). We used the model to investigate the effects of pulse frequency and pulse length on the performance of the RTC 3-Counter and guide our experimental search for optimal combinations. The mathematical model predictions, shown as contour lines in Fig. 2C, indicate that maximum expression occurs with pulse lengths of approximately 20 to 30 minutes and pulse intervals of 10 to 40 minutes. The absolute difference in fluorescence after three pulses and two pulses is shown in Fig. 2D, with optimal counting behavior requiring similar pulse length and interval combinations noted above.
Fig 2.
Modeling predictions and RTC 3-Counter experimental characterization. (A) A model with fitted parameters captures the salient features of the normalized fluorescence results of the RTC 2-Counter. (B) An expanded model, again with fitted parameters, matches the normalized fluorescence results of the RTC 3-Counter. (C) Based on parameters fitted in (B), the model predicts expression output of the RTC 3-Counter across a range of pulse lengths and intervals, and these calculations were used to generate the colored contour lines. Solid circles represent experimental results, with both color and size of circles indicating the level of expression. (D) Similar to (C), except values shown are the difference in expression output after three pulses and two pulses.
Experimentally, we sampled various pulse lengths and intervals, plotting these results as circles in Figs. 2C and 2D. These results are consistent with the model predictions across a wide range of temporal conditions, and confirm that the RTC 3-Counter has a sizeable temporal region in which its counting behavior is robust. Within this region, the counter is also capable of counting irregular pulses; for example, it is able to distinguish between two short pulses followed by a long pulse and two long pulses, as predicted by the model (Fig. S5). However, as indicated in Fig. 2, when pulse length or frequency is either too high or low, the RTC 3-Counter is unable to count properly, presumably due to the intrinsic kinetic limits of the biochemical processes involved, such as transcription and mRNA degradation.
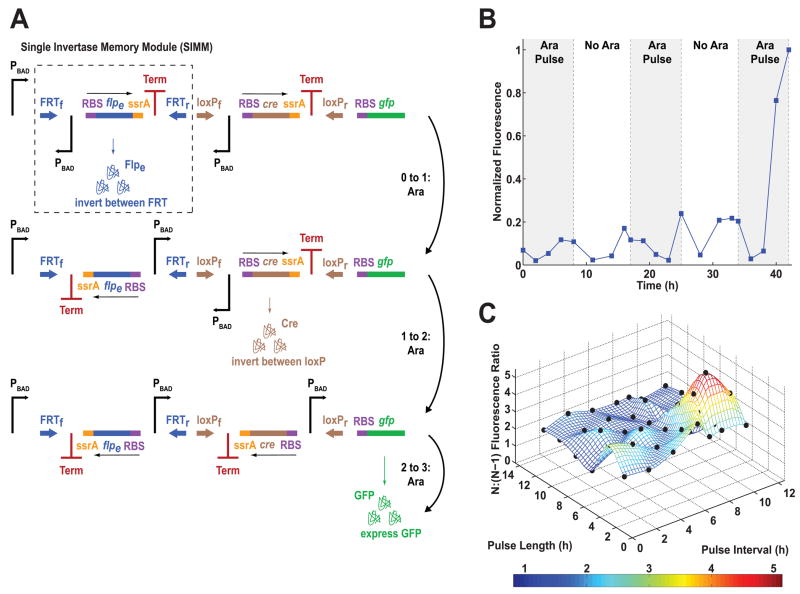
Our second counter design, termed the DNA Invertase Cascade (DIC) Counter, is built by chaining together modular DNA-based counting units (Fig. 3A). The DIC Counter utilizes recombinases, such as cre and flpe (5), which can invert DNA between two oppositely-oriented cognate recognition sites, such as loxP and flpe-recombination target (FRT) sites, respectively. Recombinases have been used for numerous applications, including the creation of gene knockouts and inducible expression systems (6, 7). In our counter design, each recombinase gene (rec) is downstream of an inverted promoter (Pinv), fused to an ssrA tag that causes rapid protein degradation (8), and followed by a transcriptional terminator (Term) (Fig S7). The Pinv-rec-ssrA-Term DNA sequences are placed between forward and reverse recombinase recognition sites (Rf and Rr) (Fig. S7), forming a single counting unit which we have named a Single Invertase Memory Module (SIMM) (Figs. 3A, S7). Upon expression of recombinase by an upstream promoter, the entire SIMM is inverted between the recognition sites. Due to the inverted orientation of the recombinase gene with respect to the upstream promoter, further expression of recombinase protein ceases and DNA orientation is fixed.
Fig. 3.
The single-inducer DIC 3-Counter construct design and results. (A) The single-inducer DIC 3-Counter is built by cascading SIMMs. (B) Mean fluorescence of single-inducer DIC 3-Counter cell populations over time, measured by a flow cytometer. Shaded areas represent arabinose pulse duration. (C) GFP fluorescence ratios between the single-inducer DIC 3-Counter exposed to three pulses of arabinose (N) versus two pulses of arabinose (N-1) with varying arabinose pulse lengths and intervals; experimental results are represented by black dots.
We developed a single-inducer DIC 2-Counter (Fig. S8) and 3-Counter (Figs. 3A, S9), which are composed of one and two SIMMs, respectively, and placed them on pBAC plasmids that are maintained as single-copy episomes (9). These circuits utilize PBAD so that pulses of arabinose constitute inputs to the circuit. Each pulse of arabinose results in promoter activation and expression of the next recombinase in the cascade, which then inverts the SIMM in which it is located. This allows the inverted promoter contained within that SIMM to be placed in a forward orientation to drive expression of the next SIMM stage. The single-inducer DIC 2-Counter shows high GFP output after two pulses of arabinose and only low GFP output after one pulse of arabinose, demonstrating that a single SIMM can be inverted to count events (Fig. S11). In the single-inducer DIC 3-Counter, some premature flipping of the cre-based SIMM did occur, resulting in a small amount of leakage, e.g., fluorescence increased after only two arabinose pulses (Figs. 3B, S12). However, this leakage was small compared to the high GFP output exhibited in response to three pulses of arabinose (Fig. 3B). In order to probe the temporal characteristics of the single-inducer DIC 3-Counter, we varied the pulse lengths and intervals, calculating the ratio of GFP output for cells exposed to three versus two pulses of arabinose (Fig. 3C). This ratio was at least 1.5 for most conditions tested, demonstrating that the single-inducer DIC 3-Counter is able to successfully count pulses whose lengths and intervals range from 2 to 12 hours (Fig. 3C).
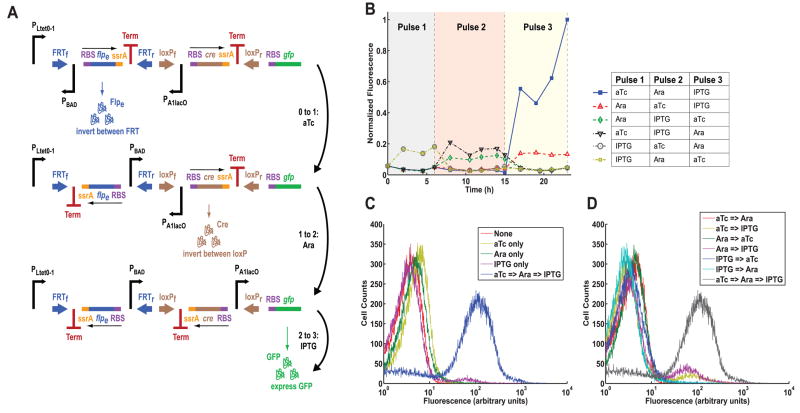
We also developed a multiple-inducer DIC 3-Counter by replacing the PBAD promoters in the single-inducer DIC 3-Counter with the inducible promoters PLtet0–1, PBAD, and PA1lacO (Fig. 4A, S10). These promoters respond to anhydrotetracycline (aTc), arabinose, and isopropyl β-D-1-thiogalactopyranoside (IPTG), respectively (Fig. 4A). When exposed to aTc followed by arabinose followed by IPTG, the multiple-inducer DIC 3-Counter produced a high GFP output (Fig. 4B). No other permutations of the three inducers produced a high output, though some did exhibit a small amount of leakage (Figs. 4C, 4D). These results demonstrate that the circuit can be programmed to only record a desired sequence of events.
Fig. 4.
The multiple-inducer DIC 3-Counter construct design and results. (A) The multiple-inducer DIC 3-Counter is similar to the single-inducer DIC 3-Counter in Fig. 3 except that each promoter is a unique inducible promoter: PLtet0–1, PBAD, and PA1lacO. These promoters respond to anhydrotetracycline (aTc), arabinose, and IPTG, respectively. (B) Mean fluorescence of multiple-inducer DIC 3-Counter cell populations over time, measured by a flow cytometer. Colored areas represent the durations of consecutive inducer pulses. (C) Flow cytometry population data showing the multiple-inducer DIC 3-Counter when exposed to the desired sequence of three inducers and to single inducers only. (D) Flow cytometry population data showing the multiple-inducer DIC 3-Counter when exposed to the desired sequence of three inducers and to all pairwise permutations of inducers.
We have constructed and validated two complementary designs for synthetic counters that operate across a range of time scales. These counters are both highly modular and capable of functioning with multiple inducer-promoter pairs. Additionally, the architectures of both counters allow for the tunable output expression of different protein species of interest at any number (up to 3 shown) in the counting process. Our constructs were built to count up to three events, but they both should be extensible with the use of other unique polymerases or recombinases, of which many are known (see SOM Text for details). In addition to these shared qualities, each counter comes with its own set of properties. Our RTC Counters demonstrate fast activation due to transcriptional and translational regulatory elements, making them useful for counting cellular events on the time scale of cell division. The DIC Counters operate on time scales of hours (Fig. S13) as a result of DNA recombination dynamics (10), and they are built with a novel SIMM design that retains counter state based on DNA orientation.
Synthetic gene circuits have enlarged the molecular toolset available to bio-engineers and molecular biologists (4, 11–23), enabling them to program novel cellular behaviors (24–26) and construct therapeutic agents (27, 28). Our synthetic counters represent complementary designs that can be used in different settings for a variety of purposes across a range of time scales. For example, if inputs to our RTC Counter were coupled to the cell cycle, one might program cell death to occur after a user-defined number of cell divisions as a safety mechanism in engineered strains used for biosensing, bioremediation, or medical purposes. In addition, the multiple-inducer DIC Counter might be used to study sequential events that occur in settings such as developmental biology and gene cascades; the single-inducer DIC counter could record events encountered in its environment (e.g., for biosensing); and our SIMM design could be used in other synthetic circuits to maintain genetic memory of low frequency events, for therapeutic or other applications such as studying neural circuits.
Supplementary Material
Acknowledgments
Supported by the NIH Director’s Pioneer Award Program, the NSF FIBR program, and the HHMI. Authors’ contributions are in Supplementary Online Materials.
Footnotes
This manuscript has been accepted for publication in Science. This version has not undergone final editing. Please refer to the complete version of record at http://www.sciencemag.org/. The manuscript may not be reproduced or used in any manner that does not fall within the fair use provisions of the Copyright Act without the prior, written permission of AAAS.
References
- 1.Marcand S, Gilson E, Shore D. Science. 1997;275:986. doi: 10.1126/science.275.5302.986. [DOI] [PubMed] [Google Scholar]
- 2.Ray A, Runge KW. Mol Cell Biol. 1999;19:31. doi: 10.1128/mcb.19.1.31. [DOI] [PMC free article] [PubMed] [Google Scholar]
- 3.Brock DA, Gomer RH. Genes Dev. 1999;13:1960. doi: 10.1101/gad.13.15.1960. [DOI] [PMC free article] [PubMed] [Google Scholar]
- 4.Isaacs FJ, et al. Nat Biotechnol. 2004;22:841. doi: 10.1038/nbt986. [DOI] [PubMed] [Google Scholar]
- 5.Buchholz F, Angrand PO, Stewart AF. Nat Biotechnol. 1998;16:657. doi: 10.1038/nbt0798-657. [DOI] [PubMed] [Google Scholar]
- 6.Groth AC, Calos MP. J Mol Biol. 2004;335:667. doi: 10.1016/j.jmb.2003.09.082. [DOI] [PubMed] [Google Scholar]
- 7.Ham TS, Lee SK, Keasling JD, Arkin AP. Biotechnol Bioeng. 2006;94:1. doi: 10.1002/bit.20916. [DOI] [PubMed] [Google Scholar]
- 8.Andersen JB, et al. Appl Environ Microbiol. 1998;64:2240. doi: 10.1128/aem.64.6.2240-2246.1998. [DOI] [PMC free article] [PubMed] [Google Scholar]
- 9.Wright DA, et al. Nat Protoc. 2006;1:1637. doi: 10.1038/nprot.2006.259. [DOI] [PubMed] [Google Scholar]
- 10.Santoro SW, Schultz PG. Proc Natl Acad Sci U S A. 2002;99:4185. doi: 10.1073/pnas.022039799. [DOI] [PMC free article] [PubMed] [Google Scholar]
- 11.Elowitz MB, Leibler S. Nature. 2000;403:335. doi: 10.1038/35002125. [DOI] [PubMed] [Google Scholar]
- 12.Gardner TS, Cantor CR, Collins JJ. Nature. 2000;403:339. doi: 10.1038/35002131. [DOI] [PubMed] [Google Scholar]
- 13.Bayer TS, Smolke CD. Nat Biotechnol. 2005;23:337. doi: 10.1038/nbt1069. [DOI] [PubMed] [Google Scholar]
- 14.Baker D, et al. Sci Am. 2006;294:44. doi: 10.1038/scientificamerican0606-44. [DOI] [PubMed] [Google Scholar]
- 15.Rackham O, Chin JW. Nat Chem Biol. 2005;1:159. doi: 10.1038/nchembio719. [DOI] [PubMed] [Google Scholar]
- 16.Rinaudo K, et al. Nat Biotechnol. 2007;25:795. doi: 10.1038/nbt1307. [DOI] [PubMed] [Google Scholar]
- 17.Yokobayashi Y, Weiss R, Arnold FH. Proc Natl Acad Sci U S A. 2002;99:16587. doi: 10.1073/pnas.252535999. [DOI] [PMC free article] [PubMed] [Google Scholar]
- 18.Guido NJ, et al. Nature. 2006;439:856. doi: 10.1038/nature04473. [DOI] [PubMed] [Google Scholar]
- 19.Pedraza JM, van Oudenaarden A. Science. 2005;307:1965. doi: 10.1126/science.1109090. [DOI] [PubMed] [Google Scholar]
- 20.Deans TL, Cantor CR, Collins JJ. Cell. 2007;130:363. doi: 10.1016/j.cell.2007.05.045. [DOI] [PubMed] [Google Scholar]
- 21.Fung E, et al. Nature. 2005;435:118. doi: 10.1038/nature03508. [DOI] [PubMed] [Google Scholar]
- 22.Kramer BP, et al. Nat Biotechnol. 2004;22:867. doi: 10.1038/nbt980. [DOI] [PubMed] [Google Scholar]
- 23.Stricker J, et al. Nature. 2008;456:516. doi: 10.1038/nature07389. [DOI] [PMC free article] [PubMed] [Google Scholar]
- 24.Basu S, Gerchman Y, Collins CH, Arnold FH, Weiss R. Nature. 2005;434:1130. doi: 10.1038/nature03461. [DOI] [PubMed] [Google Scholar]
- 25.Kobayashi H, et al. Proc Natl Acad Sci U S A. 2004;101:8414. doi: 10.1073/pnas.0402940101. [DOI] [PMC free article] [PubMed] [Google Scholar]
- 26.Levskaya A, et al. Nature. 2005;438:441. doi: 10.1038/nature04405. [DOI] [PubMed] [Google Scholar]
- 27.Lu TK, Collins JJ. Proc Natl Acad Sci U S A. 2007;104:11197. doi: 10.1073/pnas.0704624104. [DOI] [PMC free article] [PubMed] [Google Scholar]
- 28.Lu TK, Collins JJ. Proc Natl Acad Sci U S A. 2009;106:4629. doi: 10.1073/pnas.0800442106. [DOI] [PMC free article] [PubMed] [Google Scholar]
Associated Data
This section collects any data citations, data availability statements, or supplementary materials included in this article.


