Abstract
The entrapment efficiency (EE) and release in vitro are very important physicochemical characteristics of puerarin submicron emulsion (SME). In this paper, the performance of ultrafiltration (UF), ultracentrifugation (UC), and microdialysis (MD) for determining the EE of SME were evaluated, respectively. The release study in vitro of puerarin from SME was studied by using MD and pressure UF technology. The EE of SME was 86.5%, 72.8%, and 55.8% as determined by MD, UF, and UC, respectively. MD was not suitable for EE measurements of puerarin submicron oil droplet, which could only determine the total EE of submicron oil droplet and liposomes micelles, but it could be applied to determine the amount of free drug in SMEs. Although UC was the fastest and simplest to use, its results were the least reliable. UF was still the relatively accurate method for EE determination of puerarin SME. The release of puerarin SME could be evaluated by using MD and pressure UF, but MD seemed to be more suitable for the release study of puerarin emulsion. The drug release from puerarin SME at three drug concentrations was initially rapid, but reached a plateau value within 30 min. Drug release of puerarin from the SME occurred via burst release.
Key words: drug release, entrapment efficiency, microdialysis, pressure ultrafiltration technology, submicron emulsion
INTRODUCTION
Submicron emulsion (SME), also referred to as lipid emulsion or lipid microsphere, is a potentially interesting drug delivery system (1). It can reduce drug hydrolysis and increase drug bioavailability (2). The SME system has gained increasing importance for the administration of those drugs which are poorly soluble in water and oils and simultaneously toxiferous for intravenous injection. The SME system also enhances the activity and bioavailability of these drugs (3,4). Reports on the ability of these systems to enhance the drug solubility and efficacy and to reduce side effects by incorporating the drug into the lipophilic core (of the oil droplets or in the core of micelles) or in the interface have appeared in the literature (5–8).
The entrapment efficiency (EE) is one of the most important physicochemical characteristics of puerarin SME. Accordingly, it is of crucial importance to accurately quantify the EE of SME. Many methods have been used to evaluate the EE of SME, including dialysis bag diffusion, gel filtration, ultrafiltration (UF), and ultracentrifugation (UC) (9–12). The application of UF to the separation of free drug from SME has been extensively examined in a variety of practical applications (11,13). Among these methods, UF is the most widely used technique for determining the EE of nanoparticles, including SME.
Recently, the microdialysis (MD) technique has also been used to determine the EE of nanocapsules, nanospheres, and nanoemulsions (14). As far as nanoparticle loading of drugs is concerned, free drug would diffuse into the probe because there is a concentration gradient of free drug from the outside to the inside of the MD fiber. The molecular weight cutoff of the MD membrane is such that nanostructures and, therefore, the incorporated drug cannot cross the membrane. Convection continually renews the solution around the probe, keeping the concentrations of all components outside the probe at the bulk solution concentration. Because little drug is actually removed from the sample, the overall free drug concentration remains essentially constant during the experiment. Also, because MD does not change the fluid volume, the total drug concentration remains constant. Therefore, the equilibrium of entrapped and free drug is not disturbed by this technique.
In addition, the UC technique has also been used to determine the EE of SME because it can be used to separate oil droplets and most of the aqueous phase from the emulsion (15). It is based on the different sedimentation velocities of mixtures with different densities. After an initial cream layer formation, where most of the oil droplets are centrifuged to the top of the tube and compressed, the water phase of free oil is observed. But considerable breakdown of the SME is achieved during prolonged centrifugation, the redistribution of drug molecules will probably occur, which calls into question the reliability of the EE evaluation by means of UC.
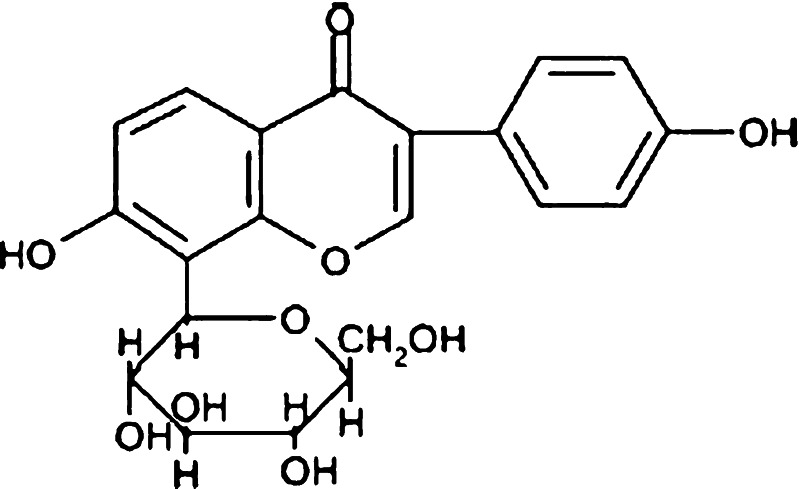
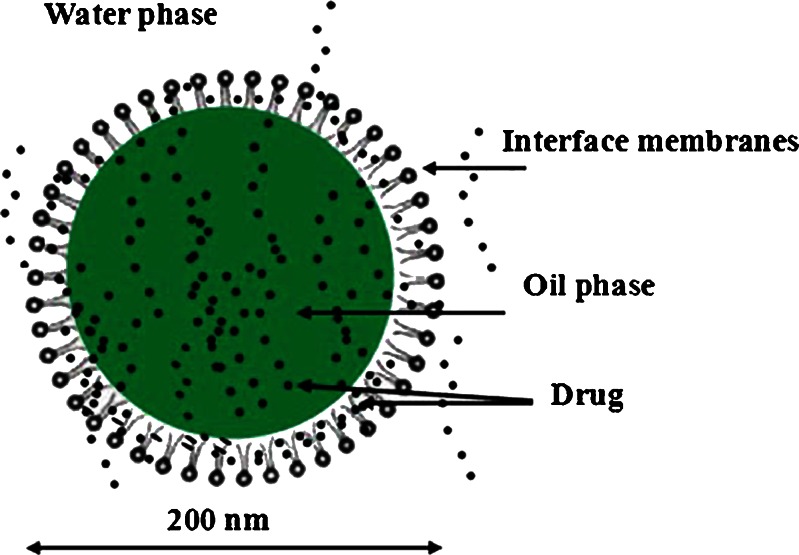
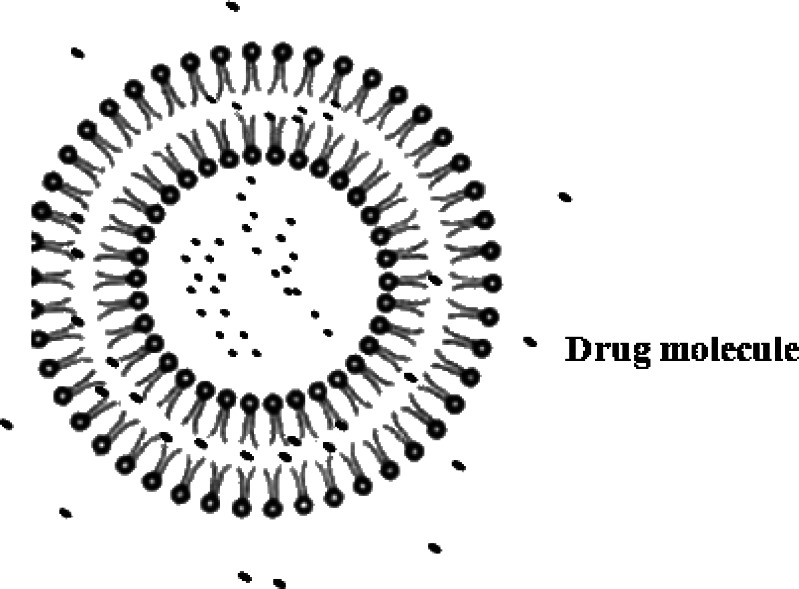
Puerarin, a naturally occurring isoflavone C-glycoside (Fig. 1), was isolated from Pueraria lobata, one of the most popular traditional Chinese herbal medicines. It was traditionally used to reduce febrile symptoms, decrease myocardial consumption of oxygen, increase coronary artery blood flow, and improve microcirculation (16–18). Due to poor oral bioavailability, the commercial product puerarin i.v. was widely used for the treatment of coronary artery disease, ischemic heart disease, cerebrovascular disease, coronarism, cerebral angiospasm, cerebral infarction, and cerebral thrombosis in clinic (19,20). But the clinical efficacy of puerarin i.v. was limited by severe and acute toxic side effects, such as intravenous hemolysis (21,22). In the present study, a new formulation, puerarin SME, has been developed. Puerarin was incorporated into the SME, which could be responsible for reducing the hemolysis side effect (23). As shown in Fig. 2, there could be drug molecules in the aqueous phase, the oil–water phase, and the oil phase, respectively. Puerarin with aqueous solubility of about 3.46 mg/mL was poorly soluble in oil (24). There was insufficient loading capability in the aqueous and oil phases simultaneously, most of the drugs might be present in the interfacial surface where the molecules of the surfactant were arranged in order between the aqueous and oil interface with puerarin molecules located between them. So, it was very necessary to evaluate the EE and in vitro release character of puerarin SME.
Fig. 1.
The chemical structure of puerarin
Fig. 2.
The proposed structure of puerarin SME
The main objectives of this study were: (1) to evaluate MD and UC as techniques for determining the EE of puerarin SME, UF as reference technique to determine the EE of SME; (2) to evaluate the release character in vitro of puerarin SME. In vitro release studies were performed using by MD technology, and pressure UF technology as reference technique to determine the in vitro release of puerarin.
MATERIALS AND METHODS
Materials
Puerarin was obtained from Xian-guochui, purity 99.5% (Xi’an, China). Egg phospholipids was purchased from Hua-qing-mei-hen, purity 82% (Beijing, China). Purified soybean oil for parenteral use (Tieling BeiYa Pharmaceutical, Tieling, China), synperonic F68 (BASF AG, Germany). All other chemicals and reagents were of analytical or chromatographic grade.
The MD probes were U-shaped, made of hollow cellulose fibers (DM-22, 200 μm inner diameter and 220 μm outer diameter, with a cutoff at a nominal molecular weight of 5,000 Da; Eicom, Japan), and the active region of the MD probe was 10 mm in length.
Preparation of Puerarin Submicron Emulsion
The basic formula of the SME was: soybean oil, 12 g; egg phospholipids, 1.2 g; synperonic F68, 0.1 g; glycerol, 2.5 g; α-tocopherol, 300 mg; puerarin, 1 g; double-distilled water, 90.0 g.
The preparation of the puerarin SMEs involved six steps, as follows:
Preparation of the puerarin phospholipids complexes: Weighed amount of puerarin and phospholipid at a weight ratio of 1:1.2 were placed in a 100-mL round-bottom flask and 60 mL of absolute alcohol was added. The mixture was refluxed at a temperature not exceeding 60°C for 3 h. The resultant clear solution was dried at 40°C under vacuum to remove traces of solvents in order to obtain the puerarin phospholipid complexes.
Preparation of the lipid phase: The puerarin phospholipid complexes and α-tocopherol were dissolved in soybean oil at 55°C.
Preparation of the water phase: The water, synperonic F68, and glycerol were mixed at 55°C.
Preparation of the coarse emulsion: The lipid phase was stirred at 55°C at 2,000 rpm by high-speed stirrer, and the water phase was slowly injected into the lipid phase to obtain coarse emulsion.
Homogenization: A fine emulsion was prepared by passing the coarse emulsion through a high-pressure homogenizer (GYB40-10S, Donghua Homogenization Apparatus, China).Homogenization conditions were typically 80–120 MPa and five to 20 cycles at 25°C. Afterwards, the pH was adjusted to 6–7 with 0.1 N sodium hydroxide solution.
Sterilization: The emulsion was packed in 15 mL sterile glass vials under nitrogen. The vials were sealed and the emulsion was sterilized by autoclaving (autoclaving sterilization cabinet, YZM-03BS, Haoersheng Sterilization Apparatus, China) at 121°C for 15 min.
Particle Size of SME
Measurements of the particle size and mean diameter of the emulsion were performed using a Malvern Zetasizer (Malvern Instruments, Malvern, UK). The obtained distribution was a volume distribution; as characterization parameters, the LD diameters 50%, 90%, 95%, and 99% were calculated. For example, a diameter 90% (D90) meant that 90% of the volume of the particles was below the given size in nanometers. The width of the particle size distribution was expressed as the span of dispersity (SD) (25):
 |
1 |
Light Microscopy Analysis
Light microscopy was performed by a BH-2 microscope (Chongqing, China). The magnification selected was 1,500-fold, oil immersion applied. Emulsion was undiluted to analyze. Typically, 20 microscopic fields were analyzed under polarized light for the detection of remaining drug crystals.
Liposomes Micelles Size Measurement
The mean diameter and size distribution of small liposomes micelles in the aqueous layer after UC were also examined by the dynamic light scattering technique with the NicompTM 380 Particle Sizing System (Santa Barbara, USA).
Conditions of High-Performance Liquid Chromatography
A HP 1100 chromatographic system consisting of a quaternary pump (G1100A Quat Pump, Agilent), degasser, diode array detector (G1100A DAD, Agilent), and HP Chemstation Data system (Agilent Technologies, Palo Alto, CA, USA) was used. Chromatographic column Spherisorb ODS C18 (250 × 4.6 mm, 5 μm) was used for chromatographic separation.
The mobile phase consisted of a mixture of methanol–H2O (30:70, v/v) delivered at a flow rate of 1.0 mL/min. The injection volume was 20 μL. UV detection was performed at 250 nm at room temperature.
The Entrapment Efficiency Measurement
Microdialysis Experiment
The relative recovery was determined by immersing the MD probes in the stirred puerarin standard solution (ethanol–water, 2:8), which contained different concentrations of puerarin (0.5, 2.0, and 4.0 mg/mL) as the MD medium (CMM). The probes were perfused with drug-free solution at a flow rate of 4 μL/min and the temperature was kept at room temperature. The concentration of puerarin in the microdialysate samples was determined using high-performance liquid chromatography (HPLC) (CMS). The relative recovery (RR) of puerarin was calculated using the following equation (26):
 |
2 |
For the EE determination, the MD probe was inserted into glass vials containing puerarin SME at room temperature. The flow rate was set at 4 μL/min−1. After a 30-min equilibration period, the dialysate from the SME was collected at 20-min intervals and analyzed by HPLC. The total puerarin concentration was also measured by HPLC after dissolution of the puerarin SME. The EE was calculated according to the following equation:
 |
3 |
where CT was the total concentration of puerarin and r was the ratio of the aqueous phase volume of the SME and the total volume.
Ultrafiltration Test
The free puerarin was determined in the ultrafiltrate after separation of the SME by UF and centrifugation through VIVASPIN 4 filters (molecular weight cutoff 10 kDa). There was nonspecific adsorption of the drug to the UF membrane. Therefore, it was necessary to determine the recovery (R′) by UF and centrifugation of the puerarin standard solution (ethanol–water, 2:8) containing different concentrations of puerarin (6, 8, and 10 mg/mL). The recovery was calculated by the following equation:
 |
4 |
where CT was the concentration of puerarin and CF was the concentration of puerarin in the ultrafiltrate.
For EE determination, 4 mL puerarin SME was added into the VIVASPIN 4 and centrifuged for 1 h at 3,000 rpm. The concentration of puerarin entrapped in SME was calculated from the difference between the total and free drug concentrations, measured in the SME and in the ultrafiltrate. The EE was calculated as follows:
 |
5 |
Ultracentrifugation Test
About 3 ml of SME was ultracentrifuged in a Hitachi ultracentrifuge (CS120GXL) at 162,000×g at 4°C for 1 h. The EE of the SME was determined by measuring the amount of puerarin (CW) in the water layer obtained after UC. The EE was calculated according to the following equation:
 |
6 |
The Release Characterization In Vitro of Puerarin Submicron Emulsion
Pressure Ultrafiltration Technology Test
An Amicon 8050 pressure UF cell fitted with a Millipore YM10 membrane was used (both obtained from Millipore). That 49 mL of release medium (ethanol–pH 7.4 phosphate buffer, 2:8), was placed into the Amicon cell, and 1 mL of the SME was injected into the cell while stirring (t = 0). At predetermined time points, pressure was applied such that the flow rate of the ultrafiltrate was approximately 1 mL/min and sample was collected (after discarding the appropriate amount of solution). An equivalent amount of phosphate buffer was added to the release medium at each time point to maintain the total volume at 50 mL. A sample of the initial dispersion was used to calculate the extent of drug release. All operations were conducted at ambient temperature (22 ± 2°C).
Microdialysis Test
For the in vitro release study, the MD probe was inserted into the receptor compartment containing dialysis medium (ethanol–pH 7.4 phosphate buffer, 2:8; 49 mL) at ambient temperature (22 ± 2°C). The flow rate was set at 4 μL/min. After a 30-min equilibration period, puerarin SME (1 mL) was placed into the receptor compartment. The other dissolution conditions were equivalent to UF. The dialysate from the SME were collected at predetermined time intervals and analyzed by HPLC.
RESULTS AND DISCUSSION
Preparation and Size Distribution of SME
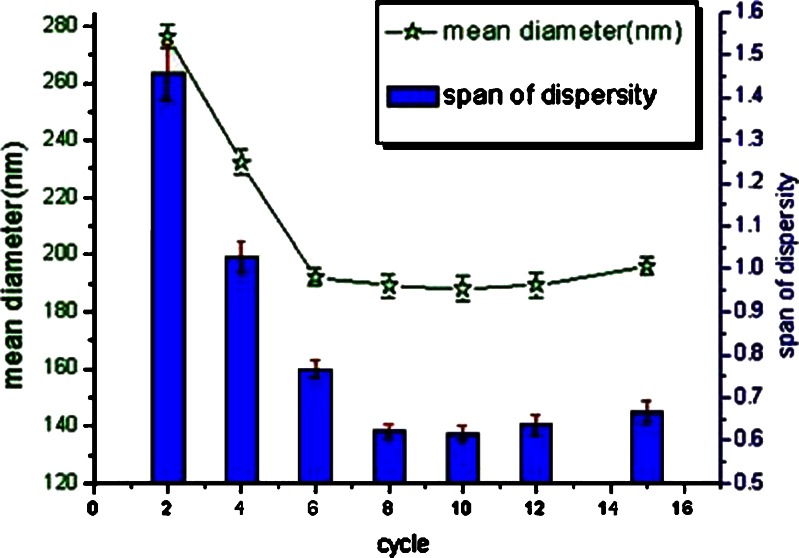
In this study, puerarin was poorly soluble in soybean oil and slightly soluble in water. Puerarin phospholipid complexes were prepared in order to improve the lipophilicity of puerarin in the oil (27). A concentration of 10 mg/mL puerarin in the emulsion was chosen for the preparation of the drug-loaded emulsion. No drug crystals were detected in the puerarin emulsion by microscope with an enlargement factor of 1,500. The homogenization was considered to be the crucial step that affected the particle size of the emulsion. High-pressure emulsification produced a more rapid reduction in particle size. The coarse emulsion was homogenized for 15 homogenization cycles applying individually 50 and 80 MPa at 25°C, samples were collected after two, four, six, eight, ten 12, and 15 cycles, respectively. Then, the mean droplet size, droplet size distribution, and presence drug crystal were determined. There was a slight decrease in mean particle size with increasing homogenized pressure and cycle times. The final particle sizes were lowest (188.14 nm; see Fig. 3) with no overprocessing on applying the highest pressure (80 MPa, 15 cycles). However, puerarin emulsion yielded at 80 MPa had a slightly broad distribution than others. Figure 3 showed the mean diameters of the emulsion. The data showed that just 50 MPa for eight to ten cycles appeared to be sufficient to yield the fine emulsion with small particle size and narrow distribution range.
Fig. 3.
The average diameter and SD of the homogenized SME as a function of cycle numbers at 50 MPa. Data was expressed as mean±SD(n = 3)
To apply high-pressure homogenization technology, the small particle size (approximately 100–200 nm) of the emulsified oil droplets in the emulsion was obtained, which resulted in a sizeable interfacial surface area. There would be sufficient loading capability in the interfacial surface or oil droplet for puerarin.
Light Microscopy Analysis
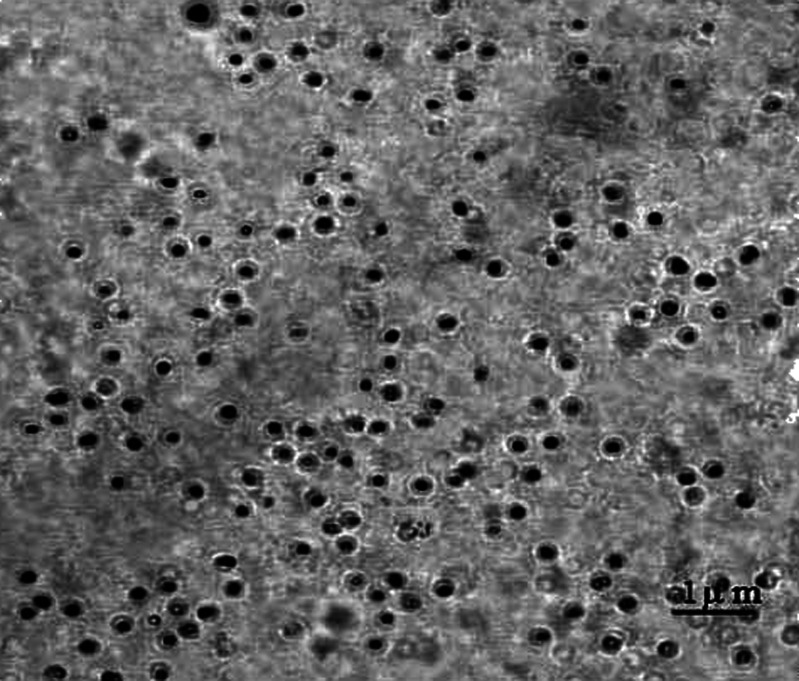
PCS covered the size range of about 5 nm–3 μm, but it was limited to the detection of particles undergoing Brownian motion, so those particles larger than approximately 3 μm were undetectable. In addition, it was difficult to identify nonincorporated drug particles in an ivory–white emulsion and it could not differentiate between similarly sized droplets and drug crystals (28). Accordingly, light microscopy was applied to examine puerarin emulsion with concentrations of 10 mg/mL; it was investigated whether there was the solid drug particles in the emulsion. In order to increase the probability of detecting the presence of even only a few solid drug particles, the puerarin emulsion was not diluted. Figure 4 showed that no drug crystals were found in the emulsion.
Fig. 4.
Light microscopy analysis of emulsion load with 10 mg/mL drug
Liposomes Micelles Size
The SMEs consisted of oil droplets in the submicron range together with small liposomes micelles because of an excess of lecithin (29). The small liposomes micelles had closed bilayer structures. This result was an assembly in which the hydrophobic parts of the molecule were shielded from the aqueous solvent and the hydrophilic head groups were in maximum contact with them (30). Therefore, liposomes micelles could encapsulate drug molecules in the aqueous phase (see Fig. 5). During the preparation of SME, a portion of the drug molecules in the oil phase passed into the aqueous phase, but some were free in the aqueous and the rest were intercalated into the liposomes micelles.
Fig. 5.
The structure of liposomes micelles
The liposomes micelles had a very low sedimentation velocity since their densities were only marginally different from those of the aqueous medium. It would be very difficult to separate the liposomes micelles from the aqueous phase by means of UC. At the end of the UC, the slightly turbid aqueous layer was collected for the particle size measurement. The mean particle diameter (n = 3) was 49.3 ± 5.46 nm, which was similar to those obtained for the small liposomes micelles dispersions. Similar vesicle sizes for liposomes micelles in aqueous phase of SME were consistent with the previous report (31,32).
Microdialysis and Ultrafiltration Recoveries
The recovery of the probe depended on many factors. The perfusion flow rate was an important factor, which defined the performance of a MD probe and directly influenced the recovery by the probe. The flow rate and the temperature were set as described earlier. At this perfusion rate, the relative recoveries of puerarin at concentrations of 0.5, 2.0, and 4.0 mg/mL were shown in Table I. It showed that the flow rate used in this study was in the upper limit of the range used for MD technique, but the puerarin concentrations (0.5, 2.0, and 4.0 mg/mL) had no effect on the relative recovery.
Table I.
MD Probe and UF Recoveries
| MD | UF | ||
|---|---|---|---|
| Puerarin (mg/mL) | RR (%) | Puerarin (mg/mL) | R′ (%) |
| 0.5 | 36.1 ± 2.13 | 6 | 96.2 ± 2.07 |
| 2.0 | 35.7 ± 1.81 | 8 | 97.1 ± 1.64 |
| 4.0 | 36.6 ± 2.21 | 10 | 97.9 ± 1.13 |
| Mean values | 36.1 ± 0.45 | Mean values | 97.1 ± 0.85 |
MD microdialysis
UF ultrafiltration
To calibrate the free puerarin concentrations for nonspecific adsorption by the filtration membrane, the UF recovery was carried out using the puerarin standard solution at three different concentrations (6, 8, and 10 mg/mL) as described above. The UF recovery data were shown in Table I. The recovery results showed that the concentration of drug adsorbed by the UF membrane was less than 5%.
The drug concentration with nonspecific adsorption for MD was less compared with that for UF because of the smaller surface area of the membrane involved. The surface area of the MD membranes used in these experiments was much smaller than that of the UF membranes. If the membranes were similar with regard to the nonspecific adsorption sites, the UF membrane would bind more drug than the MD membrane. In addition, the dialysis samples were collected until a constant value was reached in order to eliminate any error due to nonspecific adsorption (33).
The Entrapment Efficiency Study of Puerarin Submicron Emulsion
Table II showed the EE of puerarin SME determined by means of the MD, UF, and UC techniques. The EE of SME was 86.5%, 72.8%, and 55.8% as determined by MD, UF, and UC, respectively. The results showed that the EE measured by MD was significantly different compared with those measured by UC and UF (p < 0.05).
Table II.
Trapping Efficiencies of Puerarin Lipid Microspheres Determined by MD, UF, and UC (Mean±SD, n = 3)
| Preparation (batch) | EE by MD (%)* | EE by UF (%)* | EE by UC (%)* |
|---|---|---|---|
| 1 | 87.5 ± 1.17 | 73.3 ± 0.94 | 56.9 ± 2.35 |
| 2 | 86.7 ± 2.06 | 72.4 ± 1.12 | 54.2 ± 3.17 |
| 3 | 85.4 ± 1.33 | 72.6 ± 1.42 | 56.3 ± 2.74 |
| Mean values | 86.5 ± 1.06 | 72.8 ± 0.47 | 55.8 ± 1.42 |
* p < 0.05, statistically significant differences among MD, UF, and UC
EE entrapment efficiency; MD microdialysis; UF ultrafiltration; UC ultracentrifugation
It was thought that the drug concentration in microdialysate determined by MD was that of free drug in the aqueous phase. Although the determination principle of the UF method also involved a molecular weight cutoff, the liposomes micelles could pass through the filter membrane because of the compression of centrifugation force. So the amount of drug in the filtrate was that of the quantity of free drug and associated with the liposomes micelles in the aqueous phase. It was for this reason that the EE determined by UF was lower than that determined by MD.
Additionally, with respect to UC technology, it was very difficult to separate liposomes micelles from the aqueous phase, and breakdown of the SME could occur during the UC process, which would result in the redistribution of the drug molecules. Some of drug molecules in the O/W interface would go into aqueous phase, which was responsible for the finding that the EE of each formulation evaluated by UC was lower than those determined by the other two methods.
It was concluded that MD was not suitable for EE measurements of puerarin submicron oil droplet, which could only determine the total EE of submicron oil droplet and liposomes micelles, but it could be applied to determine the amount of free drug in SMEs. There was one drawback to the UC approach, the redistribution caused by breakdown of the SMEs. UF was still the relatively accurate method for the EE determination of puerarin SME because it could separate the liposomes micelles from the puerarin SME.
The In Vitro Release Study of Puerarin from the Submicron Emulsion
To measure drug release from colloidal delivery systems, it was necessary to dilute the dispersion and monitor subsequent release of drug from the particles into the surrounding free solution. This was often not recognized in studies where methods such as equilibrium dialysis were employed. Consequently, release was often dictated by membrane transport effects, making it difficult to reconcile the results obtained in terms of release of drug from the delivery system. Pressure UF was utilized as the principal method in this study because it allowed the colloidal dispersion to be diluted directly in the release medium and also provided a “snapshot” of drug distribution between the colloidal particles and free solution at the time of filtration (34). But because the puerarin emulsion contained small particle size liposomes micelles, the liposomes micelles might pass through the membrane into the filtrate under high-pressure condition. Additionally, the little release medium was lost in sampling. These might result in the increase of drug release in vitro of puerarin emulsion. In this study, we tried to apply the MD technology to study the release in vitro of puerarin because the MD technology has some advantages to overcome the drawback of pressure UF. The liposomes cannot pass though the dialysis membrane. MD sampling did not change the net fluid balance in the surrounding matrix, so higher temporal resolution could be achieved than with pressure UF techniques. Also, because there was no net release medium loss, samples could be collected continuously for minutes or hours (35). Due to the advantages of MD described above, the release in vitro of puerarin emulsion was studied by means of the MD and the pressure UF technology was used as a reference.
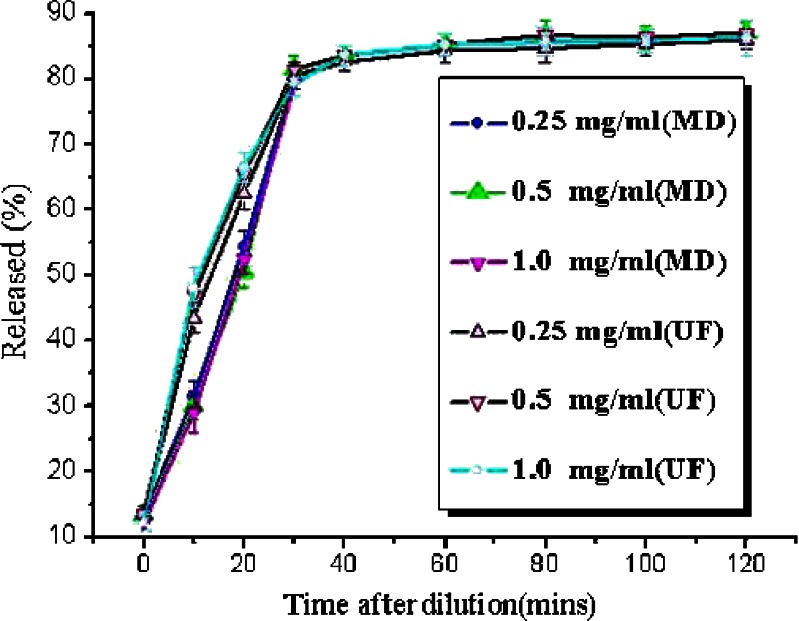
It was shown (Fig. 6) that the release of puerarin determined by MD was less (p < 0.05) at 10 and 20 min compared with those determined by pressure UF technology. After 30 min, the release is not significantly different (p > 0.05) by MD and UF technologies. It could be because of the following reasons: The liposomes of puerarin emulsion passed through the UF membrane into the filtrate under high pressure at 10 and 20 min. Provided that the same amount of liposomes passed through the membrane at every UF, then that the amount of drug in the liposomes was decreasing with time. Following that more drug in the liposomes would pass through the membrane at 10 min than at 20 min, so the difference between UF and MD should be greater at 10 min than at 20 min. However, the puerarin in emulsion had been mostly released into the release medium after 30 min. Then, the liposomes that passed through the filtration membrane into the filtrate did not have a significant effect on the release because the puerarin in the liposomes had been released mostly into the release medium.
Fig. 6.
Release of puerarin from a SME using the pressure UF method and MD at different levels of drug loading. Drug load in dispersions prior to dilution were 2.5, 5, and 10 mg/mL. Data was expressed as mean±SD(n = 3)
Drug release from puerarin SME at the three drug concentrations was initially rapid, but reached a plateau value within 30 min (Fig. 6). The extent of release in all cases was around 80%; full release was not attained because the release medium was not an infinite sink. Drug loading did not influence the plateau value for the extent of release, which indicated that the release in these experiments was under partition control and the results obtained using this method were not concentration-dependent. A possible reason for this could be that the water-soluble surfactants used to prepare the SME were providing some solubilization of the drug in the surrounding aqueous solution. This would lead to partitioning of the drug in favor of the aqueous phase at equilibrium. The short time taken to achieve 80% release under nonsink conditions justified the conclusion that these systems were a burst release vehicle and that, in sink conditions, the drug release would be even more rapid. Drug release from the SME has previously been reported to occur via burst release. For example, release of diazepam (36) and miconazole (35) from a SME, determined using pressure UF, was found to be very rapid when sufficient sink condition was utilized.
CONCLUSION
In this study, puerarin SME was prepared. Puerarin emulsion could be produced with a drug loading as high as 10 mg/mL. Three different approaches were employed to estimate the EE of puerarin SMEs. The results showed that MD was not suitable for EE measurements of puerarin SME, but it could be applied to determine the amount of free drug in SMEs. There was one drawback to UC approach, the redistribution caused by breakdown of the SMEs. To puerarin SMEs, the redistribution resulted in significantly lower EE obtained by UC compared with those obtained by MD and UF. UF was still the relatively accurate method for EE determination of SME. The in vitro release results showed that pressure UF was a useful method which allowed elucidation of the drug release mechanism from SME, as it provided an instantaneous “snapshot” of drug distribution between the particles and free solution. Compared with pressure UF technology, MD can be more suitable to determine the drug release of SME containing some small nanoparticles phase such as liposomes micelles. The in vitro release of puerarin from the SME was under partition control and occurred via burst release assayed by means of MD and pressure UF technology.
References
- 1.Kawakami S, Yamashita F, Hasida M. Disposition characteristics of emulsion and incorporated drugs after systemic or local injection. Adv Drug Deliv Rev. 2000;45:77–88. doi: 10.1016/S0169-409X(00)00102-2. [DOI] [PubMed] [Google Scholar]
- 2.Nasirideen S. Naproxen incorporated lipid emulsion fomulation and stability study. J Clin Pharm Ther. 1998;23:57–65. doi: 10.1046/j.1365-2710.1998.00139.x. [DOI] [PubMed] [Google Scholar]
- 3.Mizushima Y, Shoji Y, Kato T, Fukushima M, Kurozumi S. Use of lipid microspheres as a drug carrier for antitumour drugs. J Pharm Pharmacol. 1986;38:132–134. doi: 10.1111/j.2042-7158.1986.tb04527.x. [DOI] [PubMed] [Google Scholar]
- 4.Venkataram S, Awini WM, Jordan K, Rahman YE. Pharmacokinetics of two alternative dosage forms for cyclosporine: liposomes and intralipid. J Pharm Sci. 1990;79:216–219. doi: 10.1002/jps.2600790307. [DOI] [PubMed] [Google Scholar]
- 5.Forster D, Washington C, Davis SS. Toxicity of solubilized and colloidal amphotericin B formulations to human erythrocytes. J Pharm Pharmacol. 1988;40:325–328. doi: 10.1111/j.2042-7158.1988.tb05260.x. [DOI] [PubMed] [Google Scholar]
- 6.Fukui H, Koike T, Saheki A, Sonoke S, Seki J. A novel delivery system for amphotericin B with lipid nanosphere. Int J Pharm. 2003;265:37–45. doi: 10.1016/S0378-5173(03)00404-6. [DOI] [PubMed] [Google Scholar]
- 7.Dirk LT, Bradley D, Andersonb WJP. The distribution and chemical kinetics of prostaglandin E1 in lipid emulsions. Adv Drug Deliv Rev. 1996;20:155–164. doi: 10.1016/0169-409X(95)00118-Q. [DOI] [Google Scholar]
- 8.Menashe YL, Levy L, Shoshanna GS, Benita S. Side effect evaluation of a new diazepam formulation: venous sequela reduction following intravenous injection of a diazepam emulsion in rabbits. Pharm Res. 1989;6:510–516. doi: 10.1023/A:1015928825882. [DOI] [PubMed] [Google Scholar]
- 9.López-Pinto JM, González-Rodríguez ML, Rabasco AM. Effect of cholesterol and ethanol on dermal delivery from DPPC liposomes. Int J Pharm. 2005;298:1–12. doi: 10.1016/j.ijpharm.2005.02.021. [DOI] [PubMed] [Google Scholar]
- 10.Patel VB, Misra AN. Encapsulation and stability of clofazimine liposomes. J Microencapsul. 1999;16:357–367. doi: 10.1080/026520499289077. [DOI] [PubMed] [Google Scholar]
- 11.Patlolla RR, Vobalaboina V. Pharmacokinetics and tissue distribution of etoposide delivered in parenteral emulsion. J Pharm Sci. 2005;94:437–445. doi: 10.1002/jps.20249. [DOI] [PubMed] [Google Scholar]
- 12.Cui FD, Shi K, Zhang L, Tao AJ, Kawashima YJ. Biodegradable nanoparticles loaded with insulin–phospholipid complex for oral delivery: preparation, in vitro characterization and in vivo evaluation. J Control Release. 2006;114:242–250. doi: 10.1016/j.jconrel.2006.05.013. [DOI] [PubMed] [Google Scholar]
- 13.Wang T, Deng YJ, Geng YH, Gao ZB, Zou JP, Wang ZX. Progress of study on niosomes. Biochim Biophys Acta. 2006;1758:222–231. doi: 10.1016/j.bbamem.2006.01.023. [DOI] [PubMed] [Google Scholar]
- 14.Michalowski CB, Guterres SS, Dalla Costa T. Microdialysis for evaluating the entrapment and release of a lipophilic drug from nanoparticles. J Pharm Biomed Anal. 2004;35:1093–1100. doi: 10.1016/j.jpba.2004.04.002. [DOI] [PubMed] [Google Scholar]
- 15.Han J, Washington C. Partition of antimicrobial additives in an intravenous emulsion and their effect on emulsion physical stability. Int J Pharm. 2005;288:263–271. doi: 10.1016/j.ijpharm.2004.10.002. [DOI] [PubMed] [Google Scholar]
- 16.Liu Q, Lu Z, Wang L. Restrictive effect of puerarin on myocardial infarct area in dogs and its possible mechanism. J Tongji Med Univ. 2000;20:43–45. doi: 10.1007/BF02887673. [DOI] [PubMed] [Google Scholar]
- 17.Guerra MC, Speroni E, Broccoli M, et al. Comparison between Chinese medical herb Pueraria lobata crude extract and its main isoflavone puerarin: antioxidant properties and effects on rat liver CYP-catalysed drug metabolism. Life Sci. 2000;67:2997–3006. doi: 10.1016/S0024-3205(00)00885-7. [DOI] [PubMed] [Google Scholar]
- 18.Lu XR, Gao E, Xu LZ, Li HZ, Kang B, Chen WN, Chen SM, Chai XS. Puerarin beta-adrenergic receptor blocking effect. Chin Med J. 1987;100:25–28. [PubMed] [Google Scholar]
- 19.Liao HB, He ZF, Wang GC, Li HJ, Yue CJ, Chen XF. Research progress about Radix puerariae. Sci Technol Food Ind. 2003;24:81–82. [Google Scholar]
- 20.Fan LL, Sun LH. The protective effect of puerarin against myocardial reperfusion injury. Chin Med J. 1992;105:7–11. [PubMed] [Google Scholar]
- 21.Xuan B, Zhou YH, Yang RL. Improvement of ocular blood flow and retinal functions with puerarin analogs. J Ocul Pharmacol Ther. 1999;15:207–216. doi: 10.1089/jop.1999.15.207. [DOI] [PubMed] [Google Scholar]
- 22.Zhang LN, Shi HQ. Analysis on 60 cases of pueraria injection adverse reactions. Chinese Journal of Drug Application and Monitoring. 2004;3:1672–1673. [Google Scholar]
- 23.Yue PF, Yang HL, Yang M, Zhu WF, Cai PL, Xiao XH. The study to reduce the hemolysis side effect of puerarin by a submicron emulsion delivery system. Biol Pharmaceut Bull. 2008;31:45–50. doi: 10.1248/bpb.31.45. [DOI] [PubMed] [Google Scholar]
- 24.Zhang Y. Studies on physicochemical of crystal fiavonoids by polymorphism of puerarin. Hefei University of Technology Dissertation. 2003;72:43–45. doi: 10.1007/BF02838456. [DOI] [Google Scholar]
- 25.Lu B, Wu W. Optimization of preparation of dexamethasone acetate-loaded poly(d,l-lactide) microspheres by central composite design. Acta Pharmaceutica Sinica. 1999;34:387–391. [Google Scholar]
- 26.Hansen DK, Davies MI, Lunte SM, Lunte CE. Pharmacokinetic and metabolism studies using microdialysis sampling. J Pharm Sci. 1999;88:14–27. doi: 10.1021/js9801485. [DOI] [PMC free article] [PubMed] [Google Scholar]
- 27.Li Y, Pan WS, Chen SL, Yang DJ, et al. Studies on preparation of puerarin phytosomes and their solid dispersion. Chinese Pharmaceutical Journal. 2006;41:1162–1167. [Google Scholar]
- 28.Chambrier C, Guriraud M, Gibault JP. Medium and long-chain triacglycerols in postoperatice patients: structured lipid versus a physical mixture. Nutrition. 1999;15:274–277. doi: 10.1016/S0899-9007(99)00006-4. [DOI] [PubMed] [Google Scholar]
- 29.Wang LX, He HB, Tang X, Shao RY, Chen DW. A less irritant norcantharidin lipid microspheres: formulation and drug distribution. Int J Pharm. 2006;323:161–167. doi: 10.1016/j.ijpharm.2006.05.060. [DOI] [PubMed] [Google Scholar]
- 30.Groves MJ, Wineberg M, Brain APR. The presence of liposomal material in phosphatide stabilized emulsions. J Dispers Sci Technol. 1985;2:237–243. doi: 10.1080/01932698508943947. [DOI] [Google Scholar]
- 31.Uchegbu IF, Vyas SP. Non-ionic surfactant based vesicles (niosomes) in drug delivery. Int J Pharm. 1998;172:33–70. doi: 10.1016/S0378-5173(98)00169-0. [DOI] [Google Scholar]
- 32.Férézou J, Lai NT, Leray C, Hajri T, Frey A, Cabaret Y, Courtieu J. Lipid composition and structure of commercial parenteral emulsions. Biochim Biophys Acta. 1994;1213:149–158. doi: 10.1016/0005-2760(94)90021-3. [DOI] [PubMed] [Google Scholar]
- 33.Bach A, Férézou J, Frey A. Phospholipid-rich particles in commercial parenteral fat emulsions. Prog Lipid Res. 1996;35:133–153. doi: 10.1016/0163-7827(96)00001-X. [DOI] [PubMed] [Google Scholar]
- 34.Herrera AM, Scott DO, Lunte CE. Microdialysis sampling for determination of plasma protein binding of drugs. Pharm Res. 1990;7:1077–1081. doi: 10.1023/A:1015955503708. [DOI] [PubMed] [Google Scholar]
- 35.Magenheim B, Levy MY, Benita S. A new in vitro technique for the evaluation of drug release profile from colloidal carriers by ultrafiltration technique at low pressure. Int J Pharm. 1993;94:115–123. doi: 10.1016/0378-5173(93)90015-8. [DOI] [Google Scholar]
- 36.Benita S, Levy MY. Submicron emulsions as colloidal drug carriers for intravenous administration: comprehensive physicochemical characterization. J Pharm Sci. 1993;82:1069–1079. doi: 10.1002/jps.2600821102. [DOI] [PubMed] [Google Scholar]


