Abstract
Near-infrared (NIR) spectroscopic analysis of noncrystalline polyols and saccharides (e.g., glycerol, sorbitol, maltitol, glucose, sucrose, maltose) was performed at different temperatures (30–80°C) to elucidate the effect of glass transition on molecular interaction. Transmission NIR spectra (4,000–12,000 cm−1) of the liquids and cooled-melt amorphous solids showed broad absorption bands that indicate random configuration of molecules. Heating of the samples decreased an intermolecular hydrogen-bonding OH vibration band intensity (6,200–6,500 cm−1) with a concomitant increase in a free and intramolecular hydrogen-bonding OH group band (6,600–7,100 cm−1). Large reduction of the intermolecular hydrogen-bonding band intensity at temperatures above the glass transition (Tg) of the individual solids should explain the higher molecular mobility and lower viscosity in the rubber state. Mixing of the polyols with a high Tg saccharide (maltose) or an inorganic salt (sodium tetraborate) shifted both the glass transition and the inflection point of the hydrogen-bonding band intensity to higher temperatures. The implications of these results for pharmaceutical formulation design and process monitoring (PAT) are discussed.
Keywords: amorphous, glass transition, hydrogen-bonding, NIR, PAT
INTRODUCTION
The development of amorphous solid pharmaceutical formulations requires thorough characterization of physical properties (1–4). Optimizing the molecular mobility and the system viscosity, which both change significantly at glass transition temperature (Tg), is essential to ensure their unique functional characters (e.g., faster dissolution of active ingredients, stabilization of lyophilized protein conformation) and storage stability of these solids. Understanding how the molecular interactions, particularly hydrogen-bonding, in amorphous carbohydrate solids affect their physical properties is relevant to the formulation design and process control (5).
Near-infrared (NIR) spectroscopy is an advancing analytical method that provides varied information on the chemical and physical properties of pharmaceutical formulations including molecular structure, crystallinity (6–8), crystal polymorphs (9,10), residual water content (11), component miscibility (12), protein secondary structure (13), and molecular interactions (14–17). Relatively low absorbance that enables diffuse-reflection measurement and recent advances in chemometrics (e.g., principal component analysis [PCA], partial least-squares calibration [PLS]) make the NIR spectroscopy a powerful nondestructive process analytical tool for quality control (PAT) (18). The applicability of vacuum-sealed samples in glass vials should be an apparent advantage of NIR in the analysis of physically unstable amorphous solids. Proper use of NIR spectroscopy, combined with other sophisticated in-, on-, and at-line analytical tools (e.g., mid-infrared, far-infrared, terahertz, and Raman spectroscopy; thermal analysis), should improve the product and process understanding required for better formulation quality (16,19,20).
The purpose of this study was to characterize hydrogen-bonding profiles in rubber- and glass-state amorphous solids by NIR spectroscopy. The random configuration of molecules and the accompanying wide variation of molecular interactions in amorphous polyol and saccharide solids provide broad absorption bands in the NIR spectra (6,7). Some of the broad bands (e.g., OH stretching vibration) indicate different hydrogen-bonding states (e.g., intermolecular, intramolecular, free) in the solids (21,22). The profiles of the hydrogen-bonding in water and some alcohol liquids depend largely on temperature (23–25). Recent mid-infrared studies on the amorphous saccharide films indicate different temperature-dependent shifts of OH stretching (3,300–3,400 cm−1) and bending (1,000–1,100 cm−1) vibration band peaks between their glass (below Tg) and rubber (above Tg) states (26,27). It is plausible that NIR spectroscopy provides valuable information on the molecular interactions and physical properties of various noncrystalline samples (e.g., liquid, rubber-state solid, glass-state solid).
MATERIALS AND METHODS
Materials
All chemicals employed in this study were of analytical grades and were obtained from the following commercial sources: glycerol and sorbitol (Wako Pure Chemical, Osaka, Japan); maltose monohydrate, sucrose, and sodium tetraborate (Sigma Chemical, St. Louis, MO, USA); deuterium water (Acros Organics, Geel, Belgium); maltitol and maltotriitol (Hayashibara Biochemical Laboratories, Okayama, Japan).
Preparation of Freeze-Dried Amorphous Solids
Freeze-dried solids were prepared by lyophilizing aqueous polyol and saccharides solutions (100 mg/mL, 2 mL) in flat-bottom borosilicate glass vials (21 mm diameter; SVF-10, Nichiden-rika Glass, Kobe, Japan) using a Freezevac-1C freeze-drier (Tozai Tsusho, Tokyo, Japan). The sample solutions frozen by immersion in liquid nitrogen were dried under vacuum without temperature control for 16 h and then maintained on the shelf at 35°C for 8 h. Hydrogen/deuterium-exchanged glycerol, sorbitol, and glucose were obtained by freeze-drying the solutions in D2O twice (200 mg/mL).
Preparation of Cooled-Melt Amorphous Solids
The cooled-melt solids subjected to thermal and NIR analysis were obtained by melting the crystalline powder in a quartz cuvette (1-mm light path length; Starna Optiglass, Hainault, UK) or small borosilicate glass tubes (approximately 4 mm internal diameter; TGK, Tokyo, Japan) in a drying oven (DP23, Yamato Scientific, Tokyo, Japan) at 200°C (sucrose) or 180°C (other saccharides) under vacuum for 20 min, then cooled at room temperature. Amorphous maltose solids were prepared from the monohydrate crystal with (dehydrated) or without (partially hydrated) vacuum-drying. The cooled-melt solids without apparent crack or bubbles were subjected to the following transmission NIR analysis.
Thermal Analysis
A differential scanning calorimeter (DSC Q-10, TA Instruments, New Castle, DE, USA) and software (Universal Analysis 2000, TA Instruments) were used to obtain the thermal properties of the amorphous solids. Solids (2–5 mg) in hermetic aluminum cells were scanned from −30°C at 5°C/min under N2 gas flow. Glass transition temperatures were determined from the maximum inflection point of the discontinuities in the heat flow curves.
NIR Spectroscopy
NIR analysis was performed using a FT-NIR system (MPA, Bruker Optik, Germany) equipped with a sample temperature controller and OPUS software. Transmission NIR spectra of liquids and cooled-melt amorphous solids were obtained from 30°C to 80°C at every 5°C with 5-min intervals between the measurements. Absorbance in the 12,000 to 4,000 cm−1 range was obtained with a 2-cm−1 resolution in 128 scans. The absorbance of air was subtracted as background. The NIR spectra were baseline-corrected in the 8,000–9,000 cm−1 range and smoothed at 25 points. The possible effect of a temperature-induced solid volume change was not compensated in this study. Diffuse-reflection NIR spectra of crystal powders and freeze-dried solids in cylindrical borosilicate glass vials were obtained from the bottom of the container at room temperature.
RESULTS
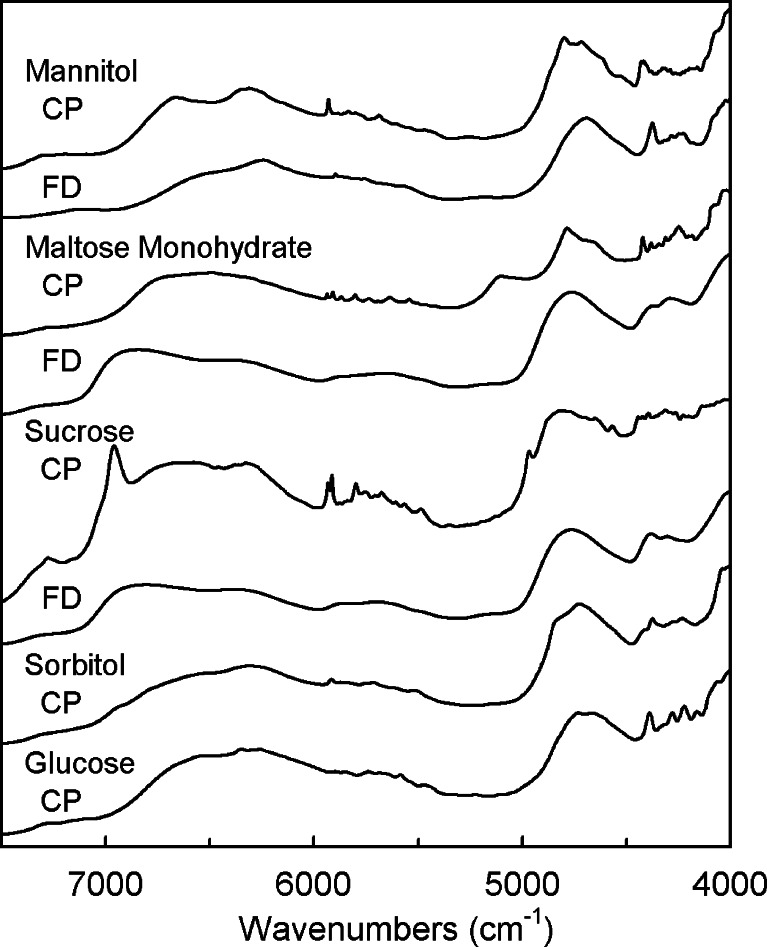
Figure 1 shows the diffuse-reflection NIR spectra of mannitol, maltose monohydrate, sucrose, glucose, and sorbitol in different physical states (crystalline powder, freeze-dried solid) obtained noninvasively from the bottoms of the glass vials. The crystalline powders showed several unique sharp bands of OH and CH vibrations in the overtone (5,000–7,500 cm−1) and combination (4,000–5,000 cm−1) spectral regions. The absorbance of water in the maltose monohydrate crystal (around 5,150 cm−1) disappeared by lyophilization. Freeze-dried amorphous sucrose and maltose solids showed broad absorption bands that indicate diversified interactions between the spatially less-ordered molecules. Contrarily, some sharp peaks (e.g., 4,375 cm−1) indicated partial crystallinity of the freeze-dried mannitol (4,28). Thermal analysis of the freeze-dried solids also indicated different component crystallinity (data not shown). Freeze-drying of glucose and sorbitol resulted in collapsed solids, which spectra varied largely between the vials (data not shown). Amorphous saccharide solids prepared by cooling the heat-melt also showed varied diffuse-reflection NIR spectra.
Fig. 1.
Diffuse-reflection NIR spectra of crystalline powder (CP) and freeze-dried solid (FD) containing sugars and sugar alcohols obtained at the bottoms of glass vials
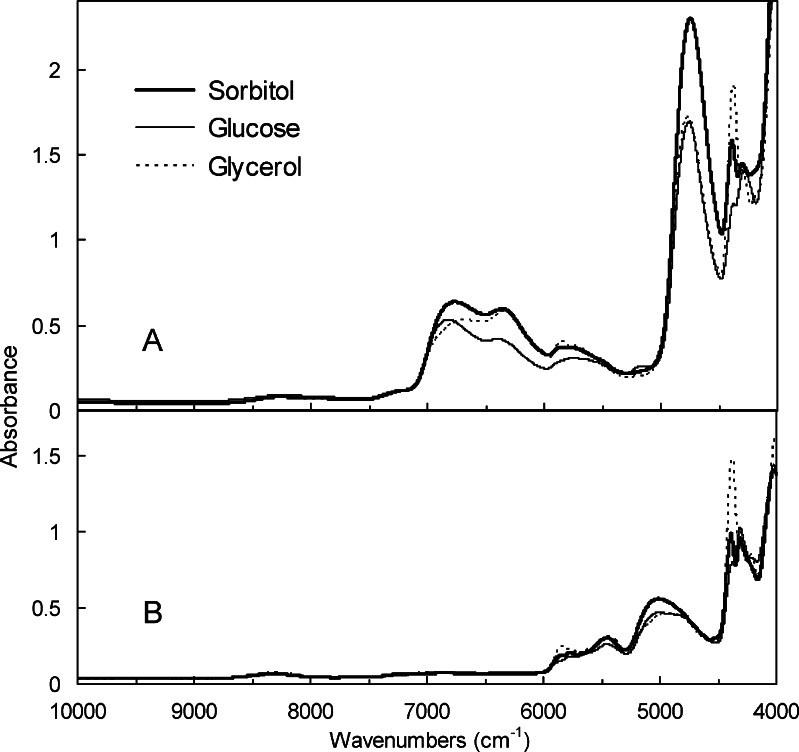
Transmission NIR analysis of cooled-melt amorphous solids (e.g., sorbitol, glucose) and a liquid (glycerol) in a quartz cell (1-mm light path length, 30°C) showed similar spectra with some broad bands (Fig. 2A). The large bands in the overtone spectral region represent OH stretching vibration first overtones of intermolecular hydrogen-bonding groups (6,200–6,500 cm−1) and intramolecular or nonhydrogen-bonding groups (6,600–7,100 cm−1) (21,22,25). The addition of H2O (2–10%, w/w) to glycerol increased the absorbance at around 4,110, 5,152, and 6,925 cm−1 in the NIR spectra (data not shown). Hydrogen/deuterium-exchanged samples showed a large band that suggested an OD stretching vibration at around 5,000 cm−1 (Fig. 2B) (23). Lower absorbance of the hydrogen/deuterium-exchanged amorphous solids at 6,000–7,100 cm−1 confirmed the significance of the OH stretching vibration band in the spectral region. Thermal analysis showed that the cooled-melt sorbitol (Tg = −1.2°C) and glucose (Tg = 45.8°C) are in the rubber and glass states, respectively, at 30°C.
Fig. 2.
Transmission NIR spectra of liquid (glycerol) and cooled-melt solids (sorbitol, glucose) in a quartz cell (1-mm light path length) prepared with A without and B with hydrogen/deuterium exchange (30°C)
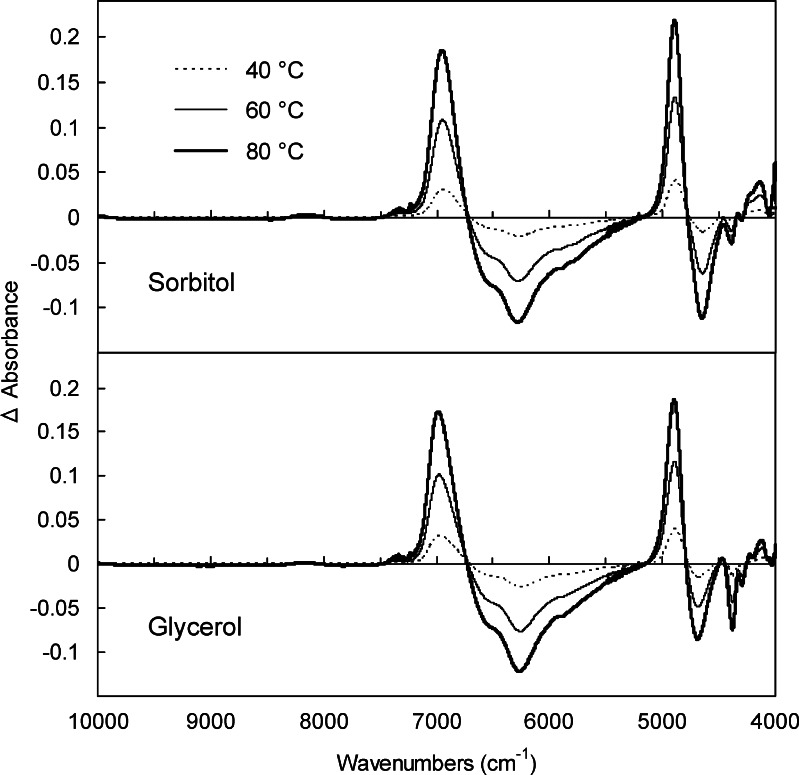
The effect of heating on the transmission NIR spectra of the noncrystalline sorbitol and glycerol are shown as the difference spectra (Fig. 3). The changes indicated the shift of the major bands at 6,000–7,000 cm−1 (OH stretching vibration first overtone) and at around 4,750 cm−1 (OH stretching/bending combination) in the original spectra to higher wave numbers at the elevated temperatures (40°C, 60°C, and 80°C). The apparent decrease in the absorbance at 6,000–6,500 cm−1 and the concomitant absorbance increase at 6,700–7,100 cm−1 suggested heat-induced changes in the hydrogen-bonding profiles of the OH groups from intermolecular to intramolecular or free bonds.
Fig. 3.
Effect of heating on the transmission NIR spectra of glycerol liquid and cooled-melt sorbitol solid (1-mm light path length). Difference spectra were obtained by subtracting the absorbance of the samples at 30°C
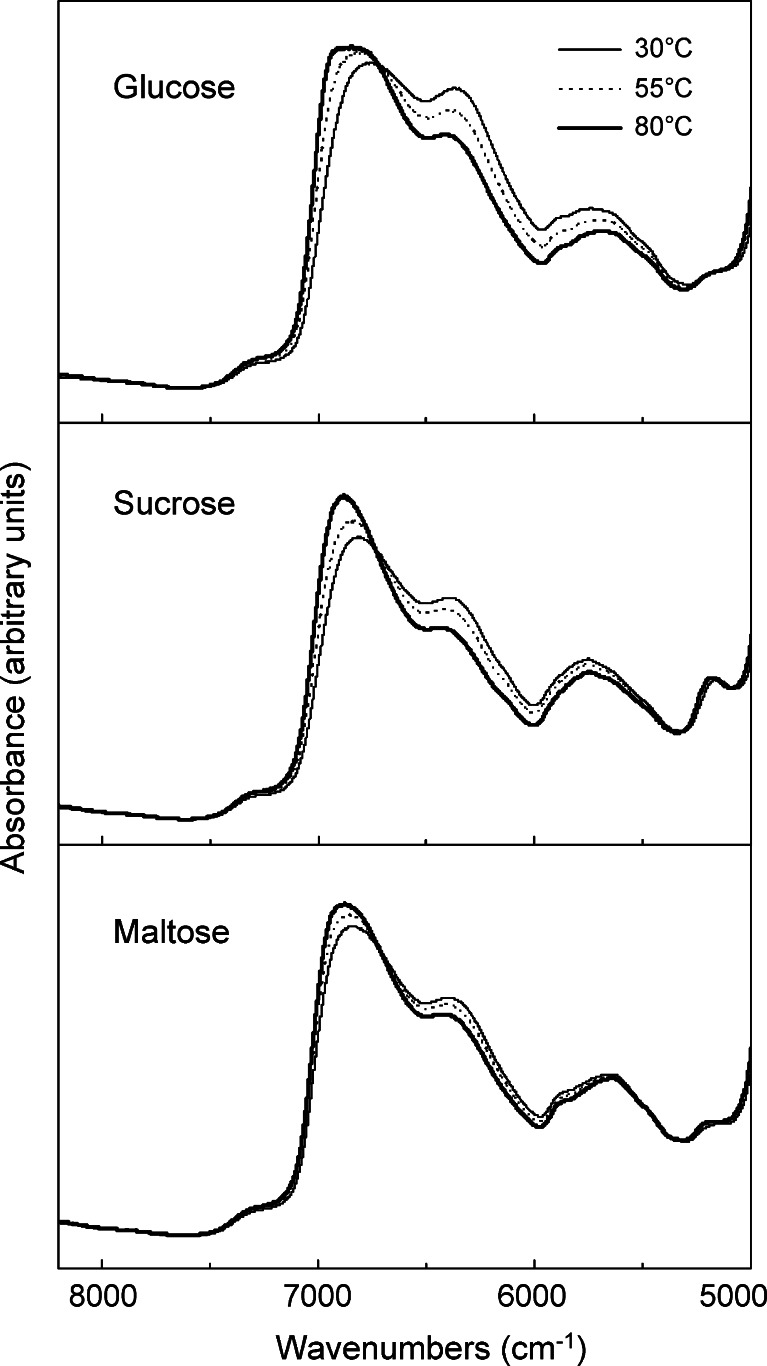
Transmission NIR spectra (overtone region) of cooled-melt glucose, sucrose, and maltose (dehydrated) obtained at different temperatures (30°C, 55°C, and 80°C) suggested varied heat-induced changes in the hydrogen-bonding band intensity (Fig. 4). The larger spectral change observed in the lower glass transition temperature solids (glucose = 45.8°C) suggested the contribution of the different hydrogen-bonding profiles to the physical properties. The solids were prepared in small glass tubes (approximately 4 mm internal diameter) to prevent crack formation in the cooling process. The browning of sucrose during the preparation indicated its partial degradation at high temperatures. A small absorption band at 5,150 cm−1 suggested residual water in the amorphous saccharide solids. Relatively large absorbance at the 6,200- to 6,500-cm−1 region in the amorphous glucose solid suggested a larger contribution of the intermolecular hydrogen-bonding compared to those in other saccharides. Different dehydration process and accompanying changes in the molecular interactions should explain the partially different spectra of the cooled-melt glucose solid prepared in the quartz optical cell (Fig. 2) and the glass tube (Fig. 4).
Fig. 4.
Transmission NIR spectra of cooled-melt amorphous glucose, sucrose, and maltose (dehydrated) solids in glass tubes (approximately 4 mm interior diameter) obtained at 30°C, 55°C, and 80°C
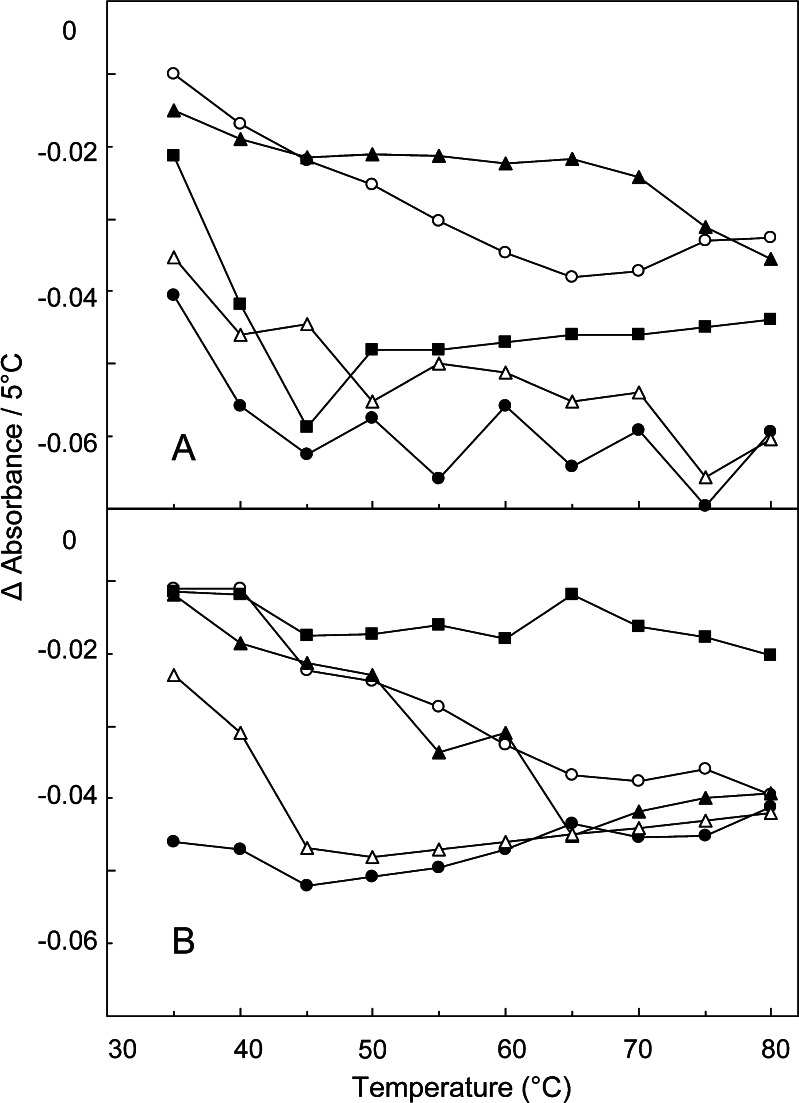
The relationship between the hydrogen-bonding profiles and the physical states of the amorphous solids were further studied. Thermal analysis showed varied glass transition temperatures of the cooled-melt amorphous polyol and saccharide solids (Table I). The changes in the absorbance of the intermolecular hydrogen-bonding OH band peak (6,200–6,500 cm−1) obtained every 5°C were plotted in Fig. 5. The spectral region was chosen for comparison because of the smaller overlapping absorbance of residual water compared to that in the intramolecular hydrogen-bonding band region (6,600–7,100 cm−1) (11). The noncrystalline samples showed three types of intermolecular hydrogen-bonding band intensity changes depending on their glass transition temperatures. A rubber-state solid (sorbitol, Tg = −1.2°C) and glycerol liquid showed relatively large (<0.04 U/5°C) band intensity drops from the lowest measurement temperature. Contrarily, amorphous dehydrated maltose that remained in the glass state throughout the measurement temperature range (80°C < Tg) showed a much smaller band intensity change. Other solids (e.g., glucose, sucrose, maltotriitol; 30°C < Tg <80°C) showed larger declines of the band intensity above their glass transition temperatures. Plotting of the band intensity against the temperature showed apparent inflection at the glass transition. Plateau of the plot above the Tg should indicate large and constant temperature-dependent reduction of the molecular interactions similar to that of molecular liquids.
Table I.
Glass Transition Temperature of Cooled-Melt Amorphous Solids
| Glass transition temperatures | |
|---|---|
| Maltose | 99.4 ± 1.2 |
| Maltotriitol | 79.5 ± 0.8 |
| Maltose (w/o vacuum-drying) | 62.6 ± 1.7 |
| Sucrose | 57.9 ± 3.2 |
| Maltitol | 49.3 ± 0.5 |
| Glucose | 45.8 ± 2.2 |
| Glycerol (liquid) | n.d. |
| Sorbitol | −1.2 ± 0.9 |
| Maltose+sorbitol 5:1a | 66.5 ± 1.9 |
| Maltose+sorbitol 3:1a | 48.6 ± 0.5 |
| Maltose+sorbitol 2:1a | 31.0 ± 0.3 |
| Maltitol+Na2B4O7 40:1b | 59.0 ± 2.1 |
| Maltitol+Na2B4O7 25:1b | 69.2 ± 1.7 |
Data are presented as mean±SD (n = 3)
aWeight ratio
bMolar ratio
Fig. 5.
Changes in the absorbance of intermolecular hydrogen-bonding OH vibration band obtained by transmission NIR scan of noncrystalline samples at 5°C intervals. Each point of the curves represents the mean of duplicated measurements. Each symbol denotes A glycerol (filled circles), sorbitol (open triangles), glucose (filled squares), sucrose (open circles), maltotriitol (filled triangles) and B maltose (filled squares), maltose hydrate (open circles), and maltose+sorbitol at the weight ratios of 2:1 (filled circles), 3:1 (open triangles), and 5:1 (filled triangles)
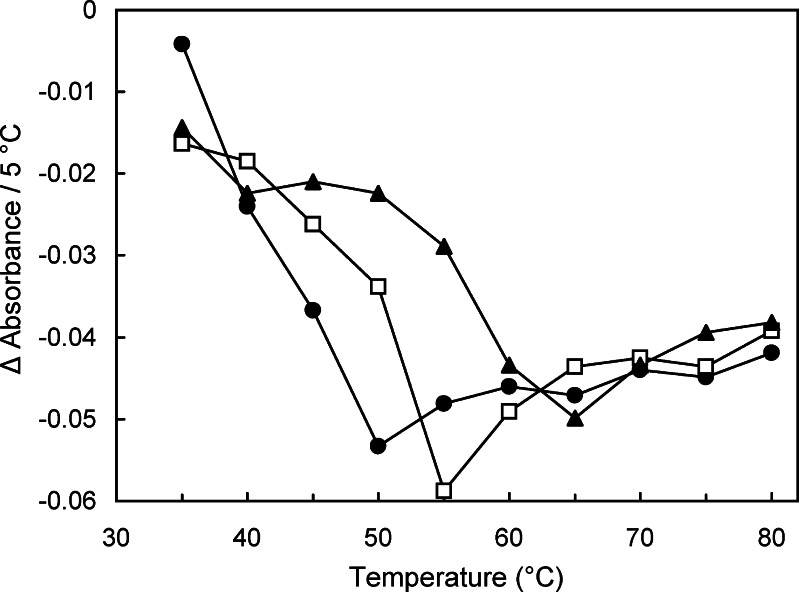
Some solids containing multiple components also showed larger heat-induced reduction of the intermolecular hydrogen-bonding band in the rubber state. The mixing of components (e.g., maltose and sorbitol) or higher residual water (e.g., cooled-melt maltose monohydrate prepared without vacuum-drying) shifts the glass transition temperature of the amorphous solids (Table I). These solids showed larger heat-induced intermolecular hydrogen-bonding band intensity reductions at above their glass transition temperatures (Fig. 5). Some inorganic salts (e.g., sodium phosphates, sodium citrates) affect the glass transition temperature of amorphous polyol and saccharide solids (29,30). The addition of a small amount of sodium tetraborate (Na2B4O7) significantly raised the Tg of cooled-melt maltitol solids (Table I), as well as the inflection temperature of the intermolecular hydrogen-bonding band intensity (Fig. 6) (31,32).
Fig. 6.
Effect of temperature on the intermolecular hydrogen-bonding OH vibration band absorbance of maltitol (filled circles) and its mixture with Na2B4O7 at the molar ratio of 40:1 (open squares) and 25:1 (filled triangles) obtained at 5°C intervals (n = 2)
DISCUSSION
The NIR study showed varied hydrogen-bonding states of OH groups in the noncrystalline polyol and saccharide solids that depended both on their temperatures and their physical states (glass and rubber). The heating-induced reduction of the intermolecular hydrogen bond was consistent with the literature on the NIR analysis of water, alcohol, and polyol liquids (25,33). The limited absorbance of hydrogen/deuterium-exchanged polyols (glucose, sorbitol) at above 6,000 cm−1 indicated the contribution of readily exchangeable OH groups to the temperature-dependent band intensity change. The appropriate sample temperature control and the constant light path length made the transmission NIR measurement suitable to study the relationship between the physical states and the molecular interactions. The general trends observed in the transmission mode should be basically applicable to other data detection modes (e.g., diffuse-reflection).
The glass transition of the amorphous solids did not directly affect the NIR spectra, but it altered the extent of the heat-induced hydrogen-bonding band intensity change. The result was in agreement with the different temperature-dependent changes in the mid-infrared OH stretching and bending band peak positions of saccharide films in the glass and rubber states (26,27). Loosening of the intermolecular hydrogen-bonding network should induce the higher molecular mobility and lower viscosity of the rubber-state amorphous solids. The rubber-state amorphous solids are, from another physical perspective, deeply supercooled liquids with extremely high viscosity. The similarity in physical states would explain the large constant heat-induced reduction of the intermolecular band intensity in the polyol liquids (e.g., glycerol) and the rubber-state solids. The smaller heat-induced spectral changes below the Tg would increase the mobility of molecules, leading to slow but not negligible temperature-dependent chemical degradation and/or ingredient crystallization in the long-term storage of the glass-state amorphous solids (34). Further assignment of the bands in the NIR spectra and mathematical data processing should increase the relevance of the analysis.
Information on the molecular interactions (e.g., hydrogen-bonding) that determine the physical properties should be relevant for the rational design of amorphous formulations. NIR spectroscopy should be used to characterize the molecular interactions in certain multicomponent amorphous systems containing the active pharmaceutical ingredients, excipients (e.g., stabilizer, pH modifier), and residual water. The availability of several detection modes that involve samples in glass containers without exposure to unfavorable environments (e.g., humid atmosphere) is a major advantage of NIR spectroscopy over other analytical methods for the characterization of the amorphous freeze-dried formulations (15). The proper choice of excipients that form and/or induce intermolecular hydrogen-bonding (e.g., disaccharides, sodium phosphate) should provide the storage stability and functional properties required for the amorphous formulations.
NIR spectroscopy is a powerful analytical tool for process monitoring and raw material inspection (18,20). Ensuring chemical and physical properties during the process is important to obtain reliable pharmaceutical formulations. Clinical functions and storage stabilities of the amorphous solid formulations depends not only on their glass transition temperatures (Tg) but also on other physical characters (e.g., residual crystallinity, structural relaxation) that are affected by process parameters (e.g., thermal history) (3). Several mathematical data processing methods, including PLS and PCA, have been used to obtain information on the chemical and physical properties of solids (e.g., crystallinity, collapse, residual water, chemical degradation) from the NIR spectra. The preparation of amorphous solids often includes low (e.g., freeze-drying) or high (e.g., melting, extrusion) temperature processes. Understanding the effect of temperature and physical states on the NIR spectra, as well as appropriate data compensation, should increase the relevance of the sophisticated analytical methods.
Acknowledgement
The present study was supported by the Japan Health Sciences Foundation (KH31029, KHB1006).
References
- 1.Cui Y. A material science perspective of pharmaceutical solids. Int J Pharm. 2007;339:3–18. doi: 10.1016/j.ijpharm.2007.04.021. [DOI] [PubMed] [Google Scholar]
- 2.Hancock BC, Zografi G. Characteristics and significance of the amorphous state in pharmaceutical systems. J Pharm Sci. 1997;86:1–12. doi: 10.1021/js9601896. [DOI] [PubMed] [Google Scholar]
- 3.Hilden LR, Morris KR. Physics of amorphous solids. J Pharm Sci. 2004;93:3–12. doi: 10.1002/jps.10489. [DOI] [PubMed] [Google Scholar]
- 4.Nail SL, Jiang S, Chongprasert S, Knopp SA. Fundamentals of freeze-drying. Pharm Biotechnol. 2002;14:281–360. doi: 10.1007/978-1-4615-0549-5_6. [DOI] [PubMed] [Google Scholar]
- 5.Tang XC, Pikal MJ, Taylor LS. The effect of temperature on hydrogen bonding in crystalline and amorphous phases in dihydropyrine calcium channel blockers. Pharm Res. 2002;19:484–90. doi: 10.1023/A:1015199713635. [DOI] [PubMed] [Google Scholar]
- 6.Yonemochi E, Inoue Y, Buckton G, Moffat A, Oguchi T, Yamamoto K. Differences in crystallization behavior between quenched and ground amorphous ursodeoxycholic acid. Pharm Res. 1999;16:835–40. doi: 10.1023/A:1018817801444. [DOI] [PubMed] [Google Scholar]
- 7.Hogan SE, Buckton G. The application of near infrared spectroscopy and dynamic vapor sorption to quantify low amorphous contents of crystalline lactose. Pharm Res. 2001;18:112–6. doi: 10.1023/A:1011091113734. [DOI] [PubMed] [Google Scholar]
- 8.Seyer JJ, Luner PE, Kemper MS. Application of diffuse reflectance near-infrared spectroscopy for determination of crystallinity. J Pharm Sci. 2000;89:1305–16. doi: 10.1002/1520-6017(200010)89:10<1305::AID-JPS8>3.0.CO;2-Q. [DOI] [PubMed] [Google Scholar]
- 9.Otsuka M, Kato F, Matsuda Y. Comparative evaluation of the degree of indomethacin crystallinity by chemoinfometrical Fourier-transformed near-infrared spectroscopy and conventional powder X-ray diffractometry. AAPS PharmSci. 2000;2:E9. doi: 10.1208/ps020109. [DOI] [PMC free article] [PubMed] [Google Scholar]
- 10.Tudor AM, Church SJ, Hendra PJ, Davies MC, Melia CD. The qualitative and quantitative analysis of chlorpropamide polymorphic mixtures by near-infrared Fourier transform Raman spectroscopy. Pharm Res. 1993;10:1772–6. doi: 10.1023/A:1018934417124. [DOI] [PubMed] [Google Scholar]
- 11.Stein HH, Ambrose JM. Near-infrared method for determination of water in aluminum aspirin. Anal Chem. 1963;35:550–2. doi: 10.1021/ac60197a003. [DOI] [Google Scholar]
- 12.Jovanovi N, Gerich A, Bouchard A, Jiskoot W. Near-infrared imaging for studying homogeneity of protein–sugar mixtures. Pharm Res. 2006;23:2002–13. doi: 10.1007/s11095-006-9037-y. [DOI] [PubMed] [Google Scholar]
- 13.Bai S, Nayar R, Carpenter JF, Manning MC. Noninvasive determination of protein conformation in the solid state using near infrared (NIR) spectroscopy. J Pharm Sci. 2005;94:2030–8. doi: 10.1002/jps.20416. [DOI] [PubMed] [Google Scholar]
- 14.Izutsu K, Fujimaki Y, Kuwabra A, Aoyagi N. Effect of counterions on the physical properties of L-arginine in frozen solutions and freeze-dried solids. Int J Pharm. 2005;301:161–9. doi: 10.1016/j.ijpharm.2005.05.019. [DOI] [PubMed] [Google Scholar]
- 15.Liu J. Physical characterization of pharmaceutical formulations in frozen and freeze-dried solid states: techniques and applications in freeze-drying development. Pharm Dev Technol. 2006;11:3–28. doi: 10.1080/10837450500463729. [DOI] [PubMed] [Google Scholar]
- 16.Räsänen E, Sandler N. Near infrared spectroscopy in the development of solid dosage forms. J Pharm Pharmacol. 2007;59:147–59. doi: 10.1211/jpp.59.2.0002. [DOI] [PubMed] [Google Scholar]
- 17.Reich G. Near-infrared spectroscopy and imaging: basic principles and pharmaceutical applications. Adv Drug Deliv Rev. 2005;57:1109–43. doi: 10.1016/j.addr.2005.01.020. [DOI] [PubMed] [Google Scholar]
- 18.Fevotte G, Calas J, Puel F, Hoff C. Applications of NIR spectroscopy to monitoring and analyzing the solid state during industrial crystallization processes. Int J Pharm. 2004;273:159–69. doi: 10.1016/j.ijpharm.2004.01.003. [DOI] [PubMed] [Google Scholar]
- 19.FDA. Guidance for industry: PAT—a framework for innovative pharmaceutical development, manufacturing and quality assurance. http://www.fda.gov/cder/guidance/6419fnl.htm (2004)
- 20.De Beer TR, Allesø M, Goethals F, Coppens A, Heyden YV, De Diego HL, et al. Implementation of a process analytical technology system in a freeze-drying process using Raman spectroscopy for in-line process monitoring. Anal Chem. 2007;79:7992–8003. doi: 10.1021/ac070549h. [DOI] [PubMed] [Google Scholar]
- 21.Ozaki Y, Kawata S. Near-infrared spectroscopy. Tokyo: Japan Scientific Societies Press; 1996. [Google Scholar]
- 22.Shenk JS, Workman JJ, Jr., Westerhaus MO. Application of NIR spectroscopy to agricultural products. In: Burns DA, Ciurczak WW, editors. Handbook of near-infrared analysis. New York: Taylor & Francis; 2001. pp. 419–74. [Google Scholar]
- 23.Czarnecki MA, Czarnik-Matusewicz B, Ozaki Y, Iwahashi M. Resolution enhancement and band assignments for the first overtone of OH(D) stretching modes of butanols by two-dimensional near-infrared correlation spectroscopy. 3. Thermal dynamics of hydrogen bonding in butan-1-(ol-d) and 2-methylpropan-2-(ol-d) in the pure liquid states. J Phys Chem A. 2000;104:4906–11. doi: 10.1021/jp991753e. [DOI] [Google Scholar]
- 24.Czarnecki MA, Ozaki Y. The temperature-induced changes in hydrogen bonding of decan-1-ol in the pure liquid phase studied by two-dimensional Fourier transform near-infrared correlation spectroscopy. Phys Chem Chem Phys. 1999;1:797–800. doi: 10.1039/a808699k. [DOI] [Google Scholar]
- 25.Maeda H, Ozaki Y. Near infrared spectroscopy and chemometrics studies of temperature-dependent spectral variations of water: relationship between spectral changes and hydrogen bonds. J Near Infrared Spectrosc. 1995;3:191–201. doi: 10.1255/jnirs.69. [DOI] [Google Scholar]
- 26.Wolkers WF, Oldenhof H, Alberda M, Hoekstra FA. A Fourier transform infrared microspectroscopy study of sugar glasses: application to anhydrobiotic higher plant cells. Biochim Biophys Acta. 1998;1379:83–96. doi: 10.1016/s0304-4165(97)00085-8. [DOI] [PubMed] [Google Scholar]
- 27.Wolkers WF, Oliver AE, Tablin F, Crowe JH. A Fourier-transform infrared spectroscopy study of sugar glasses. Carbohydr Res. 2004;339:1077–85. doi: 10.1016/j.carres.2004.01.016. [DOI] [PubMed] [Google Scholar]
- 28.Cao W, Mao C, Chen W, Lin H, Krishnan S, Cauchon N. Differentiation and quantitative determination of surface and hydrate water in lyophilized mannitol using NIR spectroscopy. J Pharm Sci. 2006;95:2077–86. doi: 10.1002/jps.20706. [DOI] [PubMed] [Google Scholar]
- 29.Ohtake S, Schebor C, Palecek SP, Pablo JJD. Effect of pH, counter ion, and phosphate concentration on the glass transition temperature of freeze-dried sugar–phosphate mixtures. Pharm Res. 2004;21:1615–21. doi: 10.1023/B:PHAM.0000041456.19377.87. [DOI] [PubMed] [Google Scholar]
- 30.Kets EP, IJpelaar PJ, Hoekstra FA, Vromans H. Citrate increases glass transition temperature of vitrified sucrose preparations. Cryobiology. 2004;48:46–54. doi: 10.1016/j.cryobiol.2003.12.002. [DOI] [PubMed] [Google Scholar]
- 31.Miller DP, Anderson RE, de Pablo JJ. Stabilization of lactate dehydrogenase following freeze thawing and vacuum-drying in the presence of trehalose and borate. Pharm Res. 1998;15:1215–21. doi: 10.1023/A:1011987707515. [DOI] [PubMed] [Google Scholar]
- 32.Izutsu K, Yomota C, Aoyagi N. Inhibition of mannitol crystallization in frozen solutions by sodium phosphates and citrates. Chem Pharm Bull. 2007;55:565–70. doi: 10.1248/cpb.55.565. [DOI] [PubMed] [Google Scholar]
- 33.Watanabe A, Morita S, Ozaki Y. Temperature-dependent structural changes in hydrogen bonds in microcrystalline cellulose studied by infrared and near-infrared spectroscopy with perturbation-correlation moving-window two-dimensional correlation analysis. Appl Spectrosc. 2006;60:611–8. doi: 10.1366/000370206777670549. [DOI] [PubMed] [Google Scholar]
- 34.Yoshioka M, Hancock BC, Zografi G. Crystallization of indomethacin from the amorphous state below and above its glass transition temperature. J Pharm Sci. 1994;83:1700–5. doi: 10.1002/jps.2600831211. [DOI] [PubMed] [Google Scholar]


