Abstract
Background:
Neuroimaging measures have potential as surrogate markers of disease through identification of consistent features that occur prior to clinical symptoms. Despite numerous investigations, especially in relation to the transition to clinical impairment, the regional pattern of brain changes in clinically normal older adults has not been established. We predict that the regions that show early pathologic changes in association with Alzheimer disease will show accelerated volume loss in mild cognitive impairment (MCI) compared to normal aging.
Methods:
Through the Baltimore Longitudinal Study of Aging, we prospectively evaluated 138 nondemented individuals (age 64–86 years) annually for up to 10 consecutive years. Eighteen participants were diagnosed with MCI over the course of the study. Mixed-effects regression was used to compare regional brain volume trajectories of clinically normal individuals to those with MCI based on a total of 1,017 observations.
Results:
All investigated volumes declined with normal aging (p < 0.05). Accelerated change with age was observed for ventricular CSF (vCSF), frontal gray matter, superior, middle, and medial frontal, and superior parietal regions (p ≤ 0.04). The MCI group showed accelerated changes compared to normal controls in whole brain volume, vCSF, temporal gray matter, and orbitofrontal and temporal association cortices, including the hippocampus (p ≤ 0.04).
Conclusion:
Although age-related regional volume loss is apparent and widespread in nondemented individuals, mild cognitive impairment is associated with a unique pattern of structural vulnerability reflected in differential volume loss in specific regions. Early identification of patterns of abnormality is of fundamental importance for detecting disease onset and tracking progression.
GLOSSARY
- AD
= Alzheimer disease;
- BIMC
= Blessed Information Memory Concentration Scale;
- BLSA
= Baltimore Longitudinal Study of Aging;
- GM
= gray matter;
- ICV
= intracranial volume;
- MCI
= mild cognitive impairment;
- MMSE
= Mini-Mental State Examination;
- vCSF
= ventricular CSF;
- WM
= white matter.
MRI-based volume measurements have been proposed as potential surrogate markers for disease diagnosis or progression and may be particularly useful in early detection of Alzheimer disease (AD).1,2 Before rational approaches to diagnosis and treatment can be developed, it is essential to characterize the brains of clinically normal individuals as part of the normal developmental process and as distinct from explicit disease or pathology. It is now well-accepted that even normally aging brains undergo structural changes in the absence of neurodegenerative disease.3 A recent summary of structural brain aging indicates considerable expansion of CSF-filled cavities, mild shrinkage of brain parenchyma, and a pattern of regional changes where association cortices, the neostriatum, the hippocampus, and the cerebellum appear most sensitive to age-related volume loss.4
The majority of investigations of age effects on brain volumes are derived from cross-sectional studies,4 which are inherently unable to distinguish between secular and age-related changes. Longitudinal studies of brain morphology are few and vary widely in participant selection, methods, and the number of brain regions examined.4-8 Many use only two assessments separated by varying amounts of time to calculate mean rates of change, which essentially restricts conclusions to linear effects and overlooks individual differences. Moreover, age-based normative volume data for smaller brain regions still remain largely unavailable due to considerable methodologic variability between the studies.9
To better understand both global and regional changes in brain structure in later life and pathology-related divergence from normal trajectories of age-related volume decline, we investigated a community-dwelling sample of 138 older adults, including 18 individuals diagnosed with mild cognitive impairment (MCI) during the course of the study. Participants were prospectively followed for up to 10 years through the neuroimaging substudy of the Baltimore Longitudinal Study of Aging (BLSA).10,11 First, we characterize the trajectories of volume loss in older adults who remain clinically normal to establish a solid foundation against which pathologic changes can be compared. Second, we ask whether trajectories of tissue loss distinguish between clinically normal individuals and those with MCI. We predict that regions that show early pathologic changes in association with AD, including frontal, temporal, and parietal association cortices, will show accelerated volume loss in MCI compared to normal aging.
METHODS
Participants.
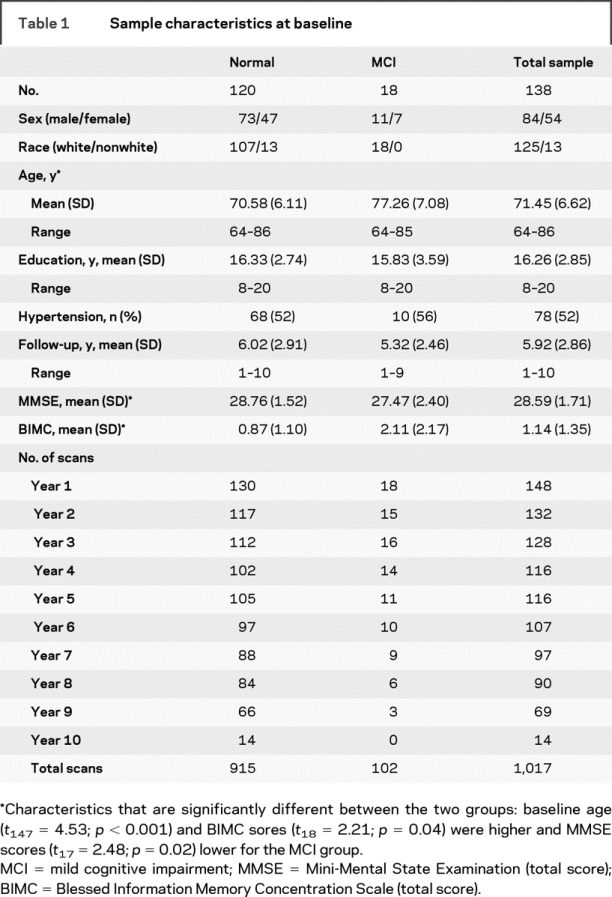
The sample includes 138 participants (ages 64–86 years, 90% Caucasian) who were free of dementia at initial evaluation and were prospectively followed annually for up to 10 years. Eighteen of 138 were diagnosed with MCI over the course of the study and 5 of those 18 went on to develop dementia. The sample was divided into two groups for analytic purposes, normal (n = 120) and MCI (n = 18), based on standardized diagnostic procedures for the BLSA12 using Petersen criteria for MCI.13 Only participants with stable MCI diagnosis (i.e., did not revert back to normal in subsequent years) were included in the MCI group. Data points at and following dementia diagnosis were excluded; all other magnetic resonance scans were analyzed for a total of 1,017 observations. All participants were in generally good health at entrance with exclusionary criteria encompassing CNS disease, severe cardiovascular disease, severe pulmonary disease, or metastatic cancer. Analyses were restricted to participants without current depression. Approximately half of the sample was hypertensive, the majority of which was controlled with medication. The proportion of treated individuals was similar across the two groups. Sample characteristics, functional status measures at baseline imaging evaluation, and the number of participants at each follow-up are presented in table 1. The study was approved by the local institutional review boards, and all participants gave written informed consent prior to each assessment.
Table 1 Sample characteristics at baseline
BLSA participants undergo neuropsychological testing, a neurologic examination, interval medical history, medication review, and a structured informant and subject interview at each visit, the details of which have been summarized elsewhere.12,14 Briefly, a battery of neuropsychological tests assessing five different cognitive domains includes the following: 1) memory—California Verbal Learning Test15 and Benton Visual Retention Test16; 2) word knowledge—Primary Mental Abilities Vocabulary17; 3) attention—Digits Forward18 and the Trail Making Test-A19; 4) executive function—Digits Backward,18 Trail Making Test-B,19 and Verbal Fluency20; and 5) visuospatial abilities—the Card Rotations Test.21
MRI acquisition.
Scanning was performed on a GE Signa 1.5T scanner (Milwaukee, WI) using a high-resolution volumetric spoiled-grass axial series (repetition time = 35 msec, echo time = 5 msec, field of view = 24 cm, flip angle = 45°, matrix = 256 × 256, number of excitations = 1, voxel dimensions 0.94 × 0.94 × 1.5 mm).
MRI analysis.
Image processing procedures have been previously validated and described.11,22,23 Briefly, images are corrected for head tilt and rotation, and reformatted parallel to the anterior-posterior commissure plane. Extracranial tissue is removed using a semiautomated procedure followed by manual editing. Next, images are segmented into white matter (WM), gray matter (GM), and CSF. The final step involves stereotaxic normalization and tissue quantitation for specific regions of interest. A template-based deformation approach is employed, using the ICBM standard MRI (Montreal Neurologic Institute) as the template and a hierarchical elastic matching algorithm for deformation and regions of interest determination24; all images are normalized individually to the same template. Voxel-based analysis utilizes our RAVENS approach (regional analysis of volumes examined in normalized space),23 whereby local values of tissue density maps (one for GM, one for WM, and one for CSF) reflect the amount of respective tissue in the vicinity of a voxel. Tissue densities are mathematical quantities measuring local tissue volumes and do not reflect any microstructural physical density of brain tissue. Intracranial volume (ICV) is determined using the template warping algorithm modified for head image registration. First, the ICV in the template is manually and carefully delineated by an expert. Then, the template with its ICV mask is warped to the space of each individual head. Finally, the warped ICV mask of template is used to directly extract the ICV of the individual. ICV at initial imaging evaluation is used for statistical adjustment to avoid potential biases of brain atrophy and partial volume effects on estimation of ICV.25
Statistical analyses.
Pairwise multiple comparisons with Tukey adjustments were carried out to compare sample characteristics presented in table 1. The outliers were assessed both by examining the data plots and by statistical methods. We performed Cook's D influence diagnostics for each brain region. Observations with Cook's D > 0.01 fell outside of the acceptable range of values and were excluded from analyses. The determination of outliers was conducted separately for each region of interest; hence the exact number of exclusions varies by brain region. On average, eight data points (range 2–18) per region were excluded from analyses, and the number of outliers generally did not seem to systematically differ between the two groups. In most cases, an individual's value was excluded for only a single year for a particular region. A total of 1,017 observations entered the analyses, after the exclusions.
Longitudinal changes were examined employing linear mixed models, which account for the correlations for repeated measures (SAS v. 9.1; SAS Institute Inc., Cary, NC). Linear mixed models (SAS PROC MIXED) were fit based on absolute regional volume measurements covarying for ICV. Age (at which the dependent measures were taken) was treated as continuous covariate and was centered on the mean to reduce multicollinearity. The full model included diagnosis (normal vs MCI), intercept, ICV, sex, age, age2, and their interactions as fixed effects, and intercept, age, and age2 as random effects. Sex (male, female) and clinical diagnosis (MCI, normal) were treated as class variables. Model reduction began with tests of the random effects (using mixture χ2 tests) and continued for fixed effects after determination of the final random effects for the model. For fixed effects, we used a backward elimination procedure based on t test and likelihood ratio tests. Nonsignificant higher order terms were deleted sequentially from the model. Annual rates of change were estimated from the linear components of the mixed regression models. The data points for the MCI group start at age 64 years; hence we restricted the analysis to those participants in the normal group with observations starting at age 64 years and older.
RESULTS
Sample characteristics.
The two groups were similar in demographic characteristics (see table 1), with the exception of the MCI group being nearly 7 years older at baseline (t147 = 4.53, p < 0.001). Mental status scores at baseline also differed between the two groups. The MCI group had a lower mean Mini-Mental State Examination (MMSE)26 score (t17.2 = 2.48; p = 0.02) and a higher Blessed Information Memory Concentration Scale (BIMC)27 score (t18.4 = 2.21; p = 0.04), reflecting poorer performance.
Stability measures.
Stability measures for volumes across follow-up assessments indicated that measurements generally were consistent over time. Only regions with stability measures above 0.85 were included in analyses with the exception of following select regions which are important for tests of our hypotheses: superior frontal (0.75), postcentral (0.80), supramarginal (0.82), and parahippocampal (0.80) gyrus, entorhinal (0.73) and perirhinal (0.80) cortices, cuneus (0.82) and occipital regions (range 0.72–0.82).
Longitudinal brain volume change.
Results are reported as significant if p ≤ 0.05, although with Bonferroni correction for multiple comparisons, results would be considered significant at p ≤ 0.0013.
Mixed-model results for global and regional volumes are summarized in tables 2 and 3. All regions investigated showed significant longitudinal decline in tissue volumes and increases in vCSF in clinically normal individuals. A number of regions showed nonlinear changes within the context of normal aging (i.e., accelerated atrophy with age indicated by the age2 term), including vCSF (t661 = 4.20, p < 0.001), frontal GM (t652 = −3.09, p = 0.002), superior (t655 = −2.97, p = 0.003), middle (t656 = −2.45, p = 0.01), and medial (t655 = −2.08, p = 0.04) frontal, and superior parietal (t648 = −2.79, p = 0.005) regions. Sex differences in rates of normal age-related decline were observed for whole brain volume (t652 = −2.15, p = 0.03), vCSF (t661 = 2.57, p = 0.01), frontal GM (t652 = −2.01, p = 0.04), temporal (t655 = −3.36, p < 0.001) and parietal (t656 = 2.43, p = 0.02) WM, middle frontal (t657 = −1.98, p = 0.05) and superior parietal (t649 = −2.25, p = 0.02) cortices, and supramarginal (t648 = −2.50, p = 0.01) and parahippocampal (t659 = −3.12, p = 0.02) regions. Age-related atrophy in these regions was generally more pronounced in males, with the exception of parietal WM, where females showed greater rates of tissue loss.
Table 2 Annual rates of change in global and lobar brain volumes (cm3)
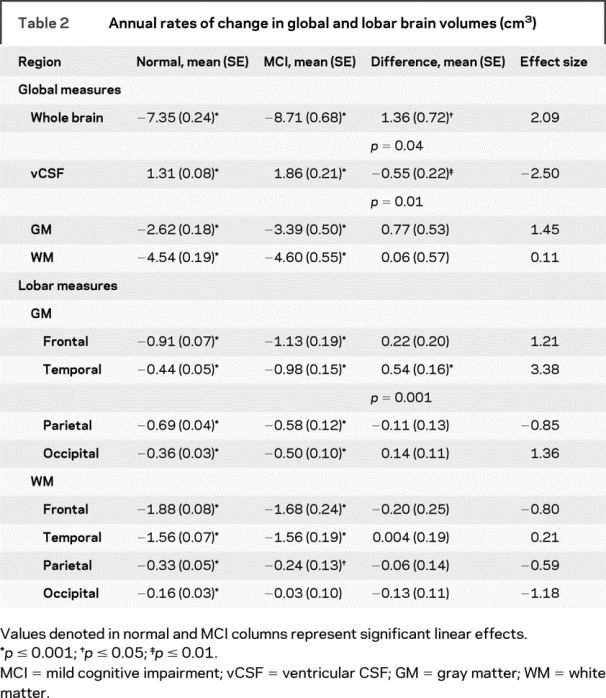
Table 3 Annual rates of change in regional brain volumes (cm3)
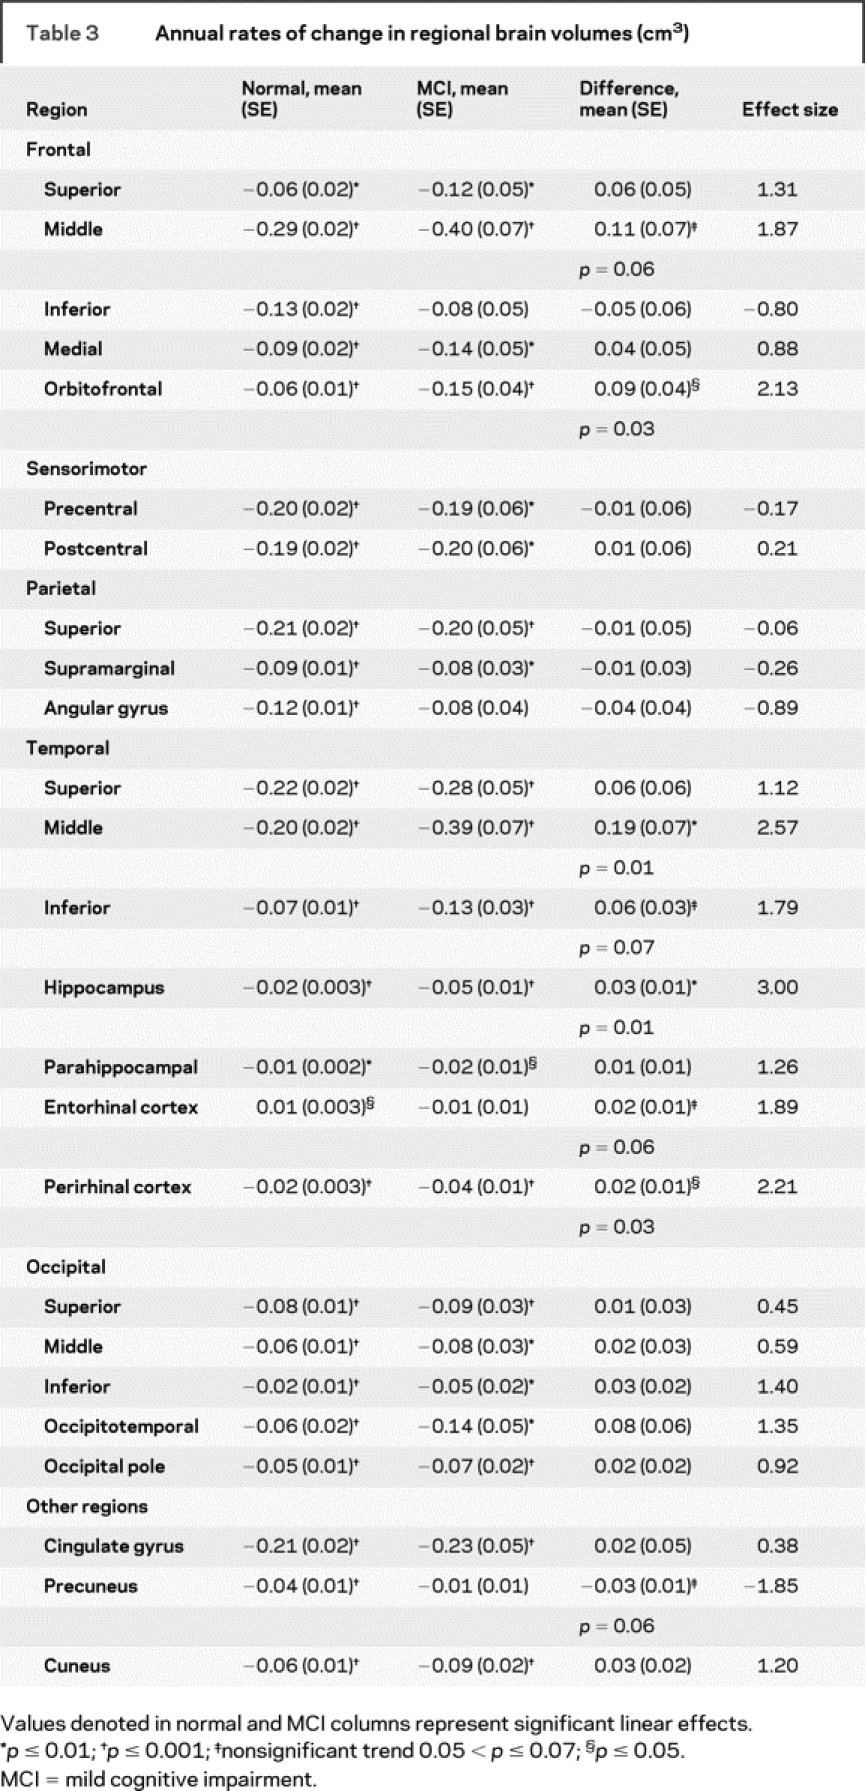
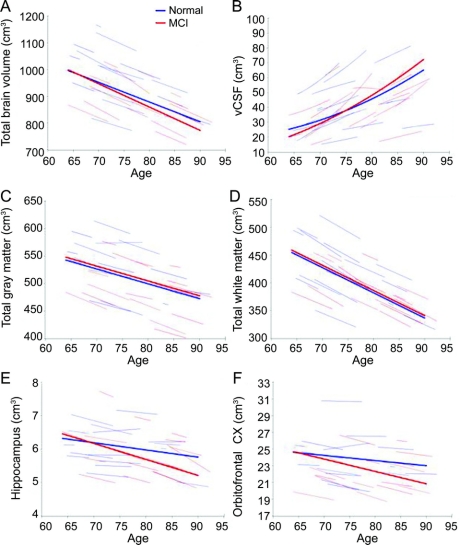
The magnitudes of the estimated annual rates of change for all regions examined are presented in tables 2 and 3 to provide normative values against which pathologic changes can be compared. Trajectories of volume change over time are shown in figure 1 for total brain, vCSF, WM, GM, hippocampus, and orbitofrontal cortex. Regions that showed diverging trajectories for clinically normal individuals vs those with MCI (figure 2) include whole brain (t729 = −2.09, p = 0.04), vCSF (t740 = 2.52, p = 0.01), temporal GM (t728 = −3.38, p = 0.001), the hippocampus (t741 = −2.53, p = 0.01), orbitofrontal (t728 = −2.13, p = 0.03), middle temporal (t737 = −2.57, p = 0.01), and perirhinal (t734 = −2.21, p = 0.03) cortices.
Figure 1 Trajectories of select brain volume changes (cm3)
Age-related changes in (A) whole brain volume, (B) ventricular CSF (vCSF), (C) total white matter, (D) total gray matter, (E) hippocampus, and (F) orbitofrontal cortex. Thin red (mild cognitive impairment [MCI]) and blue (normal) lines represent individual volumes over time for a random sample of participants; thick red and blue lines indicate respective estimated average volumes for each group. Increase in vCSF accelerates with age. The hippocampus and orbitofrontal cortex decline linearly with increasing age and at a steeper rate in the MCI group. Males show steeper changes in whole brain and vCSF volume decline.
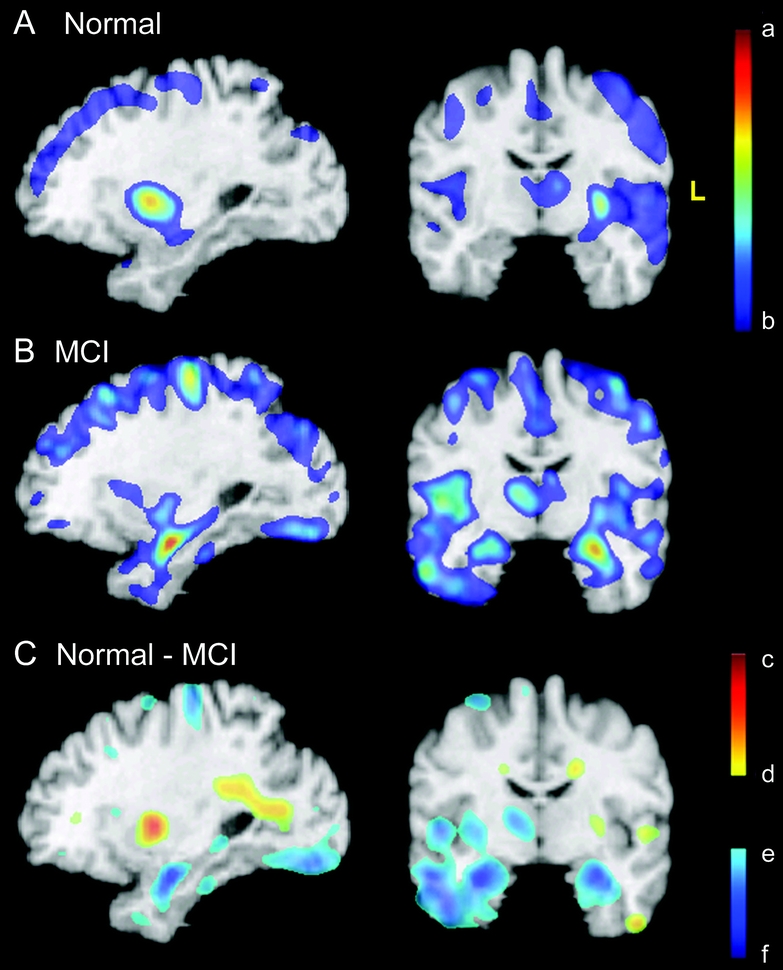
Figure 2 Patterns of gray matter volume loss in MCI and normal aging
Average slopes of RAVENS maps for normal (A) and MCI (B) groups. The red-yellow color indicates greater volume loss. Bottom row: Difference between the two groups: blue/green are regions in which MCI subjects showed higher rate of gray matter decrease. (C) Red/yellow colors reflect an increase of periventricular small vessel disease, which appears gray in T1-weighted images and is segmented as gray matter. The color bars display estimated regression coefficients and are defined by the following numbers, all in mm3/year (per voxel in the template space): a = −0.020, b = −0.0053, c = 0.026, d = 0.0053, e = −0.0053, f = −0.023. MCI = mild cognitive impairment.
DISCUSSION
In a relatively large sample of older adults prospectively followed with serial MRI, we found widespread and diffuse tissue loss over time in nondemented individuals. Moreover, against this background of age-related volume loss, individuals with MCI showed accelerated tissue loss in several specific brain regions.
Widespread longitudinal volume loss was observed in the brains of clinically normal individuals in all regions assessed. Our findings are largely in agreement with previous reports, with the exception of sensory-motor and visual cortices, which historically have been believed to be relatively spared by aging,4,28 yet show significant longitudinal volume loss in our normally aging sample at a 9-year follow-up. A number of regions, specifically frontal GM, superior, middle, and medial frontal, and superior parietal cortices, experience accelerated tissue loss and vCSF volume changes that increase exponentially with advancing age. Albeit not all regions show nonlinear changes with age in the absence of disease, inclusion of a nonlinear term in the analyses avoids underestimation of the magnitude of age-related atrophy. We postulate that accelerations in the rate of decline may become even more evident and important in the face of pathology, which would have implications for disease-altering treatments. Our findings and those of others29 suggest that future studies should include nonlinear models.
Accelerated tissue loss may signify impending neurodegenerative disease in some cases,30 but differential patterns of decline in our MCI group which do not necessarily overlap with regions showing accelerated loss with normal aging suggest that this is not necessarily the case. Some have argued that tissue loss reflects pathology in its early stages. Although some of our normally aging participants may go on to eventually develop dementia, the uniformity of our findings across the majority of normal older participants argues against this interpretation unless all individuals will eventually develop dementia. Thus, our data provide normative values against which pathologic changes can be compared.
Specific volumes that differentiated MCI from normal aging include whole brain volume, vCSF, temporal GM, orbitofrontal, middle temporal, and perirhinal cortices, and the hippocampus with nonsignificant trends observed in the middle frontal, inferior temporal, and entorhinal cortex, and the precuneus. We hypothesized that regions that show early pathologic changes in association with AD, including frontal, temporal, and parietal association cortices, would show accelerated volume loss in MCI compared to normal aging. Accelerated volume loss in the frontal and temporal regions in MCI follows the pattern of progression of neuropathologic changes as we originally hypothesized, although we did not observe accelerated atrophy in parietal association cortices. A word of caution is in order when interpreting the MCI differences. Our MCI sample is small compared to the normal sample, as it was limited to the participants who were diagnosed with MCI during the course of the study rather than focused on a sample ascertained due to MCI status. A larger number of participants over longer intervals will be crucial in determining the sensitivity of different volume measures to MCI with greater confidence. This, however, should not undermine the unique aspects of the study, such as the large number of follow-up assessments, relatively short periods between assessments, and the extensive characterization of this sample.
Smaller regions, such as the hippocampus, orbitofrontal cortex, and the cingulate gyrus, are also of particular interest because these regions are affected very early in the process of AD progression.2,31 For example, both neuroimaging2,32 and neuropathologic33 findings converge on the hippocampus as an early focus of AD pathology. Posterior cingulate cortex involvement in MCI or very early AD has been suggested with both FDG-PET34 and MRI.30 In our sample, the trajectories of hippocampal and orbitofrontal volume loss, but not the cingulate gyrus, discriminate between normal aging and MCI. The current volumetric analyses, however, do not discriminate the anterior from posterior cingulate region and hence may lack sensitivity to changes in specific cingulate subregions. We observed substantial overlap between the regions that exhibit pathology-related volume decline compared to those that are affected on a neuropathologic level, suggesting some shared underlying mechanisms.
The present sample is not population-based; the majority of our sample is highly educated and Caucasian. The relative homogeneity of the sample, however, may be seen as an asset because the majority of our sample has good access to medical care and has remained relatively healthy over the follow-up interval. Also, our regional definitions are based on a template brain, which may limit comparisons of volumes among regions but has less effect on interpretation of within-subject longitudinal change. These limitations, however, should not undermine the unique aspects of our study, namely a large number of elderly individuals who are prospectively followed for many years on an annual basis, extensively characterized, and studied with state-of-the art image processing methods.
A recent report from our group demonstrated that volumes of a single region provide only limited accuracy in discriminating individuals with MCI from those who remain cognitively normal, while a 90% diagnostic accuracy in discriminating MCI from cognitively normal individuals based on a single MRI scan was achieved using computer-based high-dimensional pattern classification of multiple MRI features and spatial patterns of brain atrophy.35 Our present findings suggest several regions where longitudinal trajectories of tissue loss may further enhance early detection. Defining the pattern and rate of longitudinal brain changes would be particularly pertinent when monitoring therapeutic responses or when predicting the onset of a neurodegenerative illness.
Overall, we identified regions with differential rates of tissue loss that distinguish between cognitively impaired and unimpaired individuals and provided normative values against which pathologic changes can be compared. Our current data allow us to begin to understand the pathologic progression and address the limitations of previous studies imposed by shorter follow-up intervals. Furthermore, our longitudinal model enables us to compare the trajectories of change in a normal aging population to a group of individuals who transitioned to cognitive impairment and our longer follow-up interval provides greater power for detection of nonlinear age changes. Identification of differential rates of early changes has direct implications for the utility of MRI as a surrogate marker of AD and suggests a new window of opportunity for preventive strategies.
In addition to confirming some aspects of existing cross-sectional and longitudinal findings of normal and MCI-related changes in brain volume,9 our findings extend them by providing information on both global and localized longitudinal changes, many of which have not been investigated previously. Our findings serve as bases for future investigations of factors that may modulate the complexities of brain atrophy trajectories. Longitudinal studies will be imperative in determining the clinical relevance of observed brain changes and their relationship to age-related cognitive decline and neuropathologic observations. As such, our and other longitudinal MRI studies can help better direct neuropathologic studies, which are critical in elucidating the cellular basis of the in vivo imaging findings. Suitable animal models using both neuroimaging and histologic tools and neuropathologic assessments of humans followed longitudinally also may be helpful in elucidating the biologic meaning of regional brain shrinkage.
AUTHOR CONTRIBUTIONS
Y. An conducted the statistical analysis.
ACKNOWLEDGMENT
The authors thank Beth Nardi for study coordination and the staff of the MRI facility at Johns Hopkins Hospital and the Baltimore Longitudinal Study of Aging volunteers for their continued participation.
Address correspondence and reprint requests to Dr. Susan Resnick, LPC/GRC/NIA, 5600 Nathan Shock Dr., Baltimore, MD 21224 resnicks@mail.nih.gov.
Supported in part by NIH funding sources N01-AG-3-2124 and R01-AG14971 and by the Intramural Research Program of the NIH, National Institute on Aging.
Disclosure: The authors report no disclosures.
Medical Device: GE Signa 1.5T scanner (GE, Milwaukee, WI).
Received October 29, 2008. Accepted in final form March 2, 2009.
REFERENCES
- 1.de Leon MJ, DeSanti S, Zinkowski R, et al. MRI and CSF studies in the early diagnosis of Alzheimer's disease. J Intern Med 2004;256:205–223. [DOI] [PubMed] [Google Scholar]
- 2.Kantarci K, Jack CR Jr. Quantitative magnetic resonance techniques as surrogate markers of Alzheimer's disease. NeuroRx 2004;1:196–205. [DOI] [PMC free article] [PubMed] [Google Scholar]
- 3.Anderton BH. Changes in the ageing brain in health and disease. Philos Trans R Soc Lond B Biol Sci 1997;352:1781–1792. [DOI] [PMC free article] [PubMed] [Google Scholar]
- 4.Raz N, Rodrigue KM, Head D, Kennedy KM, Acker JD. Differential aging of the medial temporal lobe: a study of a five-year change. Neurology 2004;62:433–438. [DOI] [PubMed] [Google Scholar]
- 5.Carlson NE, Moore MM, Dame A, et al. Trajectories of brain loss in aging and the development of cognitive impairment. Neurology 2008;70:828–833. [DOI] [PubMed] [Google Scholar]
- 6.de Leon MJ, DeSanti S, Zinkowski R, et al. Longitudinal CSF and MRI biomarkers improve the diagnosis of mild cognitive impairment. Neurobiol Aging 2006;27:394–401. [DOI] [PubMed] [Google Scholar]
- 7.Fotenos AF, Snyder AZ, Girton LE, Morris JC, Buckner RL. Normative estimates of cross-sectional and longitudinal brain volume decline in aging and AD. Neurology 2005;64:1032–1039. [DOI] [PubMed] [Google Scholar]
- 8.Jack CR Jr, Weigand SD, Shiung MM, et al. Atrophy rates accelerate in amnestic mild cognitive impairment. Neurology 2008;70:1740–1752. [DOI] [PMC free article] [PubMed] [Google Scholar]
- 9.Anstey KJ, Maller JJ. The role of volumetric MRI in understanding mild cognitive impairment and similar classifications. Aging Ment Health 2003;7:238–250. [DOI] [PubMed] [Google Scholar]
- 10.Resnick SM, Goldszal AF, Davatzikos C, et al. One-year age changes in MRI brain volumes in older adults. Cereb Cortex 2000;10:464–472. [DOI] [PubMed] [Google Scholar]
- 11.Resnick SM, Pham DL, Kraut MA, Zonderman AB, Davatzikos C. Longitudinal magnetic resonance imaging studies of older adults: a shrinking brain. J Neurosci 2003;23:3295–3301. [DOI] [PMC free article] [PubMed] [Google Scholar]
- 12.Driscoll I, Resnick SM, Troncoso JC, An Y, O'Brien R, Zonderman AB. Impact of Alzheimer's pathology on cognitive trajectories in nondemented elderly. Ann Neurol 2006;60:688–695. [DOI] [PubMed] [Google Scholar]
- 13.Petersen RC. Mild cognitive impairment as a diagnostic entity. J Intern Med 2004;256:183–194. [DOI] [PubMed] [Google Scholar]
- 14.Zonderman AB, Giambra LM, Arenberg D, et al. Changes in immediate visual memory predict cognitive impairment. Arch Clin Neuropsychol 1995;10:111–123. [PubMed] [Google Scholar]
- 15.Delis DC, Kramer JH, Kaplan E, Ober BA. California Verbal Learning Test: research edition. New York: The Psychological Corporation; 1987. [Google Scholar]
- 16.Benton AL. Differential behavioral effects in frontal lobe disease. Neuropsychologia 1968;6:53–60. [Google Scholar]
- 17.DeFries JC, Vandenberg SG, McClearn GE, et al. Near identity of cognitive structure in two ethnic groups. Science 1974;183:338–339. [DOI] [PubMed] [Google Scholar]
- 18.Wechsler D. Wechsler Adult Intelligence Scale–Revised. New York: Psychological Corporation; 1981. [Google Scholar]
- 19.Reitan R. Trail Making Test: Manual for Administration and Scoring. Tucson: Reitan Neuropsychological Laboratory; 1982. [Google Scholar]
- 20.Newcombe F. Missile Wounds of the Brain: A Study of Psychological Deficits. London: Oxford University Press; 1969. [Google Scholar]
- 21.Wechsler D. Wechsler Adult Intelligence Scale–Revised. New York: Psychological Corporation; 1981. [Google Scholar]
- 22.Davatzikos C, Genc A, Xu D, Resnick SM. Voxel-based morphometry using the RAVENS maps: methods and validation using simulated longitudinal atrophy. Neuroimage 2001;14:1361–1369. [DOI] [PubMed] [Google Scholar]
- 23.Goldszal AF, Davatzikos C, Pham DL, Yan MX, Bryan RN, Resnick SM. An image-processing system for qualitative and quantitative volumetric analysis of brain images. J Comput Assist Tomogr 1998;22:827–837. [DOI] [PubMed] [Google Scholar]
- 24.Shen D, Davatzikos C. HAMMER: hierarchical attribute matching mechanism for elastic registration. IEEE Trans Med Imaging 2002;21:1421–1439. [DOI] [PubMed] [Google Scholar]
- 25.Pengas G, Pereira JM, Williams GB, Nestor PJ. Comparative reliability of total intracranial volume estimation methods and the influence of atrophy in a longitudinal semantic dementia cohort. J Neuroimaging Epub 2008 May 19. [DOI] [PubMed]
- 26.Folstein MF, Folstein SE, McHugh PR “Mini-mental state”: a practical method for grading the cognitive state of patients for the clinician. J Psychiatr Res 1975;12:189–198. [DOI] [PubMed] [Google Scholar]
- 27.Fuld P. Psychological testing in the differential diagnosis of the dementias. In: Katzman TR, Bick KL, eds. Alzheimer's Disease: Senile Dementia and Related Disorders. New York: Raven; 1978:185–193. [Google Scholar]
- 28.Raz N. Aging of the brain and its impact on cognitive performance: integration of structural and functional findings. In: Craik FIM, Salthouse TA, eds. Handbook of Aging and Cognition. New Jersey: Erlbaum; 2000:1–90. [Google Scholar]
- 29.Martins CA, Oulhaj A, de Jager CA, Williams JH. APOE alleles predict the rate of cognitive decline in Alzheimer disease: a nonlinear model. Neurol 2005;65:1888–1893. [DOI] [PubMed] [Google Scholar]
- 30.Chetelat G, Desgranges B, De La Sayette V, Viader F, Eustache F, Baron JC. Mapping gray matter loss with voxel-based morphometry in mild cognitive impairment. Neuroreport 2002;13:1939–1943. [DOI] [PubMed] [Google Scholar]
- 31.Scahill RI, Frost C, Jenkins R, Whitwell JL, Rossor MN, Fox NC. A longitudinal study of brain volume changes in normal aging using serial registered magnetic resonance imaging. Arch Neurol 2003;60:989–994. [DOI] [PubMed] [Google Scholar]
- 32.Good CD, Johnsrude IS, Ashburner J, Henson RN, Friston KJ, Frackowiak RS. A voxel-based morphometric study of ageing in 465 normal adult human brains. Neuroimage 2001;14:21–36. [DOI] [PubMed] [Google Scholar]
- 33.Braak H, Braak E. Evolution of neuronal changes in the course of Alzheimer's disease. J Neural Transm Suppl 1998;53:127–140. [DOI] [PubMed] [Google Scholar]
- 34.Minoshima S, Giordani B, Berent S, Frey KA, Foster NL, Kuhl DE. Metabolic reduction in the posterior cingulate cortex in very early Alzheimer's disease. Ann Neurol 1997;42:85–94. [DOI] [PubMed] [Google Scholar]
- 35.Davatzikos C, Fan Y, Wu X, Shen D, Resnick SM. Detection of prodromal Alzheimer's disease via pattern classification of MRI. Neurobiol Aging 2008;29:514–523. [DOI] [PMC free article] [PubMed] [Google Scholar]


