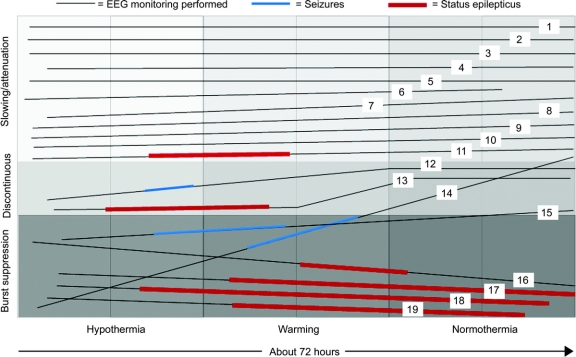
Figure Background evolution and seizure occurrence by subject
Time extends from left to right, demonstrating hypothermic, rewarming, and normothermic periods. EEG background characteristics are most abnormal on the bottom (burst suppression) and least abnormal on the top (attenuation, slowing). Each subject is shown as a line that demonstrates background evolution over time. Dark line segments demonstrate the time during which recurrent independent seizures occurred, and thick dark line segments represent status epilepticus.

