

Abstract
Corticomuscular coherence between the primary motor cortex (M1) and hand muscle electromyograms (EMG) occurs at ∼20 Hz but is rarely seen at ∼10 Hz. This is unexpected, because M1 has oscillations at both frequencies, which are effectively transmitted to the spinal cord via the corticospinal tract. We have previously speculated that a specific “neural filter” may selectively reduce coherence at ∼10 Hz. This would have functional utility in minimizing physiological tremor, which often has a dominant component around this frequency. Recurrent inhibition via Renshaw cells in the spinal cord is a putative neural substrate for such a filter. Here we investigate this system in more detail with a biophysically based computational model. Renshaw cell recurrent inhibition reduced EMG oscillations at ∼10 Hz, and also reduced corticomuscular coherence at this frequency (from 0.038 to 0.014). Renshaw cell inhibitory feedback also generated synchronous oscillations in the motoneuron pool at ∼30 Hz. We show that the effects at 10 Hz and 30 Hz can both be understood from the dynamics of the inhibitory feedback loop. We conclude that recurrent inhibition certainly plays an important role in reducing 10 Hz oscillations in muscle, thereby decreasing tremor amplitude. However, our quantitative results suggest it is unlikely to be the only system for tremor reduction, and probably acts in concert with other neural circuits which remain to be elucidated.
Introduction
All of us experience the involuntary shaking of the hands which is physiological tremor. This tremor places severe constraints on motor performance. Individuals with exceptionally precise motor control, such as champion dart players and microsurgeons, have very low tremor; drugs which artificially reduce tremor are banned in many sports. Although many factors contribute to tremorigenesis, an important component comes from neural oscillators rhythmically active at ∼10 Hz (Elble and Koller, 1990).
During a sustained contraction, primary motor cortex (M1) shows oscillations at both ∼10 Hz and ∼20 Hz (Murthy and Fetz, 1992; Conway et al., 1995; Halliday et al., 1998). Both these frequency ranges are effectively carried down the corticospinal tract (Baker et al., 2003), which in old-world primates including man makes direct monosynaptic connections to motoneurons (Porter and Lemon, 1993). However, the majority of studies find that only ∼20 Hz oscillations are coherent between M1 and hand muscles (Conway et al., 1995; Baker et al., 1997, 2003; Salenius et al., 1997; Halliday et al., 1998; Kilner et al., 2000). Based on these puzzling observations, we have previously speculated that a neural system may actively filter out ∼10 Hz oscillations in motoneuron firing (Baker et al., 2003). This would be advantageous in minimizing physiological tremor.
Renshaw cells receive excitatory input from motoneurons, and feed back inhibition to the same motoneuron pool (Renshaw, 1941). This recurrent inhibition has been variously suggested as a mechanism for tremor reduction by preventing excessive motoneuron synchronization (Stein and Oguztoreli, 1984; Windhorst, 1996; Matthews, 1997), or alternatively as the generator of ∼10 Hz physiological tremor (Elble and Randall, 1976). A previous modeling study showed that recurrent inhibition reduces motoneuron correlations (Maltenfort et al., 1998).
In this study, we report results from a biophysically based computational model designed to investigate the effects of recurrent inhibition on corticomuscular coherence. We show that the known dynamics of the Renshaw cell feedback loop lead to partial cancellation of oscillations around 10 Hz, thereby markedly reducing corticomuscular coherence and tremor amplitude.
Materials and Methods
Overview of model.
The model builds on our previously published work (Baker and Lemon, 1998; Williams and Baker, 2009). It consists of a pool of realistic motoneurons, which receive common input from the motor cortex (Fig. 1A). EMG and Force are simulated from the firing of the motoneurons. Renshaw cell spinal interneurons provide recurrent inhibition to the motoneurons. The model produces output signals corresponding to those which would be measured experimentally, which can be used in a coherence calculation.
Figure 1.

A, Schematic of the model. B, Example raw data output from model. C, Cross-correlation between Renshaw cell and motoneuron spikes, averaged over all possible pairs.
Motoneuron model.
The motoneuron model was based on a previously published model (Booth et al., 1997). It includes a somatic and dendritic compartment, and eight active conductances found in mammalian motoneurons (soma, gNa, gK(DR), gCa-N, gK(Ca), gNa-P; dendrite, gCa-L, gCa-N, gK(Ca)) each with Hodgkin–Huxley style kinetics. The values of gK(Ca) were 3.136 and 0.69 mS/cm2 for the somatic and dendritic compartments respectively. We added a sodium persistent inward current (PIC) in the soma with kinetics chosen to fit data from Li and Bennett (2003). This conductance shows strong clamp control in both voltage and current clamp experiments, suggesting that the responsible channels are primarily located on or near the soma (Lee and Heckman, 2001).
Each motoneuron received excitatory common input from a cortical source. The number of inputs arriving per 0.2 ms time step was modeled as white Gaussian noise with both mean and variance equal to 0.5. This is equivalent to each motoneuron receiving 2500 impulses/s which is consistent with published reports (Fritz et al., 1985; Porter and Lemon, 1993; Baker et al., 2001; Davies et al., 2006). In some simulations, the cortical input was modeled as colored Gaussian noise, with peaks at 8–12 Hz and 18–30 Hz, to simulate the cortical oscillations seen experimentally (Conway et al., 1995; Kilner et al., 2000).
Each motoneuron also received an independent input (white Gaussian noise), which was independent both from the common input and also from the independent input to all other motoneurons. The mean and variance were adjusted with reference to preliminary simulations to produce a force output at the desired percentage of maximal voluntary contraction (MVC). This required that the independent input had a mean 3.2 times larger than the cortical input.
The time course of synaptic conductances was modeled as an α-function:
 |
where gmax is the maximum conductance and τ is the rise time (Baker and Lemon, 1998). Unitary synaptic conductances summed to produce the total synaptic conductance (gt-syn) in the dendrite. The reversal potential for the synaptic conductance was set to 0 mV (Baker and Lemon, 1998). The values of τ and gmax were chosen to produce an EPSP in the somatic compartment with a rise time of 1 ms and a peak of 100 μV (Asanuma et al., 1979).
The properties of motoneurons vary continuously across the motoneuron pool, such that units generating the smallest twitch tension are recruited first (Zajac and Faden, 1985). An orderly variation in motoneuron membrane properties underlies this (Bakels and Kernell, 1993). In this model, orderly recruitment was simulated by changing the ratio of soma surface area to total surface area. The parameter P in the model of Booth et al. (1997) determines the proportion of the dendrite membrane potential allowed to activate the motoneuron. The value of P used in each motoneuron was adjusted to vary the firing rate with recruitment number. The first motoneuron to be recruited (MN1) was assigned P1 = 0.1. Simulations were then run of this motoneuron model in receipt of different levels of total synaptic input; this allowed the construction of a curve of output firing rate versus synaptic input rate (Fig. 1C). The model of Wani and Guha (1975) was used to determine the firing rate of the first motoneuron when the jth is just recruited. The strength of total synaptic input needed to make MN1 fire at this rate was then determined from the input-output curve. Pj was then adjusted until the jth motoneuron fired at the minimum recruitment-firing rate with this level of input. The procedure was repeated for all motoneurons; this resulted in estimates of P which increased exponentially with recruitment number. Adjusting P in this way does not accurately reflect the processes which determine recruitment order in real motoneurons, but was a convenient means to match the rates across the pool to those predicted by Wani and Guha's (1975) model. In the resulting motoneuron pool, the afterhyperpolarization (AHP) varied in amplitude from 7.2 to 9.1 mV below threshold. The time taken for the AHP to reach half maximum ranged from 17.2 ms to 18.1 ms. These decay times correspond with exponential time constants of 24–26 ms, in keeping with previous models of motoneurons (Matthews, 1997).
Our simulations of motoneurons had a coefficient of variation (CV) of the interspike intervals between 9 and 10%. This corresponds to the lower end of the range found experimentally (10–30%) (Moritz et al., 2005). For the simulations which omitted PICs, the CVs were slightly higher, at 11–13%.
Motor units.
The motoneuron pool comprised 377 neurons (Wani and Guha, 1975; Baker and Lemon, 1998). After the firing of each motoneuron, a peripheral motor unit produced a motor unit action potential (MUAP) and twitch tension. The peripheral conduction delay for the jth motoneuron was given by (11 + 2j/377) ms; this accounts for the slightly faster conduction velocity of the higher threshold motoneurons (Baker and Lemon, 1998). MUAPs were as used as in our previous publication (Baker and Lemon, 1998); these are designed realistically to reflect the MUAPs which would be measured from a human hand muscle using surface recordings. Twitch tensions were simulated as α functions (similar to Eq. 1); the rise time and amplitudes varied across the pool as specified for the first dorsal interosseous muscle by the model of (Wani and Guha, 1975).
EMG was simulated by linear summation of the MUAPs from all active motor units. In contrast, the summation of single twitch tensions to generate total output force has been demonstrated to have several nonlinearities. Twitches summate more effectively at low spike rates, generating a sigmoidal dependence between rate and force (Rack and Westbury, 1969). Fuglevand et al. (1993) developed a model to incorporate these nonlinearities in force production, which was used here.
Renshaw cells.
Sixty-four Renshaw cells (RCs) were simulated with a model similar to that of Maltenfort et al. (1998), and used a point neuron model following MacGregor (1987). The membrane time constant was 8.0 ms, and the values of parameters B and tGK (the peak conductance and time constant of the potassium conductance respectively) were adjusted to match experimental data from Hultborn and Pierrot-Deseilligny (1979) on the after-hyperpolarization (AHP) and steady state rate/current relationship. The resulting AHP had a duration of 36 ms and a peak of 2.3 mV, similar to experimental data (Hultborn and Pierrot-Deseilligny, 1979; Hultborn et al., 1979). Synaptic inputs from motoneurons to the RCs were modeled as an α function time course, producing EPSPs with 7.6 ms rise time, 50 ms duration and 0.6 mV peak (Walmsley and Tracey, 1981). Renshaw cells received a source of synaptic input, which was independent of the motoneuron firing, and independent for each cell. The number of inputs per time step was determined by white Gaussian noise, with a mean and variance of 2.27 inputs per 0.2 ms time step, yielding a background firing rate of 11 Hz. This simulated the known supraspinal input to Renshaw cells which is independent from the motoneurons (Windhorst, 1996).
Distribution of recurrent inhibition was uniform and independent of motoneuron type in the model. This is not physiologically realistic because there is evidence that recurrent inhibition has a limited spatial extent (McCurdy and Hamm, 1994), and that the strength of recurrent inhibition may depend on motoneuron recruitment number (Hultborn et al., 1988a,b). However, since we are simulating such a low force (5% MVC), with a correspondingly limited number of active motoneurons, this simplification is unlikely materially to affect our results on the temporal dynamics of the inhibition. The number of Renshaw cells contacting each MN varied from 10 to 20; the number of MNs contacting each Renshaw cell varied from 20 to 50. These values represent a realistic level of connectivity given existing experimental data (Van Keulen, 1981; Hamm et al., 1987; Alvarez et al., 1999). A 1 ms conduction delay was introduced for both motoneuron to Renshaw cell, and Renshaw cell to motoneuron contacts. Renshaw cells produced a unitary IPSP in MNs at resting potential with an amplitude of 46.2 μV, rise time of 5.5 ms and half-width of 18.5 ms, comparable to experimental data (Hamm et al., 1987). The Renshaw cell synapses contacted the motoneuron dendritic compartment, consistent with published data (Fyffe, 1991).
To estimate the gain (G) of the recurrent feedback loop, we first measured the total firing rate (A0) across the whole motoneuron pool for a simulation without Renshaw cells. In simulations with Renshaw cells, the independent input to motoneurons was usually increased to counteract the inhibition of the motoneurons, and to maintain the same firing rate. However, to estimate the gain G, we ran a simulation without Renshaw cells, but with this higher level of independent input. The increased total motoneuron firing rate A1 was then measured from this simulation. Gain was then calculated as follows:
 |
We found G = 0.12; this is similar to the values of loop gain reported in previous simulations by (Maltenfort et al., 1998). Figure 1B shows example raw data produced by the model, and includes examples of the common cortical input, motoneuron and Renshaw cell membrane potentials, EMG and force for a period of 1 s.
Figure 1C shows the cross-correlation between Renshaw cells spikes and motoneuron spikes, averaged over all possible pairs. There was a clear dip in the cross-correlation at 12 ms, showing that Renshaw cell firing inhibited the motoneuron pool.
Model simulation.
The model was implemented in the MATLAB environment (MathWorks), using the MATLAB Distributed Computing Toolbox and Engine to run multiple simulations simultaneously on a 16-processor computer cluster. Differential equations governing motoneuron membrane potential were solved using the exponential integration scheme (MacGregor, 1987), with a time step of 0.2 ms.
Analysis.
All analysis proceeded along similar lines to that normally used for experimental data. Simulated EMGs were full wave rectified. Signals were split into 0.8192-s-long (4096 sample points) disjoint segments before calculating power spectra, coherence and coherence phase using formulae given in full in Baker et al. (2006). Coherence measures the correlation between two signals in the frequency domain, and is bounded by 0 and 1. The coherence between two signals, x and y, was calculated according to the following:
 |
where X and Y are the Fourier transforms of the signals, f is the frequency, and L is the number of disjoint segments averaged over. The 95% significance limit was determined by the following:
Power spectra were normalized as described by Witham and Baker (2007). The coherence phase was determined by the following:
 |
The 95% confidence limits on phase were estimated according to the following (Rosenberg et al., 1989):
 |
Results
Impact of Renshaw cell recurrent inhibition
Figure 2 shows corticomuscular coherence spectra calculated from simulations of our model. When no Renshaw cells were included (black line) the coherence was significant between 2 and 70 Hz, with distinct peaks at ∼10, ∼20, ∼30, and ∼40 Hz. The appearance of these peaks reflects the nonlinear properties of the motoneuron pool. At the contraction strength simulated (5% MVC), all active motoneurons fire around 10 Hz. The common input synchronizes the motoneurons. Because the motoneuron firing rates are concentrated around 10 Hz, this frequency and its harmonics appear strongly in the corticomuscular coherence spectrum – even though the common input was simulated as white noise. At the weak contraction strengths which we commonly use for fine motor control, a motoneuron pool thus has a worrying propensity to generate and accentuate ∼10 Hz physiological tremor.
Figure 2.
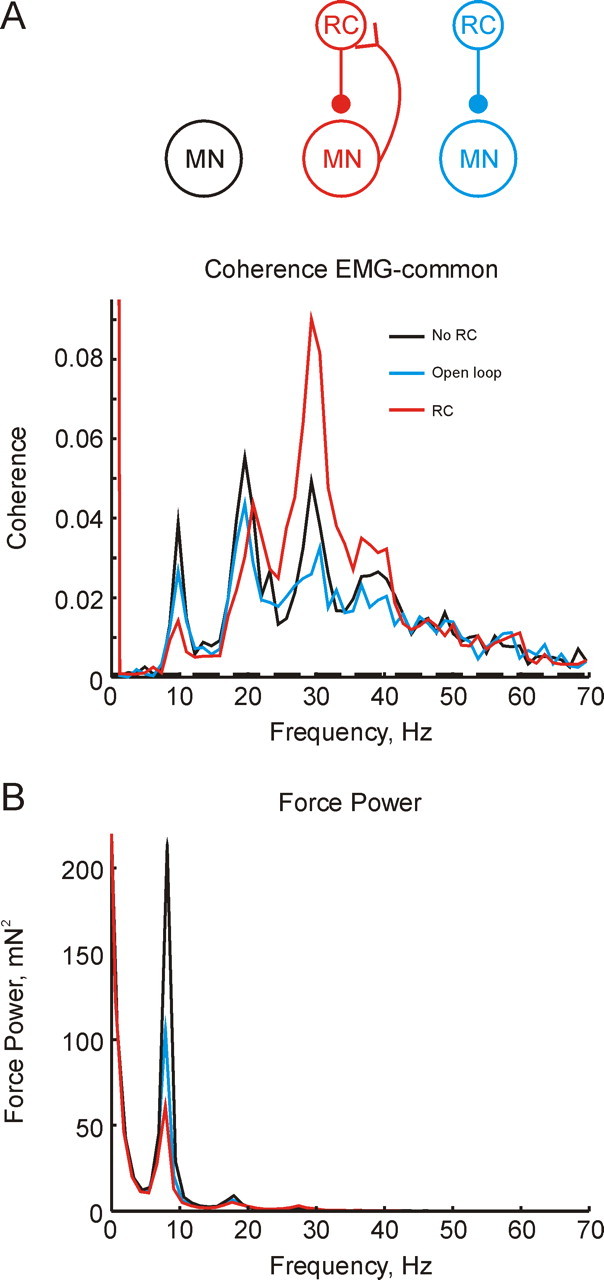
A, Corticomuscular coherence for simulations without Renshaw cells (black), with Renshaw cells (red), and in which Renshaw cell activity was copied from a previous simulation, thereby opening the Renshaw cell–motoneuron feedback loop (blue). B, Power spectrum of muscle force. In B, black line indicates no Renshaw cells; red, each motoneuron receives input from 20 Renshaw cells, and each Renshaw cell receives input from 50 motoneurons. Simulation length throughout 4017 s.
The introduction of recurrent inhibition to the model (Fig. 2, red line) reduced corticomuscular coherence at ∼10 Hz and ∼20 Hz, but increased it at ∼30 Hz and ∼40 Hz. It is tempting to interpret this result because an action of the recurrent feedback loop. However, there is one possible confounding factor. The simulations with and without Renshaw cells were run at a force output of 5% MVC. The addition of inhibitory inputs to the motoneurons in the latter required a higher level of independent drive to the motoneurons to maintain the required firing rate. In the simulations which included Renshaw cells, therefore, the cortical input to the motoneurons was a smaller fraction of the total drive than when no Renshaw cells were present. Could the reduced corticomuscular coherence have occurred simply because of this “dilution” effect?
To control for this possibility, we ran a further simulation in which the times of Renshaw cell spikes were simply copied from the previous simulation (Fig. 2, blue line). This ensured that the motoneurons received the same levels of excitatory and inhibitory drive as in the simulation with recurrent inhibition, but the feedback loop between Renshaw cells and motoneurons was broken. Corticomuscular coherence was indeed reduced slightly compared with the simulation without Renshaw cells; however, peaks at all frequencies were effected similarly. It is possible that the small reduction in coherence at ∼20 Hz is attributable to dilution of the cortical input by the increased inputs required in the simulation containing Renshaw cells. However, the majority of the decrease in coherence at 10 Hz, and the rises at 30–40 Hz, must be attributed to the closed-loop inhibitory feedback provided by the Renshaw cell circuit.
Figure 2B shows the power spectrum of the force output of the model. The slow time course of motor unit twitch tensions act as a low pass filter, so that this spectrum, approximately equivalent to the overt tremor, was dominated by the ∼10 Hz peak. Recurrent inhibition reduced the tremor peak, which would render movements smoother and more precise.
The way in which Renshaw cell inhibition has this effect on corticomuscular coherence and tremor can be understood by the further analysis of motoneuron and Renshaw cell spiking shown in Figure 3. In this figure, the red and black lines correspond to simulations with and without Renshaw cells respectively. The autocorrelation histogram averaged over all motoneurons showed a strong 10 Hz periodicity, reflecting the cells' firing rate (Fig. 3A). Figure 3B shows the average cross-correlation between motoneuron cell pairs. Without Renshaw cells in the simulation (black line), this had clear oscillations at ∼10 Hz. With the introduction of Renshaw cells, the 10 Hz periodicity in the cross-correlation was reduced and a periodicity at ∼30 Hz appeared.
Figure 3.

Effects of Renshaw cells on motoneuron firing properties. Black line indicates simulation without Renshaw cells; red indicates the simulation with Renshaw cells. A, Autocorrelation of motoneuron spikes, summed across the motoneuron pool. B, Cross-correlation between pairs of motoneurons, summed across all possible cell pairs. Bin width 10 ms. C, Sum of power spectra of single motoneuron spike activity. D, Power spectrum of the population discharge of the motoneuron pool.
Figure 3C shows the sum of the power spectra of the spiking of each motoneuron in the simulation; this is the frequency domain equivalent of the autocorrelation in Figure 3A. Peaks at 10 Hz and its harmonics were not altered by the addition of Renshaw cells. Figure 3D presents the power spectrum of the population discharge of the entire motoneuron pool. This differs from the summed power spectra of the individual cells, as correlations between neurons can now contribute. It is clear that Renshaw cells had a marked effect on the spectrum, decreasing the power at 10 Hz and increasing it at 30 Hz.
Renshaw cells therefore act by changing the correlations between motoneurons. Correlations close to 10 Hz are decreased, whereas those around 30 Hz are elevated.
Phase analysis of the recurrent feedback loop
Why do motoneurons synchronize at ∼30 Hz in the simulations which include Renshaw cells? This is not a simple product of the Renshaw cell firing rate: on average, Renshaw cells fired at 17 Hz in these simulations, but this comprised brief bursts at ∼60 Hz separated by pauses. One possible source of the 30 Hz rhythm is the delay around the recurrent feedback loop. To characterize the dynamics imposed by Renshaw cell feedback, we first simulated each connection in an open loop configuration. Thus one simulation contained only connections from Renshaw cells to motoneurons (Fig. 4A, blue), the other only had connections from motoneurons to Renshaw cells (Fig. 4A, black). Figure 4B shows the phase of the coherence calculated between the total spiking of the motoneuron pool, and the Renshaw cell pool, for these simulations.
Figure 4.
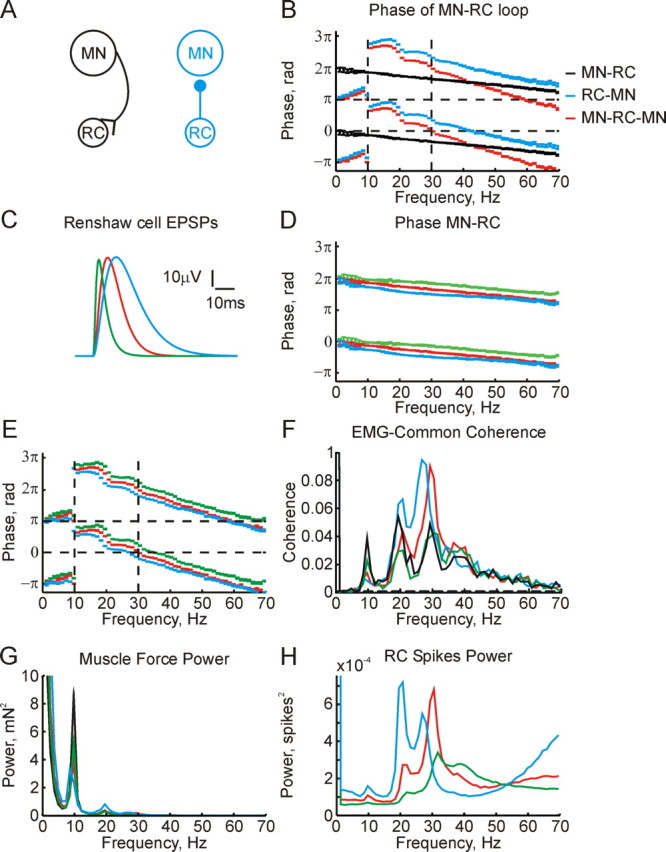
A, Schematic of connectivity in two simulations run to open the feedback loop between Renshaw cells and motoneurons. B, Coherence phase between spikes from the population of Renshaw cells and motoneurons. Black and blue lines correspond to models shown in A. Red line, Sum of phases shown by black and blue lines, estimating the total loop phase. Horizontal dashed lines mark in-phase (0 radians) and anti-phase (π radians); vertical dashed lines mark 10 Hz and 30 Hz frequencies. C, Different EPSP shapes tested in simulations described in the lines of corresponding color in the remainder of the figure. Red EPSP is the same as used in simulations in previous figures. D, Coherence phase between motoneuron and Renshaw cell spikes, for the network shown in black in A. This corresponds to the black line in B, but for the different EPSP widths shown in C. E, Total loop phase, corresponding to the red line in B, for the different EPSP widths shown in C. F, Corticomuscular coherence. G, Force power spectrum. Black line in F and G shows the results for a simulation without Renshaw cells for comparison. H, Power spectrum of Renshaw cell population spiking. Simulations were 4017 s long throughout.
The red line in Figure 4B is the sum of the phases determined from the two open loop simulations. This indicates how motoneurons will influence their own firing via Renshaw cell feedback. Two important features are evident. First, the phase crosses π radians at 10 Hz. At this frequency, oscillations are thus fed back to motoneurons in exact antiphase, leading to cancellation. Second, the phase crosses zero at 30 Hz. The Renshaw cell recurrent feedback loop will thus tend to introduce oscillations at 30 Hz because of loop resonance.
A major component of the time delay introduced by the recurrent feedback loop is the rise time of the EPSPs produced by motoneuron spikes in the Renshaw cells. The remainder of Figure 4 investigates the effects of changing this on the system dynamics. Figure 4C illustrates the three unitary EPSPs tested. The EPSP shown in red is the same as used in the simulations until this point, and best accords with known experimental data. It has a rise time of 8.0 ms. The EPSPs in green and blue have rise times of 3.0 ms and 12.6 ms respectively. Figure 4D shows the impact of changing the EPSP shape on the open-loop phase relationship between motoneuron and Renshaw cell spiking. Figure 4E adds these phase measurements to those for the open-loop simulations including only connections from Renshaw cells to motoneurons, thereby showing a similar plot to the red line of Figure 4B but for different EPSP shapes. In all plots there is a phase discontinuity close to 10 Hz; the location of this is governed by the motoneuron firing rate, and is relatively insensitive to the EPSP time course. The frequency at which the phase crosses zero shifts as the EPSP duration changes. The slowest EPSP leads to a resonant frequency of 27.0 Hz, compared with 35.1 Hz for the EPSP with the fastest rise time.
Figure 4F shows the effect of changing the Renshaw cell dynamics on the corticomuscular coherence. In all cases, the size of the 10 Hz peak is reduced compared with the simulation without Renshaw cells (black line); the extent of this reduction is greatest for the simulation with slowly rising EPSPs. The effect on the 20 Hz corticomuscular coherence peak is considerably altered by the EPSP time course. The fastest EPSP investigated reduced this peak, whereas the slowest augmented it. Finally, the peak around 30 Hz was increased by the slowest EPSP, but left unchanged by the fastest EPSP. This peak was slightly shifted to lower frequencies by lengthening the EPSP duration, as predicted by the loop phase analysis of Figure 4E.
Figure 4G shows the power spectrum of the force from these simulations; it exhibits similar effects to those seen in the corticomuscular coherence. Figure 4H shows the power spectrum of the Renshaw cell spike activity. This clearly demonstrates the shift to lower frequencies of the ∼30 Hz peak as the EPSP is broadened. The 20 Hz peak also grows substantially for the simulation with the slowest EPSP. The reason can be appreciated from the phase display of Figure 4E: the loop phase at 20 Hz is changed from ∼π/2 radians to close to zero by the lengthening of the EPSP duration, extending the range of frequencies over which resonant behavior can be seen.
Further simulations
In the simulations described until this point, the common cortical input to the motoneurons was simulated as Gaussian white noise. However, oscillations at both ∼10 Hz and ∼20 Hz have been reported in the primary motor cortex during sustained contractions (Conway et al., 1995; Kilner et al., 2000; Baker et al., 2003), and it was important to determine how recurrent inhibition would interact with this rhythmic input to the motoneurons. Cortical oscillations were simulated by modulating the common cortical input at 10 Hz and 20 Hz; the independent input remained as Gaussian white noise. Figure 5A shows the corticomuscular coherence calculated between the EMG and modulated cortical input for simulations with (red line) and without RCs (black line). Much larger coherence peaks were seen at 10 Hz and 20 Hz for both simulations when compared with unmodulated cortical input (Fig. 2A), and the strength of tremor, as assessed by the 10 Hz peak in the force power spectrum, was correspondingly larger (Fig. 5B compared with Fig. 2B). However, just as for the simulations with white noise input, recurrent inhibition reduced both corticomuscular coherence at 10 Hz and 20 Hz, and 10 Hz tremor, whereas coherence was increased at 30 Hz.
Figure 5.

A, B, Results from simulations which used a cortical input modulated to contain power-spectral peaks at 10 Hz and 20 Hz. C, D, Results from simulations which omitted PICs from the motoneuron model. Top row (A, C) shows corticomuscular coherence; bottom row (B, D) shows force power spectrum. Black lines relate to simulations without Renshaw cells and red lines to simulations in which they were included. Simulation length throughout was 2880 s.
Our motoneuron model included PICs, which are known to have an important influence on motoneuron properties. To test whether PICs altered the results reported here, we ran some simulations without PICs. This required increasing the level of independent input to the motoneurons to maintain the same discharge rates as previously (independent input 9 times greater than the cortical input, compared with 3.2 times for simulations with PICs). Figure 5C illustrates the corticomuscular coherence calculated for these simulations. Coherence levels were lower than seen previously (Fig. 2A), reflecting the lower fraction of the total motoneuron input which came from the cortex. However, the addition of Renshaw cells had a very similar effect as before: coherence was reduced at 10 and 20 Hz, but raised at 30 Hz. The ∼10 Hz peak in the force power spectrum (Fig. 5D) was also reduced by the addition of Renshaw cells. The action of the recurrent inhibitory loop does not therefore seem to be influenced by the presence or absence of PICs in the motoneurons. This was the case even though the gain of the recurrent inhibitory feedback loop, estimated as described in Materials and Methods, was only 0.058 in the simulations without PICs (compared with 0.1 when PICs were included). It has been shown experimentally that PICs are capable of amplifying the effect of inhibitory inputs (Kuo et al., 2003).
Discussion
Frequencies close to 10 Hz pose a particular difficulty in the control of movement. When motoneurons are first recruited, they begin to fire around this rate (Milner-Brown et al., 1973). The monosynaptic stretch reflex arc has a tendency to oscillate around 10 Hz, and the mechanical resonant frequency of the wrist is also in this region. Input components around 10 Hz thus have the potential powerfully to synchronize motoneuron firing (Matthews, 1997). Muscle acts as a low-pass filter, because of the relatively slow nature of twitch tension production. However, 10 Hz is usually well within the frequency range for production of unfused contractions, meaning that rhythmic discharge of the motoneuron pool at this frequency will produce overt mechanical tremor (Elble and Randall, 1976).
Previous work has suggested that Renshaw cells act to desynchronize motoneurons, possibly reducing physiological tremor (Adam et al., 1978; Windhorst et al., 1978); other authors suggested that recurrent inhibition could synchronize motoneurons (Windhorst, 1996). Using computational modeling, Maltenfort et al. (1998) concluded that recurrent inhibition acted to decorrelate motoneuron firing, reducing the magnitude of both positive and negative correlations between cell pairs toward zero. The amplitude of peaks in the power spectrum of motoneuron population activity was also decreased by recurrent inhibition. Importantly, in the simulations reported by Maltenfort et al. (1998), motoneuron firing rates were generally above 15 Hz. In contrast, we were interested to simulate weak contractions in which many motoneurons fired at around 10 Hz, which is close to the rate at which motor units are first recruited (Milner-Brown et al., 1973). This accentuated the power spectral peaks of motoneuron activity around this critically important frequency, and revealed a marked reduced of synchronization at 10 Hz when recurrent inhibition was added.
In the present work, we have shown that the action of Renshaw cells is different in different frequency ranges. Around the 10 Hz frequency of physiological tremor, synchronous oscillations are fed back to motoneurons in anti-phase, leading to cancellation. In contrast, around 30 Hz the dynamics of the Renshaw cell-motoneuron loop leads to in phase, positive feedback, and a resonant augmentation of this frequency.
Uchiyama and Windhorst (2007) also constructed a model of recurrent inhibition, and used it to investigate the effects on motoneuron synchronization. They concluded that the addition of Renshaw cells to the model tended to increase synchrony in the motoneuron pool. However, examination of their data shows that this effect was most marked when motoneurons fired above 20 Hz. When firing rates were close to 10 Hz, recurrent inhibition tended to decrease motoneuron synchrony. The analysis of synchronization was performed solely in the time domain, and is hence not entirely comparable with the present work, but the results appear broadly compatible with our findings.
Renshaw cells may therefore form part of the neural system for filtering out ∼10 Hz oscillations from motoneuron discharge which was hypothesized to exist by Baker et al. (2003). We found that Renshaw cell feedback could reduce, but not abolish, 10 Hz corticomuscular coherence. In addition, it appears that forearm muscles controlling the fingers, and intrinsic hand muscles, lack Renshaw cells in their motoneuron pools (Katz et al., 1993; Illert and Kümmel, 1999). Yet corticomuscular coherence at ∼10 Hz is also absent in these muscles (Conway et al., 1995; Baker et al., 1997, 2003; Salenius et al., 1997; Kilner et al., 2000). It is most likely therefore that multiple mechanisms exist to reduce ∼10 Hz synchronization of motoneurons, of which Renshaw cell recurrent inhibition is just one example.
The addition of Renshaw cells to a motoneuron pool will partially cancel oscillations not just at ∼10 Hz, but also at lower frequencies (Fig. 4B). Most pathological tremors, including essential tremor, parkinsonian tremor and cerebellar tremor have dominant frequencies below 10 Hz (Elble and Koller, 1990). It is likely therefore that the mechanism described here will also be important in these conditions. If acting normally, Renshaw cell feedback will reduce these tremors, so that their amplitude will be lower than otherwise. It is even possible that a weakening of recurrent inhibition could contribute to tremorigenesis. Whatever the source of pathological oscillatory drive to the motoneurons, we predict that strengthening Renshaw cell feedback should lead to a reduction of tremor amplitude. This suggests a novel avenue of tremor therapy. Previous work has used the drug l-acetylcarnitine to alter Renshaw cell effective connectivity in healthy subjects (Mattei et al., 2003), but no investigations have so far been performed on patients with pathological tremor.
In the model presented here, we focused on recurrent inhibition, via Renshaw cells, because these are well characterized experimentally. However, there are also recurrent excitatory pathways, producing positive feedback to motoneuron pools. This includes monosynaptic motoneuron-to-motoneuron connections (Cullheim et al., 1977, 1984), and also disynaptic connections via a recently discovered novel class of spinal interneurons (Machacek and Hochman, 2006). Full characterization of the effects of these pathways would require their inclusion in our model, based on the known cellular and connection properties. However, it seems reasonable to suppose that they could act oppositely to Renshaw cells, enhancing 10 Hz oscillations. Interestingly, the disynaptic recurrent excitatory pathway is normally suppressed, but can be unmasked by the action of noradrenaline (Machacek and Hochman, 2006). Noradrenaline is released in the spinal cord by projections from the locus ceruleus as part of the “fear–fight–flight” response. It is well known that tremor increases during anxiety. β-Adrenergic agonists such as salbutamol enhance tremor, whereas the β-antagonist propranolol is probably the most effective anti-tremor medication in clinical use. These observations are consistent with tremor amplitude being modulated by the relative balance between recurrent inhibition and recurrent excitation.
The dynamic behavior of the Renshaw cell circuit could provide a reason for their differential distribution across different motoneuron pools. The resonant frequency of human upper limb segments increases in a proximo-distal direction, from ∼6 Hz at the elbow, ∼11 Hz at the wrist to ∼26 Hz for the index finger (Elble and Koller, 1990). Up to the wrist, therefore, mechanical tremor falls within the low-frequency range within which Renshaw cells are effective at tremor cancellation. For the digits, the mechanical resonant frequency instead lies within the range in which the Renshaw cells actually generate oscillations (Fig. 4). Inclusion of recurrent inhibition in motoneuron pools supplying digit muscles would therefore be counter-productive.
The generation of ∼30 Hz rhythms by Renshaw cell feedback is a novel finding. However, in the cerebral cortex, several modeling studies have shown that networks of inhibitory interneurons generating recurrent inhibition can lead to synchronous oscillations in the “gamma” frequency band (Wang and Buzsáki, 1996; Pauluis et al., 1999; Traub et al., 1999; Whittington et al., 2000). A similar mechanism is likely to be operating here. By recording from a patient with paraplegia, Norton et al. (2004) showed that the isolated human spinal cord can generate spontaneous rhythmic muscle discharge. The frequency of these oscillations was ∼16 Hz, somewhat lower than the ∼30 Hz generated by Renshaw cell feedback in our model. However, it is possible that pathological changes in spinal circuitry altered the resonant frequency of the recurrent inhibition in this patient, and that these spinal oscillations were generated by the process which we have described.
Footnotes
This work was funded by the Wellcome Trust and the Medical Research Council (studentship to E.R.W.).
References
- Adam D, Windhorst U, Inbar GF. The effects of recurrent inhibition on the cross-correlated firing patterns of motoneurones (and their relation to signal transmission in the spinal cord-muscle channel) Biol Cybern. 1978;29:229–235. doi: 10.1007/BF00337280. [DOI] [PubMed] [Google Scholar]
- Alvarez FJ, Dewey DE, McMillin P, Fyffe RE. Distribution of cholinergic contacts on Renshaw cells in the rat spinal cord: a light microscopic study. J Physiol. 1999;515:787–797. doi: 10.1111/j.1469-7793.1999.787ab.x. [DOI] [PMC free article] [PubMed] [Google Scholar]
- Asanuma H, Zarzecki P, Jankowska E, Hongo T, Marcus S. Projection of individual pyramidal tract neurons to lumbar motor nuclei of the monkey. Exp Brain Res. 1979;34:73–89. doi: 10.1007/BF00238342. [DOI] [PubMed] [Google Scholar]
- Bakels R, Kernell D. Matching between motoneurone and muscle unit properties in rat medial gastrocnemius. J Physiol. 1993;463:307–324. doi: 10.1113/jphysiol.1993.sp019596. [DOI] [PMC free article] [PubMed] [Google Scholar]
- Baker SN, Lemon RN. A computer simulation study of the production of post-spike facilitation in spike triggered averages of rectified EMG. J Neurophysiol. 1998;80:1391–1406. doi: 10.1152/jn.1998.80.3.1391. [DOI] [PubMed] [Google Scholar]
- Baker SN, Olivier E, Lemon RN. Coherent oscillations in monkey motor cortex and hand muscle EMG show task-dependent modulation. J Physiol. 1997;501:225–241. doi: 10.1111/j.1469-7793.1997.225bo.x. [DOI] [PMC free article] [PubMed] [Google Scholar]
- Baker SN, Spinks R, Jackson A, Lemon RN. Synchronization in monkey motor cortex during a precision grip task. I. Task-dependent modulation in single-unit synchrony. J Neurophysiol. 2001;85:869–885. doi: 10.1152/jn.2001.85.2.869. [DOI] [PubMed] [Google Scholar]
- Baker SN, Pinches EM, Lemon RN. Synchronization in monkey motor cortex during a precision grip task. II. effect of oscillatory activity on corticospinal output. J Neurophysiol. 2003;89:1941–1953. doi: 10.1152/jn.00832.2002. [DOI] [PubMed] [Google Scholar]
- Baker SN, Chiu M, Fetz EE. Afferent encoding of central oscillations in the monkey arm. J Neurophysiol. 2006;95:3904–3910. doi: 10.1152/jn.01106.2005. [DOI] [PubMed] [Google Scholar]
- Booth V, Rinzel J, Kiehn O. Compartmental model of vertebrate motoneurons for Ca2+-dependent spiking and plateau potentials under pharmacological treatment. J Neurophysiol. 1997;78:3371–3385. doi: 10.1152/jn.1997.78.6.3371. [DOI] [PubMed] [Google Scholar]
- Conway BA, Halliday DM, Farmer SF, Shahani U, Maas P, Weir AI, Rosenberg JR. Synchronization between motor cortex and spinal motoneuronal pool during the performance of a maintained motor task in man. J Physiol. 1995;489:917–924. doi: 10.1113/jphysiol.1995.sp021104. [DOI] [PMC free article] [PubMed] [Google Scholar]
- Cullheim S, Kellerth JO, Conradi S. Evidence for direct synaptic interconnections between cat spinal alpha-motoneurons via the recurrent axon collaterals: a morphological study using intracellular injection of horseradish peroxidase. Brain Res. 1977;132:1–10. doi: 10.1016/0006-8993(77)90702-8. [DOI] [PubMed] [Google Scholar]
- Cullheim S, Lipsenthal L, Burke RE. Direct monosynaptic contacts between type-identified alpha-motoneurons in the cat. Brain Res. 1984;308:196–199. doi: 10.1016/0006-8993(84)90937-5. [DOI] [PubMed] [Google Scholar]
- Davies RM, Gerstein GL, Baker SN. Measurement of time-dependent changes in the irregularity of neural spiking. J Neurophysiol. 2006;96:906–918. doi: 10.1152/jn.01030.2005. [DOI] [PubMed] [Google Scholar]
- Elble RJ, Koller WC. Tremor. Baltimore: John Hopkins UP; 1990. [Google Scholar]
- Elble RJ, Randall JE. Motor-unit activity responsible for 8- to 12-Hz component of human physiological finger tremor. J Neurophysiol. 1976;39:370–383. doi: 10.1152/jn.1976.39.2.370. [DOI] [PubMed] [Google Scholar]
- Fritz N, Illert M, Kolb FP, Lemon RN, Muir RB, van der Burg J, Wiedemann E, Yamaguchi T. The cortico-motoneuronal input to hand and forearm motoneurones in the anaesthetized monkey. J Physiol. 1985;366:20P. [Google Scholar]
- Fuglevand AJ, Winter DA, Patla AE. Models of recruitment and rate coding organization in motor-unit pools. J Neurophysiol. 1993;70:2470–2488. doi: 10.1152/jn.1993.70.6.2470. [DOI] [PubMed] [Google Scholar]
- Fyffe REW. Spatial distribution of recurrent inhibitory synapses on spinal motoneurons in the cat. J Neurophysiol. 1991;65:1134–1149. doi: 10.1152/jn.1991.65.5.1134. [DOI] [PubMed] [Google Scholar]
- Halliday DM, Conway BA, Farmer SF, Rosenberg JR. Using electroencephalography to study functional coupling between cortical activity and electromyograms during voluntary contractions in humans. Neurosci Lett. 1998;241:5–8. doi: 10.1016/s0304-3940(97)00964-6. [DOI] [PubMed] [Google Scholar]
- Hamm TM, Sasaki S, Stuart DG, Windhorst U, Yuan CS. The measurement of single motor-axon recurrent inhibitory post-synaptic potentials in the cat. J Physiol. 1987;388:631–651. doi: 10.1113/jphysiol.1987.sp016635. [DOI] [PMC free article] [PubMed] [Google Scholar]
- Hultborn H, Pierrot-Deseilligny E. Input-output relations in the pathway of recurrent inhibition to motoneurones in the cat. J Physiol. 1979;297:27–287. doi: 10.1113/jphysiol.1979.sp013039. [DOI] [PMC free article] [PubMed] [Google Scholar]
- Hultborn H, Pierrot-Deseilligny E, Wigström H. Recurrent inhibition and afterhyperpolarization following motoneuronal discharge in the cat. J Physiol. 1979;297:253–266. doi: 10.1113/jphysiol.1979.sp013038. [DOI] [PMC free article] [PubMed] [Google Scholar]
- Hultborn H, Lipski J, Mackel R, Wigström H. Distribution of recurrent inhibition within a motor nucleus. I. Contribution from slow and fast motor units to the excitation of Renshaw cells. Acta Physiol Scand. 1988a;134:347–361. doi: 10.1111/j.1748-1716.1988.tb08503.x. [DOI] [PubMed] [Google Scholar]
- Hultborn H, Katz R, Mackel R. Distribution of recurrent inhibition within a motor nucleus. II. Amount of recurrent inhibition in motoneurones to fast and slow units. Acta Physiol Scand. 1988b;134:363–374. doi: 10.1111/j.1748-1716.1988.tb08502.x. [DOI] [PubMed] [Google Scholar]
- Illert M, Kümmel H. Reflex pathways from large muscle spindle afferents and recurrent axon collaterals to motoneurones of wrist and digit muscles: a comparison in cats, monkeys and humans. Exp Brain Res. 1999;128:13–19. doi: 10.1007/s002210050812. [DOI] [PubMed] [Google Scholar]
- Katz R, Mazzocchio R, Pénicaud A, Rossi A. Distribution of recurrent inhibition in the human upper limb. Acta Physiol Scand. 1993;149:183–198. doi: 10.1111/j.1748-1716.1993.tb09611.x. [DOI] [PubMed] [Google Scholar]
- Kilner JM, Baker SN, Salenius S, Hari R, Lemon RN. Human cortical muscle coherence is directly related to specific motor parameters. J Neurosci. 2000;20:8838–8845. doi: 10.1523/JNEUROSCI.20-23-08838.2000. [DOI] [PMC free article] [PubMed] [Google Scholar]
- Kuo JJ, Lee RH, Johnson MD, Heckman HM, Heckman CJ. Active dendritic integration of inhibitory synaptic inputs in vivo. J Neurophysiol. 2003;90:3617–3624. doi: 10.1152/jn.00521.2003. [DOI] [PubMed] [Google Scholar]
- Lee RH, Heckman CJ. Essential role of a fast persistent inward current in action potential initiation and control of rhythmic firing. J Neurophysiol. 2001;85:472–475. doi: 10.1152/jn.2001.85.1.472. [DOI] [PubMed] [Google Scholar]
- Li Y, Bennett DJ. Persistent sodium and calcium currents cause plateau potentials in motoneurons of chronic spinal rats. J Neurophysiol. 2003;90:857–869. doi: 10.1152/jn.00236.2003. [DOI] [PubMed] [Google Scholar]
- MacGregor RJ. Neural and brain modelling. New York: Academic; 1987. [Google Scholar]
- Machacek DW, Hochman S. Noradrenaline unmasks novel self-reinforcing motor circuits within the mammalian spinal cord. J Neurosci. 2006;26:5920–5928. doi: 10.1523/JNEUROSCI.4623-05.2006. [DOI] [PMC free article] [PubMed] [Google Scholar]
- Maltenfort MG, Heckman CJ, Rymer WZ. Decorrelating actions of Renshaw interneurons on the firing of spinal motoneurons within a motor nucleus: a simulation study. J Neurophysiol. 1998;80:309–323. doi: 10.1152/jn.1998.80.1.309. [DOI] [PubMed] [Google Scholar]
- Mattei B, Schmied A, Mazzocchio R, Decchi B, Rossi A, Vedel JP. Pharmacologically induced enhancement of recurrent inhibition in humans: effects on motoneurone discharge patterns. J Physiol. 2003;548:615–629. doi: 10.1113/jphysiol.2002.033126. [DOI] [PMC free article] [PubMed] [Google Scholar]
- Matthews PB. Spindle and motoneuronal contributions to the phase advance of the human stretch reflex and the reduction of tremor. J Physiol. 1997;498:249–275. doi: 10.1113/jphysiol.1997.sp021856. [DOI] [PMC free article] [PubMed] [Google Scholar]
- McCurdy ML, Hamm TM. Topography of recurrent inhibitory postsynaptic potentials between individual motoneurons in the cat. J Neurophysiol. 1994;72:214–226. doi: 10.1152/jn.1994.72.1.214. [DOI] [PubMed] [Google Scholar]
- Milner-Brown HS, Stein RB, Yemm R. Changes in firing rate of human motor units during linearly changing voluntary contractions. J Physiol. 1973;230:371–390. doi: 10.1113/jphysiol.1973.sp010193. [DOI] [PMC free article] [PubMed] [Google Scholar]
- Moritz CT, Barry BK, Pascoe MA, Enoka RM. Discharge rate variability influences the variation in force fluctuations across the working range of a hand muscle. J Neurophysiol. 2005;93:2449–2459. doi: 10.1152/jn.01122.2004. [DOI] [PubMed] [Google Scholar]
- Murthy VN, Fetz EE. Coherent 25- to 35-Hz oscillations in the sensorimotor cortex of awake behaving monkeys. Proc Natl Acad Sci U S A. 1992;89:5670–5674. doi: 10.1073/pnas.89.12.5670. [DOI] [PMC free article] [PubMed] [Google Scholar]
- Norton JA, Wood DE, Day BL. Is the spinal cord the generator of 16-Hz orthostatic tremor? Neurology. 2004;62:632–634. doi: 10.1212/wnl.62.4.632. [DOI] [PubMed] [Google Scholar]
- Pauluis Q, Baker SN, Olivier E. Emergent oscillations in a realistic network: the role of inhibition and the effect of the spatiotemporal distribution of the input. J Comput Neurosci. 1999;6:27–48. doi: 10.1023/a:1008804916112. [DOI] [PubMed] [Google Scholar]
- Porter R, Lemon RN. Corticospinal function and voluntary movement. Oxford: Oxford UP; 1993. [Google Scholar]
- Rack PM, Westbury DR. The effects of length and stimulus rate on tension in the isometric cat soleus muscle. J Physiol. 1969;204:443–460. doi: 10.1113/jphysiol.1969.sp008923. [DOI] [PMC free article] [PubMed] [Google Scholar]
- Renshaw B. Influence of discharge of motoneurons upon excitation of neighbouring motoneurons. J Neurophysiol. 1941;4:167–183. [Google Scholar]
- Rosenberg JR, Amjad AM, Breeze P, Brillinger DR, Halliday DM. The Fourier approach to the identification of functional coupling between neuronal spike trains. Prog Biophys Mol Biol. 1989;53:1–31. doi: 10.1016/0079-6107(89)90004-7. [DOI] [PubMed] [Google Scholar]
- Salenius S, Portin K, Kajola M, Salmelin R, Hari R. Cortical control of human motoneuron firing during isometric contraction. J Neurophysiol. 1997;77:3401–3405. doi: 10.1152/jn.1997.77.6.3401. [DOI] [PubMed] [Google Scholar]
- Stein RB, Oguztoreli MN. Modification of muscle responses by spinal circuitry. Biol Cybern. 1984;11:231–240. doi: 10.1016/0306-4522(84)90226-4. [DOI] [PubMed] [Google Scholar]
- Traub RD, Jeffreys JGR, Whittington MA. Fast oscillations in cortical circuits. Cambridge, MA: MIT; 1999. [Google Scholar]
- Uchiyama T, Windhorst U. Effects of spinal recurrent inhibition on motoneuron short-term synchronization. Biol Cybern. 2007;96:561–575. doi: 10.1007/s00422-007-0151-7. [DOI] [PubMed] [Google Scholar]
- Van Keulen LCM. Autogenetic recurrent inhibition of individual spinal motoneurons of the cat. Neurosci Lett. 1981;21:297–300. doi: 10.1016/0304-3940(81)90220-2. [DOI] [PubMed] [Google Scholar]
- Walmsley B, Tracey DJ. An intracellular study of Renshaw cells. Brain Res. 1981;223:170–175. doi: 10.1016/0006-8993(81)90818-0. [DOI] [PubMed] [Google Scholar]
- Wang XJ, Buzsáki G. Gamma oscillation by synaptic inhibition in a hippocampal interneuronal network model. J Neurosci. 1996;16:6402–6413. doi: 10.1523/JNEUROSCI.16-20-06402.1996. [DOI] [PMC free article] [PubMed] [Google Scholar]
- Wani AM, Guha SK. A model for gradation of tension–recruitment and rate coding. Med Biol Eng. 1975;13:870–875. doi: 10.1007/BF02478091. [DOI] [PubMed] [Google Scholar]
- Whittington MA, Traub RD, Kopell N, Ermentrout B, Buhl EH. Inhibition-based rhythms: experimental and mathematical observations on network dynamics. Int J Psychophysiol. 2000;38:315–336. doi: 10.1016/s0167-8760(00)00173-2. [DOI] [PubMed] [Google Scholar]
- Williams ER, Baker SN. Circuits generating corticomuscular coherence investigated using a biophysically based computational model. I. Descending systems. J Neurophysiol. 2009;101:31–41. doi: 10.1152/jn.90362.2008. [DOI] [PMC free article] [PubMed] [Google Scholar]
- Windhorst U. On the role of recurrent inhibitory feedback in motor control. Prog Neurobiol. 1996;49:517–587. doi: 10.1016/0301-0082(96)00023-8. [DOI] [PubMed] [Google Scholar]
- Windhorst U, Adam D, Inbar GF. The effects of recurrent inhibitory feedback in shaping discharge patterns of motoneurones excited by phasic muscle stretches. Biol Cybern. 1978;29:221–227. doi: 10.1007/BF00337279. [DOI] [PubMed] [Google Scholar]
- Witham CL, Baker SN. Network oscillations and intrinsic spiking rhythmicity do not covary in monkey sensorimotor areas. J Physiol. 2007;580:801–814. doi: 10.1113/jphysiol.2006.124503. [DOI] [PMC free article] [PubMed] [Google Scholar]
- Zajac FE, Faden JS. Relationship among recruitment order, axonal conduction velocity, and muscle-unit properties of type-identified motor units in cat plantaris muscle. J Neurophysiol. 1985;53:1303–1322. doi: 10.1152/jn.1985.53.5.1303. [DOI] [PubMed] [Google Scholar]