

Abstract
Objective:
To investigate interhemispheric and intrahemispheric reorganization in patients with localization-related epilepsy.
Method:
We studied 50 patients with a left hemispheric focus and 20 normal right-handed controls with a 3T echoplanar imaging blood oxygen level dependent functional MRI auditory-based word definition decision task. Data were analyzed using SPM 2. Using region of interest for Broca and Wernicke areas and an asymmetry index (AI), patients were categorized as left language (LL; AI ≥0.20) or atypical language (AL; AI <0.20) for region. The point maxima activation for normal controls (p <0.05 corrected FDR) was identified in Broca and midtemporal regions and then used as a point of reference for individual point maxima identified at p < 0.001, uncorrected.
Results:
Patient groups showed increased frequency of having activation in right homologues. Activation in AL groups occurred in homologous right regions; distances for point maxima activation in homologous regions were the same as point maxima distances in normal control activation in left regions. Distances for LL patient in left regions showed a trend for differences for midtemporal gyrus (6 mm posterior, 3 mm superior) but variability around mean difference distance was significant. There was no effect of age at epilepsy onset, duration, or pathology on activation maxima.
Conclusions:
Right hemisphere language regions in patients with left hemispheric focus are homologues of left hemisphere Broca and broadly defined Wernicke areas. We found little evidence for intrahemispheric reorganization in patients with left hemisphere epilepsy who remain left language dominant by these methods.
GLOSSARY
- AI
= asymmetry index;
- AL
= atypical language;
- BA
= Brodmann area;
- ECS
= electrocortical stimulation;
- fMRI
= functional MRI;
- IFG
= inferior frontal gyrus;
- LHF
= left hemispheric focus;
- LL
= left language;
- MANOVA
= multivariate analysis of variance;
- MTG
= midtemporal gyrus;
- STG
= superior temporal gyrus;
- STS
= superior temporal sulcus.
The ability to process language typically resides in the left hemisphere.1,2 Atypical language dominance occurs in 4%–6% of the normal right-handed population and 22%–24% of normal left-handed individuals.3,4 MRI is effective in determining language lateralization as well as identifying the location of language processing areas.5,6 Functional MRI (fMRI) may also be used to describe the effects of epilepsy on language networks as well as assisting in presurgical planning.7–9 Patients with epilepsy, regardless of handedness, have a high likelihood of atypical language.3,10,11 Early cortical injury or epileptic activity may ultimately lead to language reorganization.11,12 The younger the brain insult, if focal, the more likely the reorganization of language functions occurs with preservation of function.2,13 Patients with a seizure focus in the left temporal lobe are more likely to have language activation in the right hemisphere.3,14–16
Right hemisphere compensation has been attributed to homologous receptive and expressive regions.9,17–20 Some studies suggest a higher likelihood of interhemispheric reorganization with earlier onset and certain pathologic substrates. Nevertheless, the degree and location of activation in the right hemisphere is not well documented. Intrahemispheric reorganization of language has been described using electrocortical stimulation (ECS), but mainly in patients with relatively late onset epilepsy, and no normative ECS data exist for comparison.21,22 We hypothesized that a dominant hemisphere epileptic disturbance would cause an interhemispheric shift in language organization restricted to right homologues and that we would identify intrahemispheric reorganization within the dominant hemispheric in patients with a left hemisphere focus who remained left language dominant.
METHODS
Participants.
We studied 20 right-handed native English-speaking normal volunteers (mean age 27.4 years [range 21-56]; 12 men, 8 women) and 50 patients undergoing presurgical evaluation, all of whom had a left hemisphere seizure focus determined through clinical assessment, ictal video-EEG monitoring, and MRI. The patients were divided into two groups based on language representation (see below). In the typical left language group (LL), 17 were male and 16 were female; the mean age at study was 22.6 (range 8.5–35), and mean age at seizure onset was 13.0 years (range 1–29.5). In the group with atypical language (AL), 9 were male and 8 were female; the mean age at study was 21.7 years (range 8.5–45), and mean age at seizure onset was 9.4 years (range 0.9–38). Additional patient details are available in the e-Methods on the Neurology® Web site at www.neurology.org.
Language dominance was established by analyzing individual maps at p < 0.001 using regions of interest23 based on the Wake Forrest PICK Atlas and employing the AI toolbox adapted for SPM 224,25 for Wernicke's area broadly defined along superior temporal sulcus (STS) (Brodmann areas [BA] 21, 22, 39, superior temporal gyrus [STG], midtemporal gyrus [MTG]) and Broca area (BA 44, 45, 47, inferior frontal gyrus [IFG]). An asymmetry index (AI) was calculated for each region where AI = (L − R)/(L + R). LL dominance for each region was defined as AI ≥0.20; AL was defined as regional AI <0.20. Patients were classified as having atypical language when one or more regions was right dominant (AI <−0.20), or both regions were bilateral (AI <|0.20|).24 Images were also reviewed visually to assure no right activation in participants rated as left dominant for language that would indicate atypical dominance. Regional rather than hemispheric voxel counts are thought to be a more specific means for determining language dominance by excluding activation not critical to language processing.26 As not all individuals had activation in a given region, 16 normal controls, 28 LL patients, and 11 AL patients were used in the MTG analysis. Fifteen normal controls, 26 LL patients, and 16 AL patients were used in the IFG analysis (for details, see e-Methods).
All patients were native English speakers except for one, who was fluent in English. The protocol for this study was in accord with the Declaration of Helsinki and approved by the Institutional Review Board of the National Institute of Neurological Disorders and Stroke of the National Institutes of Health. All participants provided informed consent, and, where appropriate, informed assent.
Functional MRI acquisition.
Data were acquired at 3.0 T using echoplanar imaging blood oxygen level dependent techniques. Acquisition methods have been described previously (e-Methods).24 We used an Auditory Description Decision Task analyzed using SPM 2 normalized on the MNI atlas image. Group data were displayed at FDR <0.05 corrected and individual data sets at p < 0.001 uncorrected. The task required a semantic decision (true/false) to an aurally presented word definition, e.g., “a large gray animal is an elephant”; the control condition consisted of reverse speech with a tone identification. Images were acquired for five cycles (30 seconds per hemicycle).
Euclidean measurements.
The group map of the normal participants provided the expected activation map for the task (figure 1). We identified the point maxima for two areas implicated in language processing for this task: the MTG (BA 21; −52, −30, −8) and the left IFG (BA 44/45; −44, 30, 18). Homologous voxels were defined on the right side of the brain by reversing the sign of the x coordinate ([52, −30, −8] and [44, 30, 18] for the two regions). Each participant's activated voxel with the closest individual distance to the group map voxel for each area was identified and mean distances were calculated. An adaptation of the Cartesian coordinate distance formula was used.27 Voxel coordinates were confined to STG/MTG and IFG. This method of finding the Euclidean distances was applied to the LL and AL populations. Maxima beyond the gyrus adjacent to these regions were not included and were within the territory identified by ECS studies for within-hemisphere reorganization.21

Figure 1 Activation areas
SPM group map, normal volunteers, FDR p < 0.05 corrected. Left side of image is left brain.
Statistical analyses were performed using the SPSS Windows software to determine any differences among control and patient groups (LL and AL) in average distance from the point maxima for each region of interest. Group comparisons were made using a multivariate analysis of variance (MANOVA) with group as a between-subjects variable. Post hoc analyses for planned comparisons were conducted using t tests. Separate MANOVAs were conducted for activation in dominant and nondominant IFG and MTG. Multiple regression was used to determine whether group variance within the patient population was attributable to clinical factors age, age at seizure onset, age at onset of pathology, and pathology (dummy coded). Developmental tumors and dysplasia were considered present at birth; mesial temporal sclerosis onset was recorded as time of febrile seizure or CNS infection. A 2 (language dominance) × 4 (pathology) analysis of variance was planned to determine if differences in distances between the LL and AL groups were dependent on pathology; however, insufficient sample sizes per cell precluded this analysis.
RESULTS
SPM group map (FDR corrected p < 0.05) for the normal controls shows expected activation for task predominantly along the dominant left STS (primarily MTG, BA 21), left IFG (BA 44, 45) extending into left midfrontal gyrus (BA 46), left fusiform gyrus/inferior temporal gyrus (BA 37), left thalamus, left caudate, mesial left frontal gyrus, and lesser activation in right IFG and right fusiform (figure 1, table e-1).
The left hemisphere for the normal controls and LL patients and the right hemisphere for atypical patients were defined as the dominant hemisphere for language for their respective groups. As several patients had substantial brain abnormalities (e.g., stroke), the point maxima were derived from native rather than normalized space (examples of individual patients with typical and atypical language patterns are shown in figure 2).

Figure 2 Activation comparisons
Individual patient activation maps. (A) 21-year-old with left temporal lobe epilepsy, left hemisphere dominant for language. (B) 15-year-old with left frontal lobe focus and history of stroke at age 5 years, atypical language dominance. (C) 19-year-old with left temporal lobe focus, right hemisphere dominant for language. Left side of image is left brain.
A subset of 10 normal volunteers was analyzed in both normalized and native space to determine if point maxima would be altered by normalization procedures; no differences were found. Subsequently, all normal volunteers were normalized into standard space, a step needed to generate a group map, and all patients were coregistered to native space.
Midtemporal gyrus.
Pairwise comparisons for the LL group point maxima and the normal control group map maxima in the dominant MTG showed no difference in mean overall distance; however, specific analyses examining mean distance in each specific direction showed a trend in the superior-inferior plane (z direction) (p = 0.062) and in the anterior-posterior plane (y direction) compared to normal controls (p = 0.057) (table, table e-2). The LL patient group was, on average, 6 mm posterior and 3 mm superior to the normal group. In addition, variability around the mean distance in the z direction was different between the two groups (p < 0.05). There were no differences in the proportion of any group who had activation in dominant or homologue regions (χ2, p > 0.05; table). The AL group point maxima in the right MTG was comparable in location to the homologous maxima in the left MTG for normal controls and mean distances were not different (figure 3, table e-2).
Table Results by group
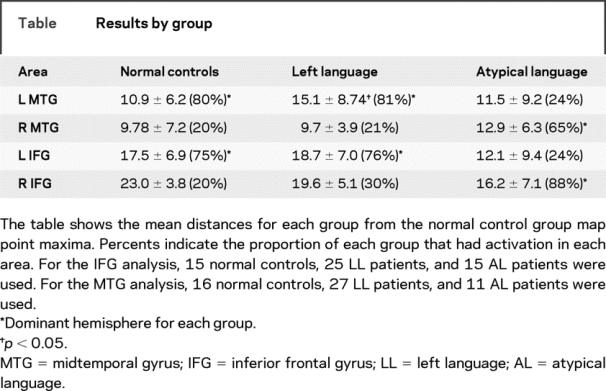

Figure 3 Graph of groups
Graph of individual point maxima for three groups: normal (blue circles) (orange star is normal group point maxima), left language (LL, green), and atypical language (AT, red). Shape for patients represents MRI/pathologic findings. Top (A) midtemporal gyrus (MTG) group point maxima (−52, −30 −8). Bottom (B) inferior frontal gyrus (IFG) group point maxima (−44, 30, 18). MTS = mesial temporal sclerosis.
Inferior frontal gyrus.
Pairwise comparisons between the normal controls, AL, and LL patient groups showed no significant difference between the distances to the group map maxima (table, table e-2). Additionally, no significant differences were found in any one direction (x, y, or z). Variability around the mean distance in the z direction was not different between the two groups. The AL group point maxima in the right IFG was comparable in location to normal control maxima homologue (figure 3). There were no differences among groups with number of individuals with activation in dominant or nondominant homologues (χ2, p > 0.05; table).
Activation for the one LL patient who spoke Korean as the native language (but acquired English early in life and spoke fluently) was examined on an individual basis to assess any abnormality in activation pattern. Activation patterns for secondarily learned languages are still debated and vary considerably with the proficiency, age at initial acquisition, and the language itself.28 Activation for this patient was within the normal English-speaking data for IFG and MTG, and was not an outlier. The less pronounced nondominant MTG activation lay within a single SD of the mean distance from the nondominant homolog MTG group map maxima.
Clinical factors.
Previous studies describe an effect of MRI findings and pathology on the likelihood of exhibiting atypical language.11 In the present study, no significant differences in mean distance from the point maxima for either region were found based on pathology, seizure focus, or age at seizure or pathology onset for any group (table e-3). Although insufficient sample size per cell prevented determination of whether displacement from the normal peak activation was determined by the interaction of pathology and language dominance, three outliers that had displacement at 25 mm or more all had underlying structural pathology (one mesial temporal sclerosis, one tumor, and one stroke).
DISCUSSION
We found that fMRI activation patterns for receptive and expressive language processing in patients with localization-related epilepsy with atypical language dominance occur in the right hemisphere homologues of IFG and MTG. These regions underlie interhemispheric reorganization or compensation. In contrast, we found little evidence for intrahemispheric reorganization of language processing with our methods. If a transfer of language processing to the right hemisphere occurs, our data suggest that activation will tightly cluster around the maxima that mirror the left hemisphere.
The normal participants in the study were all right-handed and, as expected, their activation as a group was heavily left dominant for the language task. Results confirmed those obtained with similar, covert, unmonitored paradigms.24 Activation was concentrated for the normal subjects in dominant MTG for receptive language and IFG for expressive language. Group maps provide expected patterns of activation for task against which individual patient data may be compared. Heterogeneity among normal and patient populations make group analysis and comparisons problematic.29 Therefore, it is necessary to conduct studies of reorganization in patient populations on an individual basis. The degree of normal intersubject variability for distance from point maxima was similar to that reported for verbal fluency, but greater than that found in primary motor or sensory cortex.16,27,30
Epilepsy, or its underlying causes, may exert a regional effect on language processing when disease severity is insufficient to shift language processing to the contralateral hemisphere.8 The small increase in distance and displacement posteriorly among the LL patients and difference in distance SD provides modest evidence for greater dispersion of receptive language processing. The magnitude of our findings, however, is modest. The error in coregistration and employment of smoothing introduce a margin of error approximating the findings described here.27,31 In contrast, electrocorticography studies find object naming disruption at greater distances from anticipated areas, suggesting more profound effects of the seizure focus.21,22 However, these studies lack control groups for interpretation of findings.
One fifth of our normal group demonstrated some activation in the right MTG at the thresholds employed in this study. Yet this activation was widely variable and may be due to nonspecific or other nonlinguistic aspects of auditory speech processing.32,33 Activation in right MTG for LL and AL patients resembled that of the normal group for left MTG. Penetrance of activation—the fraction of the study group showing activation in a given area at a set threshold27—did not differ across groups. The proximity of activation maxima suggests that the nondominant MTG region organizes and functionally performs similar to its dominant hemisphere counterpart.
There are mixed results reported in studies that have examined reorganization of language processing in frontal regions. One fMRI verbal fluency study found activation in LIFG homologues in the right. The degree of shifted laterality of activation in IFG correlated to the extent of periventricular white matter injury in a small group (n = 5) of patients with perinatal injury.19 In contrast, a recent study of epilepsy populations (n = 12) described greater posterior activation in the right also for verbal fluency.16 The reported differences may be attributable to outliers in the latter study as most patients' activation maxima fell within the bounds of the normal data. Differences between studies may also derive from patients with later onset epilepsy or brain injury and reflect maturational constraints on reorganization in relation to age at injury or epilepsy onset. Latter injury may result in compensation that is more anomalous.21,22 For those with atypical language, epilepsy onset or brain injury in our population always occurred before age 6 years. In a study of 102 patients with left hemisphere focus, atypical language occurred with epilepsy onset, history of brain insult, or developmental lesion, all present before age 6 years; 3% had atypical language without a history of risk factors and represent the expected finding of atypical language in normal right-handed populations.11 Insufficient sample size across both pathology and language dominance precludes us from reliably testing for the interaction of pathology by language dominance; however, single case observations suggest that the most displaced activation occurred in patients with structural pathology.
We found no evidence for intrahemispheric relocation of language in the IFG, although we did find an intrahemispheric shift in the temporal lobe as well as increased dispersion of point maxima for the temporal region. Findings confined to the temporal area may be because most of our LL patients had temporal lobe epilepsy. The results may reflect a more pronounced local effect on cognitive networks and a less specific remote effect in IFG. However, our study did not have a sufficient number of patients to determine the effect of a frontal lobe focus on language organization to confirm this observation.
Our group included a variety of underlying pathologic substrates that may of themselves also influence the expression of language processing systems. A previous fMRI study described atypical language dominance in all patients with left middle cerebral stroke and in one fifth of patients with mesial temporal sclerosis.11 It is likely that the greater variability, or dispersal, in point maxima is related to epilepsy or underlying causes. However, we can only provide preliminary glimpses into these effects as our subgroup sample size based on pathologic substrate precludes systematic or conclusive analysis of these factors on intrahemispheric reorganization. The severity and onset of the epilepsy could also be responsible for determining whether language fully shifts to the right hemisphere. Other fMRI studies support the notion that interictal and ictal activity emanating from the left temporal lobe may have deleterious effects on activation patterns in left temporal lobe epilepsy on temporal and frontal regions.7,12,34
We did not explore differences in activation outside IFG and MTG regions of interest and immediately adjacent tissue. It is possible that reorganization occurs in areas remote to and outside these areas. Regions of interest–based methods are constrained by a priori assumptions, visual methods are subjective, and group SPM analysis methods lose patient heterogeneity.29 However, there may be other methods for individual image data utilizing group maps to extract this information as proposed by recent investigations.29,35–37 These approaches employ a voxel-based comparison of an individual against a group map as has been successfully performed in structural MRI investigations in epilepsy.38 Such analyses may identify individual differences outside these areas, and then may allow for subset analysis of similar atypical patterns; these data may then provide insight to neural plasticity or compensation by invocation of alternative, less effective, cognitive/neural strategies to perform a given task.29
We found the compensation for processing language in the setting of left-sided seizure focus and pathologic substrate occurs in restricted areas of right homologues. We found little evidence for intrahemispheric reorganization or compensation. It is not possible, however, to determine whether our findings represent interhemispheric reorganization or developmental persistence in the traditionally nondominant hemisphere. Behavioral evidence finds more complete recovery with earlier focal injury2,13 and fMRI language imaging studies in epilepsy populations describe atypical language above expected only in patients with history of epilepsy onset or brain insult before age 6 years.11 The similarity in homologous location and the similarity of regions activated might be taken as evidence to support the latter possibility, at least for when disease onset occurs early in life.
ACKNOWLEDGMENT
The authors thank John Siedel, Sarah Stephens, and Alexander Zeitchick for assistance in preparing the manuscript and the patients and families who participated in their studies.
Supplementary Material
Address correspondence and reprint requests to Dr. William Davis Gaillard, Department of Neuroscience, Children's National Medical Center, 111 Michigan Ave. NW, Washington, DC 20010 wgaillar@cnmc.org
Supplemental data at www.neurology.org
*These authors contributed equally.
Supported by NINDS R01 NS44280, the American Academy of Neurology Summer fellowship award (J.Z.), and the NINDS Division of Intramural Research.
Disclosure: The authors report no disclosures.
Received June 17, 2008. Accepted in final form February 19, 2009.
REFERENCES
- 1.Geschwind N. The organization of the language and the brain. Science 1970;170:940–944. [DOI] [PubMed] [Google Scholar]
- 2.Muller RA, Courchesne E. The Duplicity of Plasticity: A Conceptual Approach to the Study of Early Lesion and Developmental Disorders. New York: Cambridge UP; 2000. [Google Scholar]
- 3.Springer JA, Binder JR, Hammeke TA, et al. Language dominance in neurologically normal and epilepsy subjects: a functional MRI study. Brain 1999;122:2033–2046. [DOI] [PubMed] [Google Scholar]
- 4.Szaflarski JP, Binder JR, Possing ET, McKiernan KA, Ward BD, Hammeke TA. Language lateralization in left-handed and ambidextrous people: fMRI data. Neurology 2002;59:238–244. [DOI] [PubMed] [Google Scholar]
- 5.Medina LS, Bernal B, Dunoyer C, et al. Seizure disorders: functional MR imaging for diagnostic evaluation and surgical treatment: prospective study. Radiology 2005;236:247–253. [DOI] [PubMed] [Google Scholar]
- 6.Gaillard WD. Functional MR imaging of language, memory, and sensorimotor cortex. Neuroimaging Clin N Am 2004;14:471–485. [DOI] [PubMed] [Google Scholar]
- 7.Billingsley RL, McAndrews MP, Crawley AP, Mikulis DJ. Functional MRI of phonological and semantic processing in temporal lobe epilepsy. Brain 2001;124:1218–1227. [DOI] [PubMed] [Google Scholar]
- 8.Berl MM, Balsamo LM, Xu B, et al. Seizure focus affects regional language networks assessed by fMRI. Neurology 2005;65:1604–1611. [DOI] [PubMed] [Google Scholar]
- 9.Thivard L, Hombrouck J, du Montcel ST, et al. Productive and perceptive language reorganization in temporal lobe epilepsy. Neuroimage 2005;24:841–851. [DOI] [PubMed] [Google Scholar]
- 10.Briellmann RS, Wellard RM, Jackson GD. Seizure-associated abnormalities in epilepsy: evidence from MR imaging. Epilepsia 2005;46:760–766. [DOI] [PubMed] [Google Scholar]
- 11.Gaillard WD, Berl MM, Moore EN, et al. Atypical language in lesional and nonlesional complex partial epilepsy. Neurology 2007;69:1761–1771. [DOI] [PubMed] [Google Scholar]
- 12.Janszky J, Mertens M, Janszky I, Ebner A, Woermann FG. Left-sided interictal epileptic activity induces shift of language lateralization in temporal lobe epilepsy: an fMRI study. Epilepsia 2006;47:921–927. [DOI] [PubMed] [Google Scholar]
- 13.Bates E, Roe K. Language development in children with unilateral brain injury. In: Nelson CA, Luciano M, eds. Handbook of Developmental Cognitive Neuroscience. Cambridge, MA: MIT Press; 2001. [Google Scholar]
- 14.Adcock JE, Wise RG, Oxbury JM, Oxbury SM, Matthews PM. Quantitative fMRI assessment of the differences in lateralization of language-related brain activation in patients with temporal lobe epilepsy. Neuroimage 2003;18:423–438. [DOI] [PubMed] [Google Scholar]
- 15.Liegeois F, Connelly A, Cross JH, et al. Language reorganization in children with early-onset lesions of the left hemisphere: an fMRI study. Brain 2004;127:1229–1236. [DOI] [PubMed] [Google Scholar]
- 16.Voets NL, Adcock JE, Flitney DE, et al. Distinct right frontal lobe activation in language processing following left hemisphere injury. Brain 2006;129:754–766. [DOI] [PubMed] [Google Scholar]
- 17.Weiller C, Isensee C, Rijntjes M, et al. Recovery from Wernicke's aphasia: a positron emission tomographic study. Ann Neurol 1995;37:723–732. [DOI] [PubMed] [Google Scholar]
- 18.Mimura M, Kato M, Kato M, et al. Prospective and retrospective studies of recovery in aphasia. Changes in cerebral blood flow and language functions. Brain 1998;121:2083–2094. [DOI] [PubMed] [Google Scholar]
- 19.Staudt M, Lidzba K, Grodd W, Wildgruber D, Erb M, Krageloh-Mann I. Right-hemispheric organization of language following early left-sided brain lesions: functional MRI topography. Neuroimage 2002;16:954–967. [DOI] [PubMed] [Google Scholar]
- 20.Taylor KI, Regard M. Language in the right cerebral hemisphere: contributions from reading studies. News Physiol Sci 2003;18:257–261. [DOI] [PubMed] [Google Scholar]
- 21.Ojemann G, Ojemann J, Lettich E, Berger M. Cortical language localization in left, dominant hemisphere: an electrical stimulation mapping investigation in 117 patients. J Neurosurg 1989;71:316–326. [DOI] [PubMed] [Google Scholar]
- 22.Devinsky O, Perrine K, Llinas R, Luciano DJ, Dogali M. Anterior temporal language areas in patients with early onset of temporal lobe epilepsy. Ann Neurol 1993;34:727–732. [DOI] [PubMed] [Google Scholar]
- 23.Bunge SA, Dudukovic NM, Thomason ME, Vaidya CJ, Gabrieli JD. Immature frontal lobe contributions to cognitive control in children: evidence from fMRI. Neuron 2002;33:301–311. [DOI] [PMC free article] [PubMed] [Google Scholar]
- 24.Gaillard WD, Balsamo L, Xu B, et al. Language dominance in partial epilepsy patients identified with an fMRI reading task. Neurology 2002;59:256–265. [DOI] [PubMed] [Google Scholar]
- 25.Wilke M, Lidzba K. LI-tool: a new toolbox to assess lateralization in functional MR-data. J Neurosci Methods 2007;163:128–136. [DOI] [PubMed] [Google Scholar]
- 26.Spreer J, Arnold S, Quiske A, et al. Determination of hemisphere dominance for language: comparison of frontal and temporal fMRI activation with intracarotid Amytal testing. Neuroradiol 2002;44:467–474. [DOI] [PubMed] [Google Scholar]
- 27.Xiong J, Rao S, Jerabek P, et al. Intersubject variability in cortical activations during a complex language task. Neuroimage 2000;12:326–339. [DOI] [PubMed] [Google Scholar]
- 28.Chee MW, Caplan D, Soon CS, et al. Processing of visually presented sentences in Mandarin and English studied with fMRI. Neuron 1999;23:127–137. [DOI] [PubMed] [Google Scholar]
- 29.Berl MM, Vaidya CJ, Gaillard WD. Functional imaging of developmental and adaptive changes in neurocognition. Neuroimage 2006;30:679–691. [DOI] [PubMed] [Google Scholar]
- 30.Burton MW, Noll DC, Small SL. The anatomy of auditory word processing individual variability. Brain Lang 2001;77:119–131. [DOI] [PubMed] [Google Scholar]
- 31.Burgund ED, Kang HC, Kelly JE, et al. The feasibility of a common stereotactic space for children and adults in fMRI studies of development. Neuroimage 2002;17:184–200. [DOI] [PubMed] [Google Scholar]
- 32.Ross ED, Mesulam MM. Dominant language functions of the right hemisphere? Prosody and emotional gesturing. Arch Neurol 1979;36:144–148. [DOI] [PubMed] [Google Scholar]
- 33.Beeman M. Semantic processing in the right hemisphere may contribute to drawing inferences from discourse. Brain Lang 1993;44:80–120. [DOI] [PubMed] [Google Scholar]
- 34.Weber B, Wellmer J, Reuber M, et al. Left hippocampal pathology is associated with atypical language lateralization in patients with focal epilepsy. Brain 2006;129:346–351. [DOI] [PubMed] [Google Scholar]
- 35.Turkeltaub PE, Flowers DL, Verbalis A, Miranda M, Gareau L, Eden GF. The neural basis of hyperlexic reading: an fMRI case study. Neuron 2004;41:11–25. [DOI] [PubMed] [Google Scholar]
- 36.Fair DA, Brown TT, Petersen SE, Schlaggar BL. fMRI reveals novel functional neuroanatomy in a child with perinatal stroke. Neurology 2006;67:2246–2249. [DOI] [PubMed] [Google Scholar]
- 37.Seghier ML, Friston KJ, Price CJ. Detecting subject-specific activations using fuzzy clustering. Neuroimage 2007;36:594–605. [DOI] [PMC free article] [PubMed] [Google Scholar]
- 38.Rugg-Gunn FJ, Eriksson SH, Boulby PA, Symms MR, Barker GJ, Duncan JS. Magnetization transfer imaging in focal epilepsy. Neurology 2003;60:1638–1645. [DOI] [PubMed] [Google Scholar]
Associated Data
This section collects any data citations, data availability statements, or supplementary materials included in this article.