Abstract
Water volume has impact when the compound has low aqueous solubility. For example, the absorption of compounds with a Biopharmaceutics Classification System class 2 or 4 is likely to be solubility-limited. Provided the formulation does not contribute to a dissolution-limited condition (e.g., particle size, Waterman and Sutton, J Control Release 86:293–304, 2003) and permeability is rapid, any impact on solubility factors in the gastrointestinal (GI) tract will directly impact the fraction absorbed These factors are in situ solubility, precipitation, and volume of water. Using GastroPlus™, models were developed with literature values of water volume in the small (SIWV) and large (LIWV) intestines for several solubility limited compounds. One or more models were developed for the mean plasma concentration-time profile of each compound. The consistency of the models with known literature and experimental data for the compounds’ solubility and precipitation was determined. The SIWV associated with best fits of solubility limited compounds averaged about 130 ml, with a range of 10–150 ml in the fasted state. The average LIWV in the fasted state was about 10 ml and ranged as large as 125 ml. The wide range of individual LIWV values is likely due to variability in pharmacokinetics, permeability, GI transit, and the observation that data set was collected during a “snapshot in time”. The preferred values of 10% organ volume for small intestine and 1–10% organ volume for large intestine are recommended in lieu of the GastroPlus default values of 40% and 10%, respectively.
Key words: biopharmaceutics, intestinal water, modeling, simulation
INTRODUCTION
Water volume has impact when the compound has low aqueous solubility. For example, the absorption of compounds with a Biopharmaceutics Classification System class 2 or 4 is likely to be solubility-limited. Provided the formulation does not contribute to a dissolution-limited condition (e.g., particle size (1)) and permeability is rapid, any impact on solubility factors in the gastrointestinal (GI) tract will directly impact the fraction absorbed (Fa). These factors are in situ solubility, precipitation, and volume of water.
The baseline volume of GI water can be critical for compounds with low aqueous solubility, products consisting of low aqueous solubility polymers and solubility improving formulations. Some experts estimate the percentage of developing compounds with a low aqueous solubility at 35–40% (2). With the maturity of computer modeling programs, in silico studies are expected to increase in number and sophistication as the costs of in vitro and in vivo experiments rise, against mounting pressure to decrease costs, and, for the accurate modeling of the oral absorption of these compounds and formulations, the GI water volume needs to be accurately known.
Methods for measuring intestinal water volume have evolved from postmortem work (3) to the use of isotopes (4) to the present rather sophisticated magnetic resonance imaging (MRI) (5). Using the magnetic resonance cholangiopancreatography technique, Marciani and coworkers measured the small intestine water volume (SIWV) in one group of 26 control subjects as 90 ml (range 10–250 ml) (6) and in a different group of 16 normals as 165 ml (range 25–350 ml) (7).
Schiller reported finding discrete pockets of water in the small and large intestine of 12 healthy subjects with MRI (8). The small intestine contained a total water volume of 105 ml (range 45–319 ml), distributed among four pockets (range 2–8). The large intestine water volume (LIWV) was 13 ml (range 1–44 ml) distributed among four pockets (range 1–6).
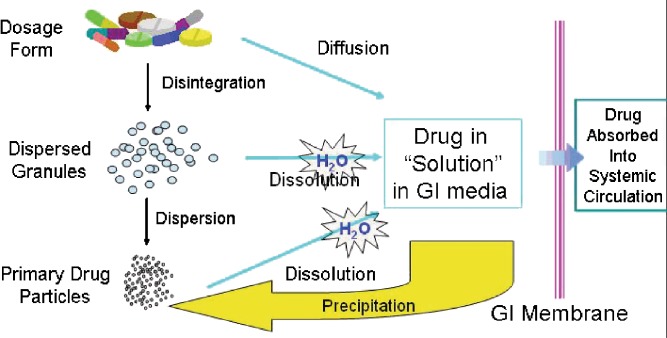
Using these literature values, it may be possible to accurately model the oral absorption of compounds with low aqueous solubility. However, the modeling of oral absorption is more than disintegration, dissolution, and absorption. These kinetic processes can be further complicated by supersaturation, precipitation, and redissolution (Fig. 1). While a detailed discussion of all of these processes is beyond the scope of this paper, a few words on precipitation are in order.
Fig. 1.
The kinetics of disintegration, dissolution, diffusion, precipitation, etc. that ensues after oral administration of a formulation and before absorption into the systemic circulation (Hageman, AAPS Workshop on Optimization of Drug-Like Properties During Lead Optimization, September 19–22, 2004)
Precipitation is the process whereby the solvated molecules nucleate and form a solid by water exclusion. The balance of energies (e.g., lattice, cavitation, entropy, solvation) determine whether supersaturation or precipitation will occur (9). Box and coworkers have proposed that there are two broad categories of compounds, based on their precipitation behavior: chasers and nonchasers (10). Chasers are so-called because they chase their equilibrium during a state of supersaturation and precipitation. Nonchasers have a very brief period of supersaturation—or do not supersaturate at all. In the parlance of in silico modeling, we would say the nonchaser has a very short precipitation half-life (Tppt) and the chasers have a longer Tppt. In order to determine the influence of water volume and precipitation on the absorption of compounds with low aqueous solubility in a model of absorption along the GI tract, we need concentration time profile data after regional administration of the compounds.
During the 1990s, numerous clinical intubation studies were completed in support of controlled release (CR) development. While primarily useful for the development of CR candidates, these studies also provide data that could be used to model the SIWV and the LIWV. The following case studies are discussed: sertraline, CJ-13610, trovafloxacin, and nifedipine (Table I). The interested reader is encouraged to read the references cited for each compound in Table I for details of how the clinical studies were performed. This work examines the hypothesis that the literature values for SIWV and LIWV and reasonable values for Tppt can accurately predict the plasma concentration time profiles for solubility-limited compounds administered to various regions of the GI tract.
Table I.
Properties of Compounds and Details for Regional Absorption Studies
| Property | Sertraline | CJ-13,610 | Trovafloxacin | Nifedipine |
|---|---|---|---|---|
| M W (daltons) | 343 | 300 | 512 | 346 |
| Melting point (°C) | 225 | 228 | 258 | 173 |
| pKa1a | 9.1 (b) | 7.3 (b) | 5.6 (a) | >13 (b) |
| pKa2 | – | – | 9.5 (b) | – |
| pKa3 | – | – | – | – |
| Log P | 5.2 | 2.9 | 1.9 | 2.8d |
| pH | 4 | 7 | 7 | 7 |
| Aqueous solubility (mg/ml)b | 0.003 | 0.004 | 0.014 | 0.01 |
| Ref pH | 7 | 7 | 7 | 7 |
| Solubility factor | 20 | 38,000 | 50 (a), 67 (b) | 50 |
| Ksp (×103) (Mol/l)2 | 8 × 10⁻⁵ | 7.19 × 10⁻³ | ND | ND |
| In situ solubility (mg/ml)b ,c | 0.293 | 0.006 | 0.016 | 0.015 |
| Dose (mg) | 200 | 300 | 300 | 10 |
| Concentration (mg/ml) | 2 | 3 | 2.3 | 10 |
| pH | 4 | 4 | 4 | – |
| Rate (ml/min) | 20 | 20 | 10 | – |
| Total volume (ml) | 140 | 140 | 90 | 1 |
| Literature cited | e | e | e | (28,32) |
ND not determined
aThe value of the pKa is shown with b (base) or a (acid) in parenthesis.
bAt the reference pH
cCalculated in 3 mmol sodium taurocholate using Mithani et al. (20)
dLog P 3.17 (35)
eSutton, S.C. The use of Gastrointestinal Intubation Studies for Controlled Release Development. Brit J Clin Pharmacology (accepted)
MATERIALS AND METHODS
GastroPlus (version 6.0.00.1, Simulations Plus, Lancaster, CA, USA) was used to build models and simulate the impact of intestinal water volume on concentration time profiles. The use of GastroPlus software to simulate absorption profiles has been described previously (11) and elsewhere in this themed issue. Briefly, GastroPlus simulates GI absorption and pharmacokinetics for drugs dosed orally in humans. The advanced compartmental absorption and transit (ACAT) model includes a compartment for the stomach and colon and seven compartments for the intestine (12). While the original ACAT model defined the two colon compartments as ceacum and colon, it was necessary to redefine these two compartments as ascending colon (AC) and “distal colon”. Rather than reduce the number of small intestinal compartments, combining the ceacum into the AC compartment seemed to be the least disruptive to the ACAT model and freed up another colon compartment distal to the AC. This “distal colon” compartment was required in order to more closely predict the drier storing physiology beyond the AC. In these intestinal compartments, drug can dissolve, precipitate, be absorbed in the systemic circulation, and transit through the gastrointestinal tract until unabsorbed drug is excreted. The dissolution and precipitation kinetics are govern by equations published by Noyes and Whitney in 1897 (13)
Whenever IV data were available, the first step was to fit that data and then set the pharmacokinetic parameters for clearance, volume of distribution, and the compartmental rate constants. For any non-IV data, the value for the first pass extraction (FPE) by liver and intestine must be approximated. In vitro (e.g., human hepatocyte and/or microsomal) and preclinical data often provide the major metabolic pathways and a prediction of FPE in humans (14).
The Peff is approximated by the fit of the orally administered solution or intubation to the duodenum. The value of Peff is bracketed by the independent measurement in vitro Caco-2 cell monolayer (15) or rat intestinal perfusion experiments (16,17). The intubation generally involved a brief infusion of a sufficient volume and pH to deliver the compound in solution. However, the infused water is rapidly absorbed and the pH buffered by the intestine (18). Fordtran reported that water was absorbed from the small intestine at a rate of 12 ml/h/cm intestine (19). Using reasonable approximations for water absorption and intestinal buffering, a time-averaged effect of water absorption and pH was applied to the site of the intubation infusions (see “Appendix”).
With the literature SIWV and LIWV values adjusted by these time-averaged calculations, the effects of compound solubility, supersaturation, and precipitation was addressed. The best estimate of solubility is a physiologically relevant one, i.e., in the presence of bile salts, lecithin, sodium, and chloride, at pH’s ranging from 1.3 (stomach) to 7.4 (“ileum3” compartment), and the consideration of a common ion effect. When these data were not available, the pH-solubility profile was modeled from measured pKa and intrinsic solubility values. The in situ solubility was approximated using the following relationship (20):
 |
where [NaTC] is the millimolar concentration of sodium taurocholate in the media, Csx is the predicted drug microgram per milliliter solubility in [NaTC], Cso is the drug aqueous solubility, MW is the drug molecular weight, and SCbs is the bile salt solubility ratio, given by:
 |
where SR = SCbs/SCaq, SCbs = SCaq × SR, SCaq = mso/mH2O, and mso is the moles of drug in solution per milliliter, under the conditions of Cso, and mH2O is the number of moles of water in 1 ml (0.0556 mol). The SR relationship was derived from a correlation of experimental solubility and octanol/water partition coefficient data determined for a group of steroids and nonsteroids (20). The pH solubility data were provided in the user (*.spd) file. As mentioned earlier, the kinetics of drug solution supersaturation and precipitation is described by Tppt. A first approximation is made using the default value of 900 s (21). It quickly becomes clear from the interpretation of the dissolved, precipitation, absorption, and concentration time profile curves whether the Tppt is over- or underpredicting the observed data. When the model predicted the observed concentration time profile data following intubations to duodenum, ileocecal junction (ICJ), AC, and distal colon (DC) for numerous compounds, the values assigned to the SIWV and LIWV values were functionally accurate.
Using the literature values for SIWV as a guide, an initial estimate for the equilibrium SIWV was approximated as 134 ml (a setting of 10% organ volume, and 70 kg body weight in GastroPlus). The small intestine compartment volumes, pH, and transits are as shown for sertraline in Table II.
Table II.
Physiologic Parameter Values for the Sertraline Studies (Fasting Condition)
| Duodenal administration | Ileal–cecal junction administration | Ascending colon administration | |||||||||||
|---|---|---|---|---|---|---|---|---|---|---|---|---|---|
| Parameter | Compartment | Parameter values | Water volume (ml) | pH | Transit time (h) | Parameter values | Water volume (ml) | pH | Transit time (h) | Parameter values | Water volume (ml) | pH | Transit time (h) |
| Duodenum | 126a | 4a | 0.26 | – | – | – | – | – | – | ||||
| Jejunum1 | 44 | 4a | 0.93 | – | – | – | – | – | – | ||||
| Jejunum2 | 31 | 6.4 | 0.74 | – | – | – | – | – | – | ||||
| Ileum1 | 24 | 6.6 | 0.58 | – | – | – | – | – | – | ||||
| Ileum2 | 18 | 6.9 | 0.42 | – | – | – | – | – | – | ||||
| Ileum3 | 12 | 7.4 | 0.29 | 12 | 4a | 0.4a | 12 | 4a | 0.05a | ||||
| Small intestine water volume | 134b | – | – | – | – | – | – | – | – | ||||
| Ascending colon | 4.7 | 6.4 | 4.5 | 4.7 | 6.4 | 4.5 | 4.7 | 6.4 | 4.5 | ||||
| Distal colon | 5 | 6.8 | 13.5 | 5 | 6.8 | 13.5 | 5 | 6.8 | 4a | ||||
| Large intestine water volume | 9.7 | – | – | 9.7 | – | – | 9.7 | – | |||||
| T ppt (s) | 362 | – | – | 362 | – | – | 125 | – | – | ||||
| Fa (%) | 59 | – | – | 36 | – | – | 12 | – | – | ||||
All values of water volume, pH, and transit time are the default values, except where noted (GastroPlus percent fluid settings: 10% small intestine organ volume, 1% colon organ volume, 70 kg body weight)
aValues are not default values; values are adjusted to fit duodenal, ICJ, and AC intubation administrations
bRepresents the default value for total small intestine water volume when the GastroPlus percent fluid setting is 10% small intestine organ volume. Note, additional water introduced during the duodenal intubation resulted in the water volume value for duodenum to exceed the default value of 12 ml
As shown in Table I, sertraline is a base with a pKa of 9.1 and an intrinsic solubility of the free base of only a few microgram per milliliter (22). Furthermore, with a Ksp of 8 × 10⁻⁵ M2, the effective solubility of sertraline at physiologic chloride concentrations is ∼20 μg/ml (23). In a clinical study consisting of 12 healthy volunteers, 200 mg sertraline HCl was administration via nasogastric tube to the duodenum, ICJ, and AC. In GastroPlus, the administration to a region in the GIT was accomplished by setting each concentration time profile proximal to the intubation site to a value of 0.001 h. The 200-mg dose of sertraline HCl was infused into the duodenum in a volume of 100 ml at pH 3.5, over a period of 5 min, followed by a 40-ml flush of the catheter line. The duodenal time-averaged volume was calculated as 126 ml, pH 4, with a residence time 0.26 h (default); the “jejunal1” volume was 44 ml (default), pH 4, and transit 0.93 h (default). Therefore, it was assumed that there were no effects of the intubation on the baseline water volume or pH for the rest of the small intestine (Table II). The details for these calculations are described in the “Appendix”.
Using the literature values for LIWV as a guide, an initial estimate for the equilibrium LIWV was approximated as ∼10 ml (a setting of 1% organ volume in GastroPlus). The LIWV, pH, and transits are as shown in Table II for sertraline. A similar treatment as described above after duodenal intubation was applied after infusion of the same solution to the ICJ and the AC. With the intubation details shown in Table I, similar modeling of the remaining compounds was completed.
RESULTS AND DISCUSSION
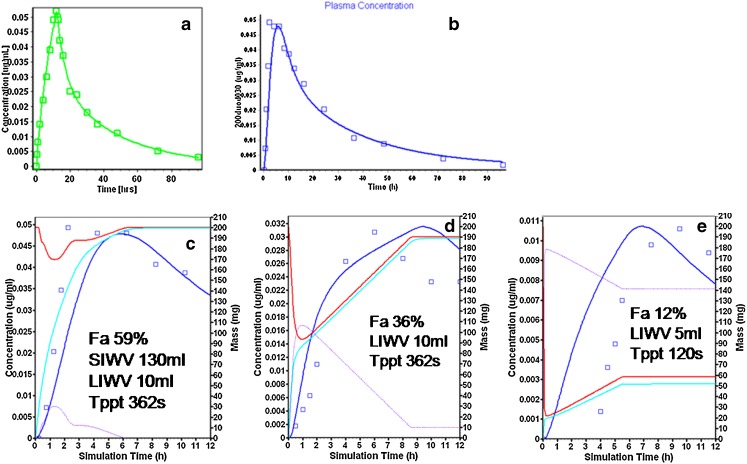
The results of modeling after administration of sertraline by IV, duodenum, ICJ, and AC are shown in Fig. 2a–d. The IV fit of the infusion was optimized with a three-compartment model (GastroPlus module PKPlus™; Fig. 2a). Following duodenal intubation administration, a Peff value of 1.611 × 10⁻⁴ cm/s best fit the mean concentration time profile (Fig. 2b). Since the Peff was a fitted parameter, its sensitivity to the fit was examined. The Cmax of the six subjects with duodenal intubation of sertraline ranged from 0.030 to 0.096 μg/ml. The Peff range of 0.788–7.41 × 10⁻⁴ cm/s fit all of the individual subjects. This was consistent with the moderate to high permeability observed in Caco-2 cell monolayer studies (personal communication, Joanne Bennett, Pfizer, Sandwich, UK). Sertraline is also extensively metabolized by the liver (14,24,25). A value of 25 was assigned to FPE of 200 mg sertraline HCl when administered as a solution or immediate release tablet.
Fig. 2.
Sertraline modeling and simulation results. a Intravenous infusion (observed: squares, simulation: blue line). b Intraduodenal intubation showing the plasma concentration time profile (observed: squares, simulation: blue line). c ID, 0–12 h after administration: amount dissolved (red), amount absorbed (aqua), amount precipitated (purple), and the plasma concentration time profile (observed: squares, simulation: blue line). d ICJ intubation (see b for description of curves). e AC intubation (see b for description of curves)
Figure 2c illustrates the amount of sertraline in solution, absorbed, and precipitated during the 12 h after duodenal intubation administration. For example, there was 200 mg sertraline in solution after duodenal intubation infusion was completed (red curve, 200 mg, right axis). By 2 h, ∼100 mg sertraline was unabsorbed (aqua curve) and had transited to the ileum, where the “ileum1” compartment 24 ml water volume could not maintain the supersaturated state resulting in the precipitation of ∼90 mg (purple curve). The optimized Tppt parameter value of 362 s was found for sertraline. A longer value for Tppt resulted in an overprediction of the concentration time profile (not shown). Sirius Analytical Instruments Ltd. (East Sussex, UK) has recently reported that sertraline showed characteristics of a nonchaser in their experiments using their CheqSol system (Jon Mol, personal communication). The short Tppt value in the model was consistent with their experimental determination of the sertraline precipitation behavior.
Using the intubation infusion volume adjustments discussed in the “Appendix”, the value of 134 ml for the SIWV provided the consistently best predictions. Doubling or halving the SIWV over- and underpredicted the observed concentration time profile (not shown). When absorption continues in the colon, the value of 10 ml for the LIWV provided the consistently best predictions. Since sertraline absorption continued beyond the 3.22 h of small intestine transit, increasing the LIWV to 50 ml also overpredicted the concentration time profile (not shown). The same parameters accurately predicted the concentration time profile after ICJ intubation (Fig. 2d). Note that the amount precipitated was nearly 135 mg for the ICJ intubation (Fig. 2d, purple curve, right axis) resulting in a Fa of 36%. With the notable exception of Tppt, the same parameters also predicted the observations from the AC intubation (Fig. 2e; Table II); after intubation to the AC, 180 mg precipitated (Fig. 2e, purple curve, right axis), resulting a Fa of 12%. The shorter Tppt (125 s) for AC administration might be explained by the effects of less bile acid and lecithin present at the intubation site, since it has been reported that these constituents may slow precipitation (26,27).
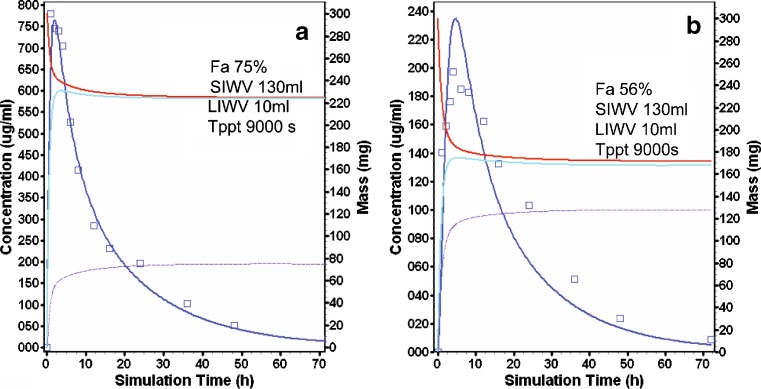
The compound CJ-13,610 is a weak base with a pKa of 7.3 and a solubility factor of over 30,000. A 300-mg dose of CJ-13.610 was similarly infused into the duodenum and AC of 12 healthy volunteers (Table I). A Tppt value of 900 s resulted in a good prediction of the mean concentration time profile after duodenal and AC intubation (Fig. 3a). Following the duodenal intubation, 75 mg CJ-13,610 precipitated, resulting in a Fa of 75% (Fig. 3a, purple curve, right axis). After intubation to the AC, 130 mg CJ-13,610 precipitated, resulting in Fa of 56% (Fig. 3b, purple curve, right axis).
Fig. 3.
CJ-13,610 modeling and simulation results (see Fig. 2b for description of curves). a Duodenal intubation. b AC intubation
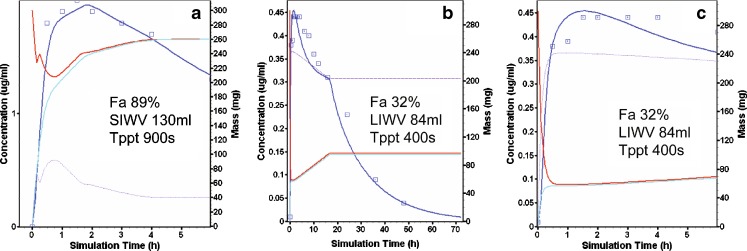
Trovafloxacin is a neutral compound with pKa’s at 5.6 and 9.5 and a log P of 1.9. Trovafloxacin—300 mg solution of 50 ml, pH 4—was infused over a 5-min period and followed with a 40-ml bolus rinse. After duodenal intubation administration to the duodenum, a SIWV of ∼130 ml coupled with the Tppt of 900 s predicted the concentration time profile (Fig. 4a). Reasonable fits were also achieved for Tppt ranging from 450 s (when SIWV was set to an unlikely large value of 260 ml) to 1,800 s (when SIWV was set to an unlikely small value of 65 ml). The fact that multiple models appeared to fit the observed data equally well only emphasized the importance for selecting physiologically reasonable values for both water volume and precipitation (not shown).
Fig. 4.
Trovafloxacin modeling and simulation results (see Fig. 2b for description of curves). a Duodenal intubation. b, c ICJ intubation
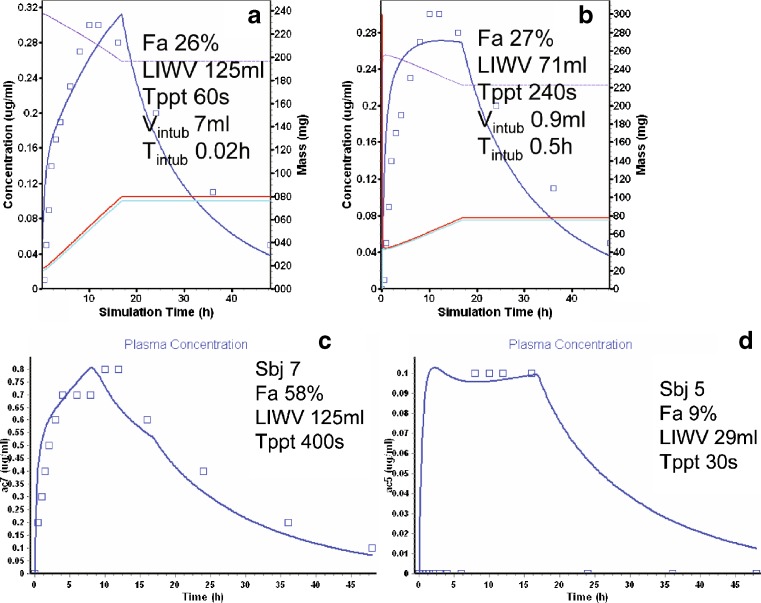
The model for the ICJ trovafloxacin administration includes an intubation site compartment. This compartment consists of a small volume (Vintub, 7 ml) and 0.05 h residence time (Tintub). The model with a Tppt of 400 s and a LIWV of 88 ml predicted the observed average plasma concentration time profile for the ICJ intubation (Fig. 4b, c).
The intubation of trovafloxacin to the AC (Vintub 7 ml) resulted in a slower absorption profile, predicted by a rapid Tppt of 120 s, and a LIWV of 125 ml (Fig. 5a). An alternate model with Vintub 0.2 ml, a slightly longer Tppt of 240 s, and a LIWV of 66 ml also fit the data reasonably well (Fig. 5b). The latter model predicted an increase in concentrations that was too rapid, indicating that the absorption was probably solubility rate limited. Two individual profiles with Fa of 53% (subject 7) and 9% (subject 5) were individually modeled by changing the LIWV and Tppt. Subject 7’s concentration time profile was best predicted with a LIWV of 125 ml and a Tppt of 400 s (Fig. 5c). In contrast, a LIWV of only 29 ml and a Tppt 30 s was sufficient for subject 5 (Fig. 5d). Note that subject 5 showed an apparent lag of 5 h. This lag was unusual, but might be explained by an intubation volume trapped in a “pocket”, which effectively isolated the dose from spreading or contact with the epithelium (8). Approximately 4 h later (when the subject ate), a meal-induced peristalsis could produce spreading of the dose throughout the colon. Despite (or perhaps because of) this, subject 5’s Fa value (9%) was much smaller than subject 7 (53%).
Fig. 5.
Trovafloxacin modeling and simulation results (see Fig. 2b for description of curves). a AC intubation (short T ppt). b AC intubation (long T ppt). c AC intubation, subject 7. d AC intubation, subject 5
At first glance, it seems counter intuitive that the same compound would have different Tppt under different circumstances. Although the Tppt is a physical chemical property of the compound, the conditions under which the supersaturation occurs can have some influence. This strange precipitation behavior of trovafloxacin is difficult to explain in the context of chaser and nonchaser. However, it is possible that the behavior of a compound under some circumstances (i.e., highly supersaturated, as in the ICJ and colon) may precipitate more rapidly than when slightly supersaturated (i.e., in the presence of bile acid and lecithin, as in the duodenum) (26,27). Where the intersubject physiologic variability is considered, the reader may agree that pH, bile salt, and water volume (peristalsis, mixing, homogeneity) could all contribute to the differences in Fa observed for these two individuals.
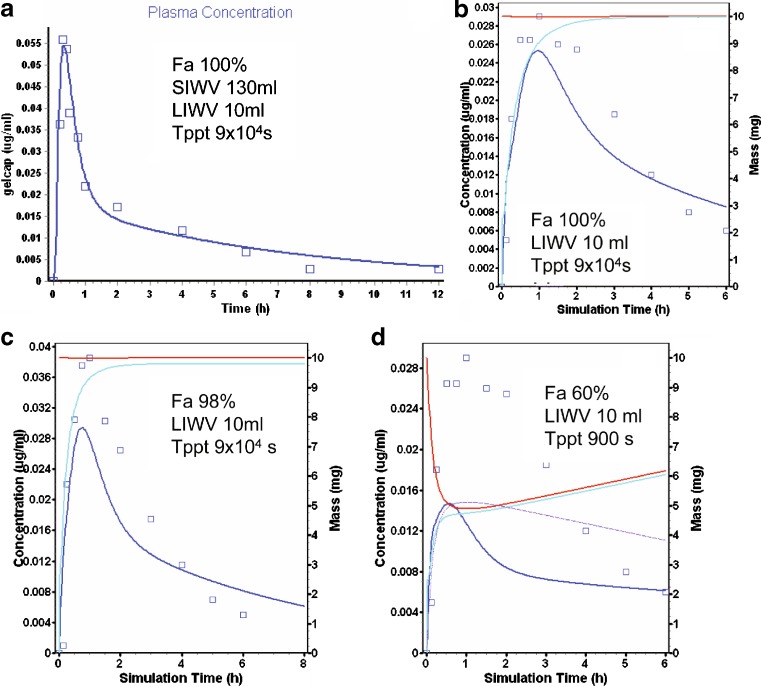
Nifedipine is a dihydropyridine with a pKa >13 (28) and a solubility of 0.01 mg/ml (29). Pharmacokinetic parameter values were calculated from the mean concentration time profile in subjects after an IV infusion (30). These were adjusted slightly to provide a better fit of some mean data collected in subjects after an oral dose of 10 mg nifedipine as a soft gelatin capsule (Fig. 6a) (31). The Tppt value was 90,000 s, i.e., precipitation did not occur.
Fig. 6.
Nifedipine modeling and simulation results (see Fig. 2b for description of curves). a Oral administration of a soft gelatin capsule. b AC administration. c DC administration. d AC administration (short T ppt)
Nifedipine was delivered to the AC and TC sites as 10 mg dissolved in water containing polyethylene glycol (PEG) and polysorbate (PS-80) in a high frequency radio-controlled capsule (32). In Fig. 6b, c is shown the results of these simulations for the AC (b) and TC (c). The water/PEG/PS-80 nifedipine solution essentially remained supersaturated for the absorption period, and the prediction was only slightly affected by decreasing the Tppt from 90,000 (e.g., AC—Fig. 6b) to 9,000 s (not shown), but was dramatically affected by a further decrease in Tppt to 900 s (e.g., AC—Fig. 6d), reflecting likely properties of both the solution and the compound (chaser).
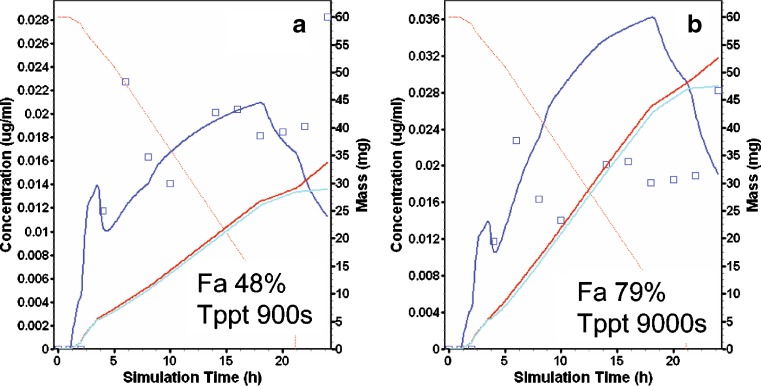
Nifedipine was marketed as Procardia XL, as 60 mg 18 h modified release (MR) formulation “gastrointestinal therapeutic system” (GITS™) to reduce side effects and administration frequency (31). The formulation delivered a gel of nifedipine and excipients at a rate of about 3.3 mgA/h. In GastroPlus, the formulation designation for this product was “CR integral tablet”: Dissolved particles were pumped out of the single unit device. The GastroPlus model predicted the concentration time profile following the administration of the 60-mg GITS remarkably well (Fig. 7a). This “prediction” used all default physiology values, the settings of 10% and 1% for the percent small intestine and colon organ volume assigned to water, and except for Tppt, all the compound settings determined above. When Tppt was left at 9,000 s, the 60-mg GITS was overpredicted (Fig. 7b). The formulator would take care not to assume that the contents of the GITS behaved like the water/PEG/PS-80 nifedipine solution used in the regional absorption study.
Fig. 7.
Nifedipine modeling and simulation results (see Fig. 2b for description of curves). GITS administration predictions
CONCLUSION
This modeling exercise showed how the literature values for intestinal water volume had a large impact on the predictive value of the simulation. The SIWV associated with best fits of solubility limited compounds averaged about 130 ml. The average LIWV in the fasted state was about 10 ml, but the maximum LIWV in individual subjects was 125 ml (trovafloxacin subject 7). The wide range of individual values is likely due to variability in pharmacokinetics, permeability, GI transit, and the observation that each water volume measurement was collected during a “snapshot in time”.
The modeling required that assumptions be made for the perturbations to intestinal water volume and pH caused by the intubation and Tppt. Predictions of individuals’ concentration time profiles were shown with a reasonable adjustment of these parameters. With future research focused on 24 h measurements of intestinal water volume and in silico methods to predict Tppt, the advent of predictive models of IR and MR low solubility compounds and solubility enabling formulations will be realized. The preferred values of 10% organ volume for small intestine and 1–10% organ volume for large intestine are recommended in lieu of the GastroPlus default values of 40% and 10%, respectively.
Acknowledgments
The author wishes to thank Mike Bolger (USC) and Brett Caldwell (Bend Research) for the insightful discussions on solubility and precipitation and Avi Thombre and Hope C. Haynes (both from Pfizer) for their pioneering work on clinical intubation formulations.
Abbreviations
- GI
gastrointestinal
- SIWV
small intestine water volume
- LIWV
large intestinal water volume
- ICJ
ileal–cecal junction
- AC
ascending colon
- DC
distal colon
- IR
immediate release
- MR
modified release
- ASF
absorption scale factor
- GITS™
gastrointestinal therapeutic system
- ID
intraduodenal
- MRI
magnetic resonance imaging
Appendix
The impact of intubation water volume and pH on the basal intestinal values was approximated as follows.
Water volume adjustment. Before the infusion began, basal water volumes were assumed to be ∼10 ml for duodenum and 39 ml for the jejunum1 compartments. This was based on the assignment of 10% organ volume for the small intestine. During the 5 min, 20 ml/min duodenal infusion, 100 ml was infused into the duodenum, followed by a 40-ml rinse. During this time, water was absorbed from the duodenum at a rate of 2.8 ml/min. This water absorption rate was based on a 14 cm length (default) and a water absorption rate of 12 ml/min/cm determined by Fordtran (19). By the end of the administration, 14 ml water had been absorbed and 140 ml water had been introduced, giving a net water volume of 126 ml. For a first approximation, the average of the starting volume of 140 ml and the 5-min value of 126 ml gives an averaged duodenum water volume value of 133 ml during administration.
During the next 8 min of duodenal residence, another 22 ml of water is absorbed, leaving 104 ml in the duodenum at the end of 15 min residence and an average water volume during this period of 118 ml. The average of the 5- and 8-min calculations gives 126 ml. The 126 ml is the value used for the water volume in the duodenum during infusion while the dose resides in this compartment. The 126-ml value is applied by increasing the radius of the duodenum from the default value of 1.6 to 5.33 cm.
At the end of the 15-min residence, the remaining 104-ml water enters the “jejunum1” compartment. With a default length of 58 cm, the water absorption rate is 11.6 ml/min. During the next 10 min, all of this water is absorbed by the jejunum (jejunum1) and the water volume returns to its basal value. For jejunum1, the time-averaged water volume was not significantly different than the basal value of 44 ml. In a similar manner, the impact of intubation water volumes on intestinal water was adjusted after intubation infusion to the ICJ, AC, and DC.
pH adjustment. While the default fasted pH in the duodenum and jejenum1 compartments are 6 and 6.2, respectively, they were set to a value of 4 as a first approximation. These adjustments served as the first estimates of the actual in situ pH in the simulations.
Special intubation compartment. For intubation to the ICJ, the intubation compartment was “borrowed” from the “ileum3” compartment. This creative use of the ileum3 compartment was possible since none of the compartments proximal to the intubation site were involved in the simulation. However, to account for the intubation water volume and pH changes, the residence time for this special compartment was assigned the value of 0.5 h, pH 4, and volume of 12 ml. Likewise, the special intubation compartment for AC intubation was assigned the value for a residence time of 3 min, pH 4, and 12 ml volume. These reasonable parameter values permitted broad predictions for all compounds. After AC administration, the DC compartment residence was artificially shortened from the default value of ∼12.5 to only 4 h. The option to excrete all unabsorbed drug at the end of gut transit time also provided better predictions of the observed mean concentration time profiles. These adjustments are consistent with drug moving to a region in the colon where there is insufficient water for continued dissolution of the drug, increased barriers between drug and membrane, and/or excretion.
References
- 1.Waterman K. C., Sutton S. C. A computational model for particle size influence on drug absorption during controlled-release colonic delivery. J. Control. Release. 2003;86:293–304. doi: 10.1016/S0168-3659(02)00418-2. [DOI] [PubMed] [Google Scholar]
- 2.Lipinski C. Drug solubility in water and dimethylsulfoxide. In: Mannhold R., editor. Molecular Drug Properties Measurement and Prediction. Weinheim: Wiley-VCH; 2008. p. 258. [Google Scholar]
- 3.Cummings J., Banwell J., Segal T., Coleman N., Englyst H., Macfarlane G. The amount and composition of large bowel contents in man. Gastroenterolgy. 1990;98:A408. [Google Scholar]
- 4.Badley A. D., Camilleri M., O’Connor M. K. Noninvasive measurement of human ascending colon volume. Nucl. Med. Common. 1993;14:485–489. [PubMed] [Google Scholar]
- 5.Hoad C. L., Marciani L., Foley S., Totman J. J., Wright J., Bush D., Cox E. F., Campbell E., Spiller R. C., Gowland P. A. Non-invasive quantification of small bowel water content by MRI: a validation study. Phys. Med. Biol. 2007;52:6909–6922. doi: 10.1088/0031-9155/52/23/009. [DOI] [PubMed] [Google Scholar]
- 6.L. Marciani, S. Foley, C. Hoad, E. Campbell, J. Totman, E. Cox, P. Gowland, and R. C. Spiller. Magnetic resonance imaging of abnormalities in diarrhoea-predominant Irritable Bowel Syndrome fasting and after a bran-containing meal, United European Gastroenterology Week (UEGW), Paris, 2007.
- 7.L. Marciani, S. Foley, C. Hoad, E. Campbell, J. Totman, A. Armstrong, P. Manby, P. A. Gowland, and R. Spiller. Effects of Ondansetron on small bowel water content: a magnetic resonance imaging study, United European Gastroenterology Week (UEGW), Paris, 2007.
- 8.Schiller C., Frohlich C. -P., Giessmann T., Siegmund W., Monnikes H., Hosten N., Weitschies W. Intestinal fluid volumes and transit of dosage forms as assessed by magnetic resonance imaging. Aliment Pharmacol. Ther. 2005;22:971–979. doi: 10.1111/j.1365-2036.2005.02683.x. [DOI] [PubMed] [Google Scholar]
- 9.Bhattachar S., Deschenes L., Wesley J. Solubility: it’s not just for physical chemists. Drug Discov. Today. 2006;11:1012–1018. doi: 10.1016/j.drudis.2006.09.002. [DOI] [PubMed] [Google Scholar]
- 10.Box K., Völgyi G., Baka E., Stuart M., Takács-Novák K., Comer J. Equilibrium versus kinetic measurements of aqueous solubility, and the ability of compounds to supersaturate in solution—a validation study. J. Pharm. Sci. 2006;95:1298–1307. doi: 10.1002/jps.20613. [DOI] [PubMed] [Google Scholar]
- 11.Tubic M., Wagner D., Spahn-Langguth H., Bolger M., Langguth P. In silico modeling of non-linear drug absorption for the P-gp substrate talinolol and of consequences for the resulting pharmacodynamic effect. Pharm. Res. 2006;23:1712–1720. doi: 10.1007/s11095-006-9020-7. [DOI] [PubMed] [Google Scholar]
- 12.Yu L. X. An integrated model for determining causes of poor oral drug absorption. Pharm Res. 1999;16:1883–1887. doi: 10.1023/A:1018911728161. [DOI] [PubMed] [Google Scholar]
- 13.Noyes A. S., Whitney W. R. The rate of solution of solid substances in their own solutions. J. Amer. Chem. Soc. 1897;19:930–934. doi: 10.1021/ja02086a003. [DOI] [Google Scholar]
- 14.Obach R. S., Cox L. M., Tremaine L. Sertraline is metabolized by multiple cytochrome P450 enzymes, monoamine oxidases, and glucuronyl transferases in human: an in vitro study. Drug Metab. Dispos. 2005;33:262–270. doi: 10.1124/dmd.104.002428. [DOI] [PubMed] [Google Scholar]
- 15.Yee S. -Y., Day W. -W. Applications of Caco-2 cells in drug discovery and development. In: Woolf T. F., editor. Handbook Of Drug Metabolism. New York: Marcel Dekker; 1999. pp. 507–522. [Google Scholar]
- 16.Sutton S. C., Rinaldi M. T. S., Vukovinsky K. E. Comparison of the gravimetric, phenol red and 14C-PEG-3350 methods to determine water absorption in the rat single pass intestinal perfusion model. AAPS Pharm. Sci. 2001;3:article 25. doi: 10.1208/ps030325. [DOI] [PMC free article] [PubMed] [Google Scholar]
- 17.Sutton S. C., Rinaldi M. T. S., McCarthy J. M., Vukovinsky K. E. A statistical method for the determination of absorption rate constant estimated using the rat single pass intestinal perfusion model and multiple linear regression. J. Pharm. Sci. 2002;91:1046–1053. doi: 10.1002/jps.10081. [DOI] [PubMed] [Google Scholar]
- 18.L. R. Johnson (ed.). Physiology of the gastrointestinal tract, Raven, New York, 1994.
- 19.Fordtran J., Dietschy J. Water and electrolyte movement in the intestine. Gastroenterolgy. 1968;50:263–285. [PubMed] [Google Scholar]
- 20.Mithani S. D., Bakatselou V., TenHoor C. N., Dressman J. B. Estimation of the increase in solubility of drugs as a function of bile salt concentration. Pharm. Res. 1996;13:163–167. doi: 10.1023/A:1016062224568. [DOI] [PubMed] [Google Scholar]
- 21.Kostewicz E., Becker R., Brauns U., Dressman J. In vitro model to predict the precipitation of a poorly soluble weak base following its transition out of the stomach and into the intestine. AAPS Pharm. Sci. 1999;1:S–491. [Google Scholar]
- 22.Likar M. D., Bordner J., Rescek D. M., Sharp T. R. Sertraline (L)-Lactate: Comprehensive Profile. Profiles of drug substances, excipients and related methodology, Vol. 30. Boston: Elsevier; 2003. pp. 185–234. [DOI] [PubMed] [Google Scholar]
- 23.Friesen D., Herbig S., Shanker R., West J. PCT Int. Appl. WO 99 01121 sertraline salts and sustained-release dosage forms of sertraline. Chem. Abs. 1999;130:115031. [Google Scholar]
- 24.Koe B. K., Weissman A., Welch W. M., Browne R. G. Sertraline, 1S,4S-N-methyl-4-(3,4-dichlorophenyl)-1,2,3,4-tetrahydro-1-naphthylamine, a new uptake inhibitor with selectivity for serotonin. J. Pharmacol. Exp. Ther. 1983;226:686–700. [PubMed] [Google Scholar]
- 25.Hamelin B. A., Turgeon J., Vallee F., Belanger P. -M., Paquet F., LeBel M. The disposition of fluoxetine but not sertraline is altered in poor metabolizers of debrisoquin(ast) Clin. Pharmacol. Ther. 1996;60:512–521. doi: 10.1016/S0009-9236(96)90147-2. [DOI] [PubMed] [Google Scholar]
- 26.Nokano M. Places of emulsions in drug delivery. Adv. Drug Deliv. Rev. 2000;45:1–4. doi: 10.1016/S0169-409X(00)00096-X. [DOI] [PubMed] [Google Scholar]
- 27.Serajuddin A. T. M. Salt formation to improve drug solubility. Adv. Drug Deliv. Rev. 2007;59:603–616. doi: 10.1016/j.addr.2007.05.010. [DOI] [PubMed] [Google Scholar]
- 28.Schug B. S., Brendel E., Wolf D., Wonnemann M., Wargenau M., Blume H. H. Formulation-dependent food effects demonstrated for nifedipine modified-release preparations marketed in the European Union. Eur. J. Pharm. Sci. 2002;15:279–285. doi: 10.1016/S0928-0987(02)00008-8. [DOI] [PubMed] [Google Scholar]
- 29.Swanson D. R., Barclay B. L., Wong P. S. L., Theeuwes F. Nifedipine gastrointestinal therapeutic system. Am. J. Med. 1987;83:3–9. doi: 10.1016/0002-9343(87)90629-2. [DOI] [PubMed] [Google Scholar]
- 30.Foster T., Hamann S., Richards V., Bryant P., Graves D., McAllister R. Nifedipine kinetics and bioavailability after single intravenous and oral doses in normal subjects. J. Clin. Pharmacol. 1983;23:161–170. doi: 10.1002/j.1552-4604.1983.tb02720.x. [DOI] [PubMed] [Google Scholar]
- 31.Chung M., Reitberg D., Gaffney M., Singleton W. Clinical pharmacokinetics of nifedipine gastrointestinal therapeutic system. Am. J. Med. 1987;83:10–14. doi: 10.1016/0002-9343(87)90630-9. [DOI] [PubMed] [Google Scholar]
- 32.Bode H., Brendel E., Ahr G., Fuhr U., Harder S. Investigation of nifedipine absorption in different regions of the human git after simultaneous administration of 13C and 12C nifedipine. Eur. J. Clin. Pharmacol. 1996;50:195–201. doi: 10.1007/s002280050092. [DOI] [PubMed] [Google Scholar]


