Abstract
The purpose of this study is to investigate the impact of observations below the limit of quantification (BQL) occurring in three distinctly different ways and assess the best method for prevention of bias in parameter estimates and for illustrating model fit using visual predictive checks (VPCs). Three typical ways in which BQL can occur in a model was investigated with simulations from three different models and different levels of the limit of quantification (LOQ). Model A was used to represent a case with BQL observations in an absorption phase of a PK model whereas model B represented a case with BQL observations in the elimination phase. The third model, C, an indirect response model illustrated a case where the variable of interest in some cases decreases below the LOQ before returning towards baseline. Different approaches for handling of BQL data were compared with estimation of the full dataset for 100 simulated datasets following models A, B, and C. An improved standard for VPCs was suggested to better evaluate simulation properties both for data above and below LOQ. Omission of BQL data was associated with substantial bias in parameter estimates for all tested models even for seemingly small amounts of censored data. Best performance was seen when the likelihood of being below LOQ was incorporated into the model. In the tested examples this method generated overall unbiased parameter estimates. Results following substitution of BQL observations with LOQ/2 were in some cases shown to introduce bias and were always suboptimal to the best method. The new standard VPCs was found to identify model misfit more clearly than VPCs of data above LOQ only.
Key words: likelihood, limit-of-quantification, NONMEM, visual-predictive-check
INTRODUCTION
Bioanalytical laboratories traditionally define the lower limit of quantification (LOQ) as the lowest concentration on the standard curve that is associated with a coefficient of variation (CV) of less than 20%. The limit of 20% CV originates primarily from the FDA Guidance for Industry Bioanalytical Method Validation (1). Samples associated with a signal less than LOQ are by this standard reported as below the quantification limit (BQL). Common approaches for handling of concentration measurements reported as BQL, such as discharging the information or substitution with the LOQ divided by two, have been shown to introduce bias in parameter estimates (2–4). In 2001, Stuart Beal published an overview of ways to fit a PK model in the presence of BQL data (5). The method referred to as M2 in the publication applies conditional likelihood estimation to the observations above LOQ and the likelihood for the data being above LOQ are maximized with respect to the model parameters. This approach can be implemented in NONMEM VI by utilization of the YLO functionality (6). The methods M3 and M4 also suggested by Beal are based on simultaneous modeling of continuous and categorical data where the BQL observations are treated as categorical data. The likelihood for BQL observations are maximized with respect to the model parameters and the likelihood for an observation is taken to be the likelihood that it is indeed below LOQ. M4 differs from M3 by the fact that it conditions on the observations being greater than zero. An alternative to using M4 is to log-transform the dependent variable and use the somewhat simpler M3 approach. The possibility for simultaneous modeling of continuous and categorical data is improved in NONMEM VI and easily implemented by the use of the indication variable F_FLAG. The use of this feature has been reported to improve the performance of the M3 method compared to the original implementation (3,7).
The influence of BQL samples and the performance of the likelihood based methods have previously only been assessed for the case where BQL samples occur in the terminal elimination phase of a one- or two-compartment PK model (5,7,8). However BQL samples also frequently occur in the absorption phase of PK models and in various ways in PD models for continuous biomarkers.
Visual predictive check (VPC) is a valuable tool in diagnosing the performance of mixed effect models (9). The presence of non-randomly censored data such as BQL samples should be taken into account when producing VPCs in order to not introduce bias in comparison of observations and model predictions. This publication includes a suggested extension to the traditional VPC to better diagnose models in the presence of BQL samples.
MATERIALS AND METHODS
Software
Simulation and estimation was carried out using a non-linear mixed effects approach as implemented in the NONMEM software version VI, level 1.0 (ICON Development Solutions, Ellicott City, MD) (6). Automation of NONMEM in terms of simulation, estimation, and data collection was performed with the software Perl-speaks-NONMEM (10,11). Post-processing of NONMEM simulations to create VPC plots was done using Xpose 4.0.1 as implemented in the statistical programming language R (12,13). All NONMEM code can be provided upon request.
Simulation
Three distinctly different models were used for simulation. Model A was a one compartment model with oral dosing and absorption transit compartments (14). In the simulated datasets BQL observations were located with absolute predominance in the absorption phase. Model B was a two-compartment model with intravenous dosing. Model C was an indirect response model where Kout increased linearly with drug concentration (15). The effect driving drug concentration followed a fixed one-compartment model with oral absorption (not estimated). The typical parameter values and variability for all models are provided in Table I. Log-transformation of the dependent variable was applied for all models to avoid negative predictions. An exponential error model (Eq. 1) was used for inter-individual variability (IIV). The residual unexplained variability (RUV) was simulated using an error model designed to mimic combined proportional/additive error within the relevant prediction range (Eqs. 2 and 3). The additive component (proportional on normal scale) of the residual error model (w1) was set to 0.1 (10%) in all simulations and the constant wh was set to 0.5. Each model was simulated with three different values for w2. The assumed LOQ levels were chosen so that the CV of RUV was equal to 20% at this typical prediction. Values for w2 and corresponding LOQ are presented in Table I. For each model and value for w2, 100 datasets were simulated.
 |
1 |
 |
2 |
 |
3 |
 |
4 |
- pi
Parameter for individual i
- p
Typical value of parameter
- ηi
Inter-individual random effects
- yij
jth observation in the ith individual
- fij
Model predicted value for yij
- εij
Residual random effects
- σij
Variance of εij
- w1
Additive residual error term (0.1)
- w2
Second residual error term
- wh
Constant modulating w2
Table I.
Experimental Set-up for Model A, B, and C Regarding Parameterization, Sample Size, and Sampling Schedule
| Model | Description | Parameterization | Design | W2/LOQ/BQL | ||
|---|---|---|---|---|---|---|
| I | II | III | ||||
| A | One compartment model with oral dosing and absorption transit compartments, BQL data in absorption phase | Absorption rate constant (KA = 1), mean transit time (MTT = 1.5), number of transit compartments (NTC = 10), clearance (CL = 1), distribution volume (VC = 30). Log-normal intra individual variability of 30% for all typical parameters. Log transformed DV | 100 studies of 100 individuals with 7 samples: 1, 2, 3, 4, 6, 12 and 24 h post-dose | W2: 0.3, LOQ: 0.2, BQL: 12% of all; 28% of samples 1–3 | W2: 0.45, LOQ: 0.4, BQL: 15% of all; 35% of samples 1–3 | W2: 0.75, LOQ: 0.8, BQL: 19% of all; 44% of samples 1–3 |
| B | Two compartment model with iv dosing | Clearance (CL = 5), central distribution volume (VC = 20), inter compartment clearance (Q = 5), peripheral distribution volume (VP = 100). Log-normal intra individual variability of 30% for all typical parameters. Log transformed DV | 100 studies of 100 individuals with 5 samples. Sampling intervals: 0–1, 1–2, 2–6, 8–12, and 12–24 h | W2: 0.55, LOQ: 1.25, BQL: 10% of all; 40% of last sample | W2: 0.7 LOQ: 1.75 BQL: 20% of all; 70% of last sample | W2: 0.9, LOQ: 2.5, BQL: 30% of all; 90% of last sample |
| C | Indirect response model with drug concentration effect on K OUT drug concentration following fix one comp mod | Baseline (BASE = 10), first order elimination constantan (K OUT = 0.015), linear drug concentration effect on K OUT (SLOP = 10). Log-normal intra individual variability of 30% for all typical parameters. Log transformed DV | 100 studies of 100 individuals with 5 samples: 0, 10, 20, 30, and 200 h | W2: 0.65, LOQ: 1.6, BQL: 10% of all; 17% of samples 2–4 | W2: 0.75, LOQ: 2, BQL: 18% of all; 30% of samples 2–4 | W2: 0.9, LOQ: 2.5, BQL: 28% of all; 46% of samples 2–4 |
In the right hand end of the table parameter value W 2, limit of quantification (LOQ) and approximate percentage of BQL samples associated with version I, II and III of each model
Estimation
Eight different methods were used to fit the simulated data (Table II). Estimation with the entire datasets without any assumed BQL samples (a), with BQL samples omitted (b), and with BQL samples substituted with LOQ divided by two (LOQ/2) (c). For model B and C, the first in the time series of BQL measurements was substituted with LOQ/2. In the absorption case (model A) all BQL observations was substituted with LOQ/2. The estimation alternatives a, b, and c was performed both with the first order conditional estimation method with interaction (FOCE INTER) and with addition of the LAPLACIAN option. The LAPLACIAN option was necessary for the execution of the likelihood based methods M2 (d) and M3 (e) in NONMEM VI. The M2 method was implemented by setting the YLO parameter to the LOQ value. The M3 method was implemented with the built in NONMEM VI functionality F_FLAG. For the observations above the LOQ, F_FLAG was set to 0 (a prediction) whereas for the BQL observations, it was set to 1 (a likelihood). Coding and explicit likelihood expressions for the M2 and M3 method as implemented in NONMEM are presented in the paper by Ahn et al. (7).
Table II.
Description of the Applied Estimation Methods
| Annotation | Description |
|---|---|
| aF | No data censored, FOCE INTER |
| aL | No data censored, LAPLACIAN INTER |
| bF | BQL omitted, FOCE INTER |
| bL | BQL omitted, LAPLACIAN INTER |
| cF | BQL substituted with LOQ/2, FOCE INTER |
| cL | BQL substituted with LOQ/2, LAPLACIAN INTER |
| d | M2 method implemented with YLO functionality |
| e | M3 method implemented with F_FLAG functionality |
On estimation, the residual error model used for simulations (Eq. 3) was found to be unnecessarily complex. Instead a two-parameter residual error model (Eq. 4) was used for model B and C. For model A, a simple additive error model described the data sufficiently well. An extra additive error model term was added for samples substituted with LOQ/2. All other fixed and random effects parameters and the model remained the same compared to the simulation model.
Evaluation
The bias and precision in parameter estimates were assessed as a percent mean prediction error (mpe) and root mean squared prediction error (rmse), respectively. Judgment of significant bias was based on 99% confidence intervals for mpe excluding zero. The ratios of parameter estimates divided by the true parameter (pr) value are depicted in box-plots for graphical comparison of the different methods.
Visual Predictive Check
VPC graphs were created for one example dataset for each model and estimation method. Each VPC was based on 500 datasets simulated with the obtained final parameter estimates. A two panel type of VPC was chosen to evaluate the model with respect to both data above and below LOQ. The top panel shows a comparison of the median and 95% prediction interval for the simulated data and the corresponding percentiles for the observed data over time. The bottom panel compares a simulation based 95% confidence interval for the fraction of BQL samples. Based on the 500 simulated datasets 95% non-parametric confidence intervals are calculated for the median and 95% prediction interval. When the corresponding percentile from the observed data falls outside the 95% confidence interval this is an indication of a misspecification. To ensure correctly calculated percentiles all BQL samples are retained in the dataset. Percentiles for observed data can only be adequately calculated and presented for percentiles where BQL data constitute a smaller fraction than the percentile in question. The bottom panel compares simulation-based 95% confidence intervals for the fraction of BQL samples to the observed fraction of BQL samples over time. For model B binning across the independent variable time was done for both plots so that one bin was created for each sampling window (0–1, 1–2, 2–6, 8–12, and 12–24 h).
RESULTS
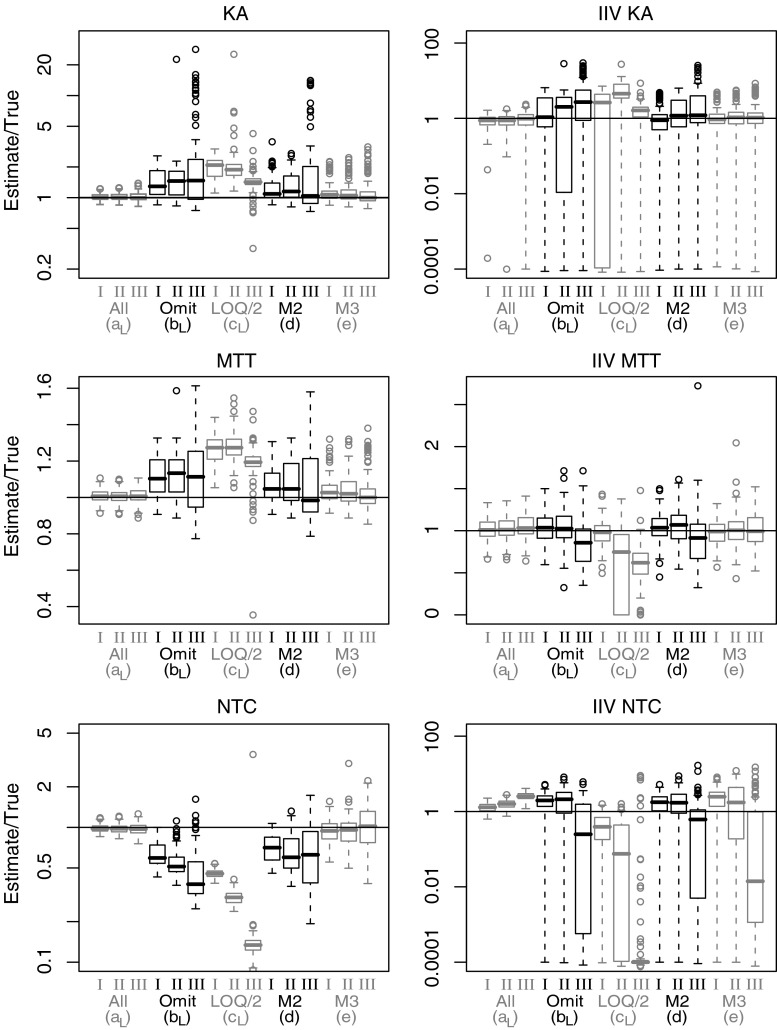
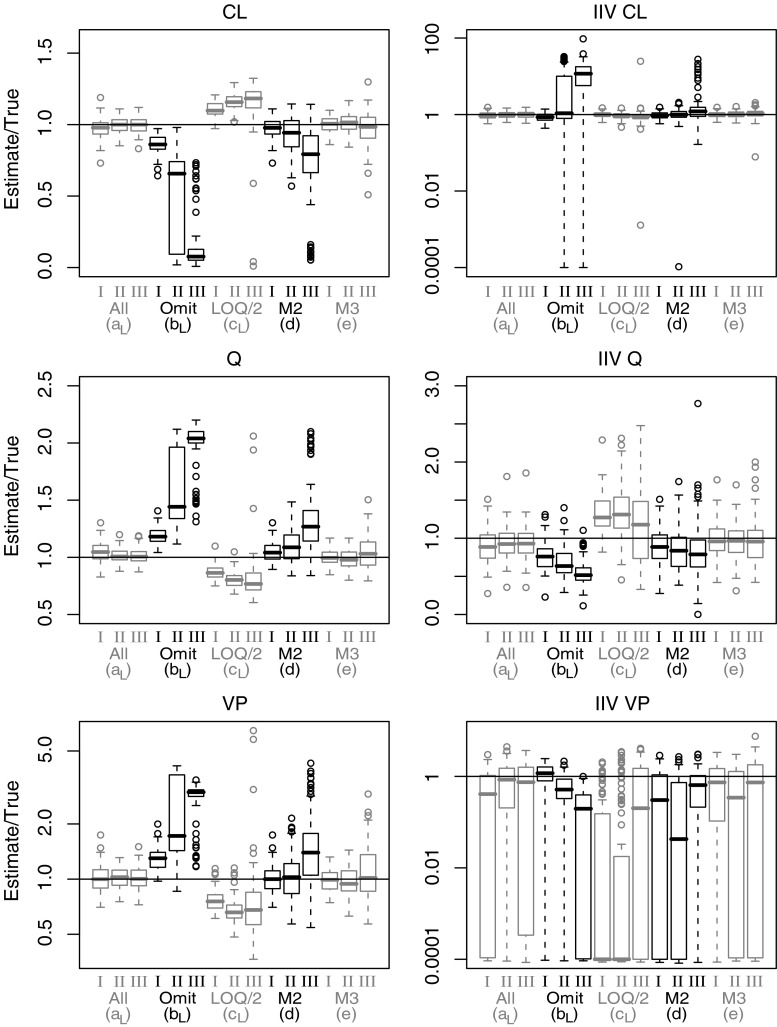
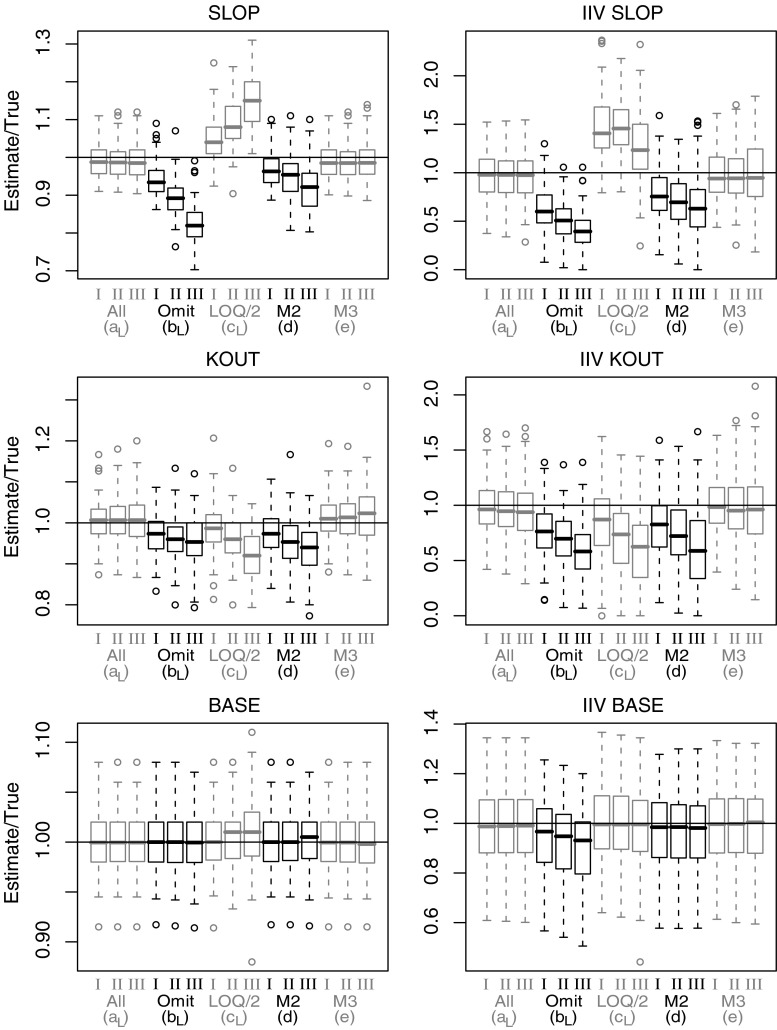
Figures 1, 2, and 3 include box-plots for a selection of model parameters from model A, B, and C. Only estimation alternatives with Laplacian estimation are presented. Similar but not identical results was seen for methods af, bf, and cf with FOCE estimation. Although not shown separately, all reports below about bias were supported by evaluations of mpe being significantly (p < 0.01) different from zero or not. Figures 4 and 5 contain examples of VPC plots for model B and C given estimation with BQL data omitted, substituted with LOQ/2 or with the M3 method applied. The rate of successful minimizations and covariance steps for each model and applied method are listed in Table III.
Fig. 1.
Box-plots depicting parameter estimates (n = 100 per box) divided by true parameter values for a selection of parameters from model A. Absorption rate constant (KA), mean transit time (MTT), number of transit compartments (NTC) and corresponding interindividual variability (IIV). Results presented for method a, b, c (Laplacian), d and e and for LOQ level I, II and III
Fig. 2.
Box-plots depicting parameter estimates (n = 100 per box) divided by true parameter values for a selection of parameters from model B. Clearance (CL), inter-compartment clearance (Q), peripheral distribution volume (VP), and corresponding inter-individual variability (IIV). Results presented for method a, b, c (Laplacian), d and e and for LOQ level I, II and III
Fig. 3.
Box-plots depicting parameter estimates (n = 100 per box) divided by true parameter values for a selection of parameters from model C. Drug concentration effect on K out (SLOP), first order elimination constantan (KOUT), baseline (BASE), and corresponding inter-individual variability (IIV). Results presented for method a, b, c (Laplacian), d and e and for LOQ level I, II and III
Fig. 4.
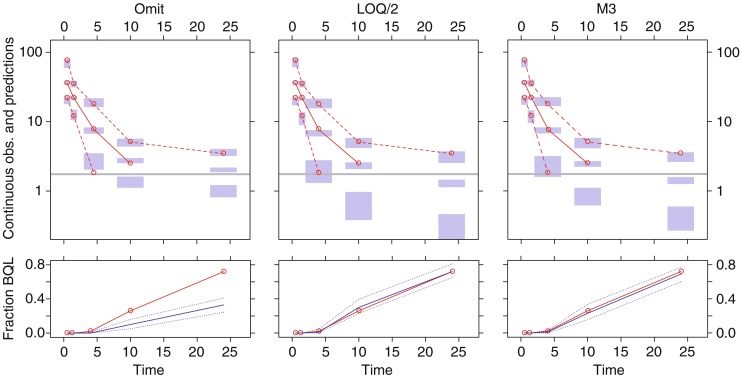
Example of visual predictive check (VPC) for model B (LOQ level II) following estimation with BQL data omitted (left), BQL dataset to LOQ/2 (middle), and the M3 method (right). The upper panels show simulation-based 95% confidence intervals around the 97.5th, 50th, and 2.5th percentiles of the continuous data in the form of blue areas. The corresponding percentiles from the observed data are plotted in red color (can only be plotted for observations above LOQ). The horizontal gray line represents the LOQ. The lower panels show simulation based 95% confidence intervals (dotted blue line) around the median (solid blue line) for the fraction of BQL observations. The observed fraction BQL samples are represented with a dashed red line
Fig. 5.
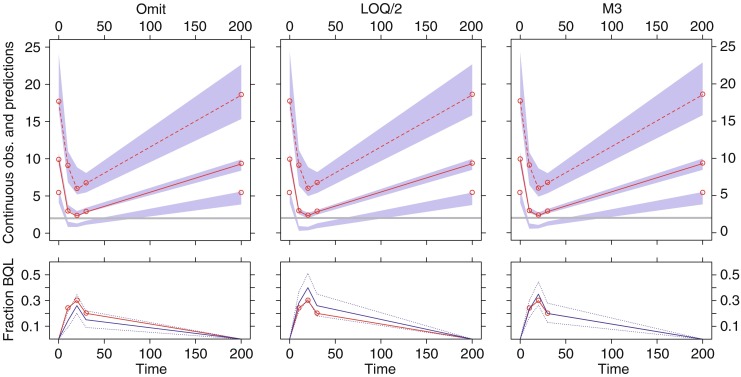
Example of visual predictive check (VPC) for model C (LOQ level II) following estimation with BQL data omitted (left), BQL dataset to LOQ/2 (middle), and the M3 method (right). The upper panels show simulation-based 95% confidence intervals around the 97.5th, 50th, and 2.5th percentiles of the continuous data in the form of blue areas. The corresponding percentiles from the observed data are plotted in red color (can only be plotted for observations above LOQ). The horizontal gray line represents the LOQ. The lower panels show simulation based 95% confidence intervals (dotted blue line) around the median (solid blue line) for the fraction of BQL observations. The observed fraction BQL samples are represented with a dashed red line
Table III.
Percentage of Successful Minimizations (Percentage of Successful Covariance Steps) with the Applied Methods for Respectively Model and LOQ Level
| Method | Model A | Model B | Model C | ||||||
|---|---|---|---|---|---|---|---|---|---|
| I | II | III | I | II | III | I | II | III | |
| All (aF) | 100 (93) | 100 (89) | 100 (85) | 99 (94) | 100 (94) | 100 (89) | 100 (99) | 100 (100) | 100 (100) |
| All (aL) | 86 (20) | 90 (15) | 83 (18) | 95 (22) | 97 (39) | 96 (35) | 100 (90) | 99 (96) | 99 (92) |
| Omit (bF) | 100 (66) | 99 (36) | 100 (32) | 100 (95) | 99 (71) | 100 (16) | 100 (99) | 100 (92) | 100 (88) |
| Omit (bL) | 73 (19) | 72 (23) | 62 (24) | 87 (35) | 73 (25) | 33 (11) | 100 (80) | 100 (78) | 100 (60) |
| LOQ/2 (cF) | 100 (43) | 99 (41) | 100 (16) | 99 (40) | 98 (23) | 98 (53) | 98 (83) | 96 (70) | 90 (66) |
| LOQ/2 (cL) | 72 (14) | 69 (13) | 59 (5) | 95 (23) | 86 (18) | 70 (33) | 98 (84) | 98 (66) | 90 (59) |
| M2 (d) | 79 (16) | 65 (18) | 50 (17) | 94 (31) | 95 (27) | 83 (26) | 99 (84) | 98 (80) | 99 (74) |
| M3 (e) | 65 (21) | 73 (22) | 75 (14) | 94 (33) | 91 (36) | 91 (26) | 94 (87) | 78 (93) | 70 (84) |
Model A
Estimates of population mean and IIV for clearance (CL) and central distribution volume (VC) was not biased by the presence of BQL samples and similar for all investigated methods (results not presented). The absorption rate constant (KA), mean transit time (MTT), and number of transit compartments (NTC) parameters were all affected by omission of BQL data. A positive bias was introduced for KA and MTT whereas NTC was estimated with a negative bias. The same pattern and similar or worse performance was seen for substitution with LOQ/2. The M2 method did not generate unbiased parameter estimates but bias was less pronounced than for omission. Best performance was seen with the M3 method. Compared to the full dataset, an increased root mean squared prediction error but overall relatively unbiased mean parameter estimates were seen for the population mean parameters.
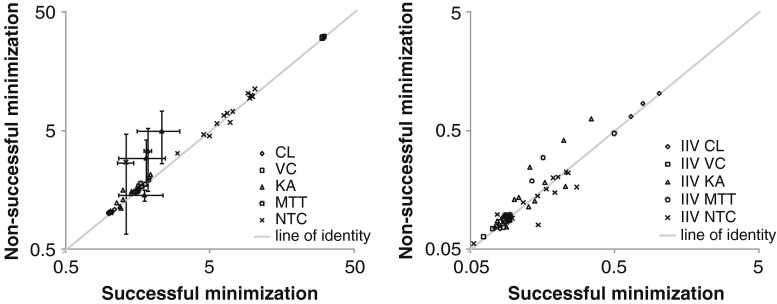
The Laplacian method resulted more often than the FOCE method in non-successful terminations, in particular for model A (10–50%, see Table III). However, for model A (Fig. 6) as well as models B and C (not shown), there was no apparent difference in parameter estimates between successful and non-successful terminations. It was therefore decided to present results for all runs independently of termination status.
Fig. 6.
Mean parameter estimates for estimations with successful versus non-successful minimization for model A and estimation alternatives using the Laplacian estimation method. Suspected outliers complemented with error bars representing a 95% confidence interval. Results are presented for each parameter and method. Typical parameter values are presented in the right panel and inter-individual variability (IIV) parameters to the left
Model B
Omission of BQL samples led to substantial bias in CL, inter-compartment clearance (Q), and peripheral distribution volume (VP). Bias increased steeply with increasing LOQ level. Substitution with LOQ/2 was observed to overcompensate for the bias induced by omission. Compared to omission of BQL data, the M2 method showed a similar but less pronounced bias in parameters. The M3 method for handling BQL samples was found to result in the least biased parameter estimates. Even at the highest investigated LOQ there was an absence of pronounced bias. It is worth noting that IIV for VP was frequently estimated as negligible. This was most frequent in the case of substitution with LOQ/2. Independent of the method used, typical value and IIV for central distribution volume (VC) was not significantly affected by the presence of BQL samples (results not presented).
Model C
The typical value and IIV for the first order elimination constantan (Kout) of the indirect response model was similarly affected by omission, substitution with LOQ/2 and the M2 method: an increasing negative bias was seen as the LOQ level was increased. The most pronounced effect of BQL samples was seen for the drug effect parameter (SLOP) for which all methods except the M3 method resulted in significantly biased parameter estimates for both typical values and IIV. The typical value and IIV for baseline (BASE) was fairly well-estimated with all the investigated methods.
VPC Plots
The VPC plots in Figs. 4 and 5 were constructed for a randomly selected dataset for model B and C respectively in order to demonstrate how this type of diagnostic can help diagnosing bias introduced by incorrect handling of BQL observations. In Fig. 4, the VPC for omission of BQL data indicated a model misspecification both in the upper and lower panel. In the upper panel the observed median was outside of the simulation based confidence intervals at the fourth and fifth bin. In the fifth bin no value for the median can be calculate and plotted since more than 50% of the observations are below LOQ. Yet the VPC indicates a misspecification since the simulated confidence interval is entirely above LOQ. A sign of misspecification can also be seen for the 2.5 percentile in the third bin. The most obvious indication of a misspecification was however seen in the lower panel were the observed fraction of BQL samples clearly fell outside of the confidence interval both in the fourth and the fifth bin. For the estimation with BQL samples substituted with LOQ/2 there was no indication of a model misspecification in the lower VPC panel but a slight under prediction of the median can be seen in the upper panel of the third bin. Also in the fourth bin the observed median falls just at the upper border of the confidence interval. The VPC plot for the estimates from the M3 method indicates no signs of model misspecification in either the upper or lower panel.
The VPC plot in Fig. 5 representing model C with BQL data omitted indicated an over prediction of the median and an under prediction of the fraction BQL for the samples around the trough of the curve. In the case of substitution with LOQ/2 there was no indication of model misspecification in the upper panel as the simulation-based confidence intervals covered the observed median and 95% prediction intervals were these could be calculated. The lower plot did however indicate a misspecification as the fraction of BQL samples was over estimated between 10 and 30 h. The observed fraction of BQL samples was below the confidence interval at 20 h and was close to the lower bound at 10 and 30 h. As expected, the relatively unbiased parameter estimates obtained with the M3 method resulted in no indications of model misspecification.
DISCUSSION
The results of this study clearly demonstrated that omission of BQL samples can cause substantial bias to parameter estimates in mixed effect models. Substituting BQL observations with LOQ/2 resulted in an unpredictable pattern of sometimes reducing and sometimes inflating the bias observed with omission. The M2 method on the other hand consistently resulted in less bias than omitting BQL observations; however, the method in many cases resulted in unsatisfactory bias. The overall best of the investigated methods for handling BQL samples was the M3 method.
Factors possibly limiting the use of the M3 method are the longer runtimes and the lower rate of successful minimizations and covariance steps. In all cases estimation using the Laplacian method in NONMEM VI resulted in a lower rate of successful terminations compared to the FOCE method. The highest number of non-successful terminations was seen for model A and estimation alternatives using the Laplacian estimation method in NONMEM (Table III). However, no general trend towards different parameter estimates following non-successful minimization compared to successful terminations was detected, as exemplified in Fig. 6. This is in line with results from two other articles investigating the M2 and/or the M3 method (7,8).
The estimates of the drug effect parameter SLOP in model C suffered from bias following all estimation methods except M3 in a way that could potentially alter a judgment of clinical efficacy. Omission of BQL data would result in an appreciable underestimation of drug effect, whereas substitution with LOQ/2 would result in an overestimation of drug effect of similar magnitude. Good diagnostic tools could help to identify models with misspecifications. Figures 4 and 5 demonstrated how VPCs can detect BQL-induced bias in parameter estimates. The inclusion of information about the predicted fraction of BQL samples was found to increase the power of detecting a model misspecification. This was most obvious for model C and substitution with LOQ/2 where no signals of misspecification were seen in the upper panel for the continuous predictions (Fig. 5). It should be pointed out that we in these examples know that the indicated model misspecification is due to incorrect handling of BQL observations. In a real life example misspecifications could also be the result of for example an incorrect structural model.
The double panel VPC plots can, independently of the estimation method, be a useful diagnostic tool. For example, the VPC plots may help in choosing a suitable value for BQL substitution in the cases where the likelihood based methods (M3 and M2) could not be applied due to unacceptable long runtimes. Substituting the BQL values with a fixed value will always be a crude and suboptimal approach but sometimes selected for practical reasons. In these cases a suitable value to use for these substitutions could be evaluated by comparison of VPCs for different substitutions. Furthermore, it can be useful to perform simulation and re-estimation to investigate any method applied to handle BQL samples. By simulating with the suggested model and applying a similar handling of data below LOQ when re-estimating the model parameters a good indication on the performance of the applied method can be obtained. This type of investigation could be performed both prospectively for a planned study and in retrospective with the realized design of a finalized study.
CONCLUSIONS
The M3 method is currently the best option for handling BQL data in NONMEM. Acknowledging the presence of BQL observations strengthens the diagnostic value of visual predictive checks.
APPENDIX
References
- 1.FDA guidance for industry bioanalytical method validation. http://www.fdagov/cder/guidance/4252fnl.pdf (accessed 05/05/2007).
- 2.Duval V, Karlsson MO. Impact of omission or replacement of data below the limit of quantification on parameter estimates in a two-compartment model. Pharm Res. 2002;19(12):1835–1840. doi: 10.1023/A:1021441407898. [DOI] [PubMed] [Google Scholar]
- 3.Bergstrand M, Plan E, Kjellsson M, Karlsson MO. A comparison of methods for handling of data below the limit of quantification in NONMEM VI. PAGE 16 (2007) Abstr 1201 [www.page-meeting.org/?abstract=1201].
- 4.Hing JP, Woolfrey SG, Greenslade D, Wright PM. Analysis of toxicokinetic data using NONMEM: impact of quantification limit and replacement strategies for censored data. J Pharmacokinet Pharmacodyn. 2001;28(5):465–479. doi: 10.1023/A:1012247131190. [DOI] [PubMed] [Google Scholar]
- 5.Beal SL. Ways to fit a PK model with some data below the quantification limit. J Pharmacokinet Pharmacodyn. 2001;28(5):481–504. doi: 10.1023/A:1012299115260. [DOI] [PubMed] [Google Scholar]
- 6.Beal SL, Sheiner LB, Boeckmann AJ. NONMEM User's Guides. Ellicot City: MD: Icon Development Solutions; 1989–2006.
- 7.Ahn JE, Karlsson MO, Dunne A, Ludden TM. Likelihood based approaches to handling data below the quantification limit using NONMEM VI. J Pharmacokinet Pharmacodyn 2008 Aug 7. [DOI] [PubMed]
- 8.Byon W, Fletcher CV, Brundage RC. Impact of censoring data below an arbitrary quantification limit on structural model misspecification. J Pharmacokinet Pharmacodyn. 2008;35(1):101–116. doi: 10.1007/s10928-007-9078-9. [DOI] [PubMed] [Google Scholar]
- 9.Holford N. The Visual Predictive Check—Superiority to Standard Diagnostic (Rorschach) Plots. PAGE 14 (2005) Abstr 738 [www.page-meeting.org/?abstract=738].
- 10.Lindbom L, Pihlgren P, Jonsson EN. PsN-Toolkit—a collection of computer intensive statistical methods for non-linear mixed effect modeling using NONMEM. Comput Methods Programs Biomed. 2005;79(3):241–257. doi: 10.1016/j.cmpb.2005.04.005. [DOI] [PubMed] [Google Scholar]
- 11.Lindbom L, Ribbing J, Jonsson EN. Perl-speaks-NONMEM (PsN)—a Perl module for NONMEM related programming. Comput Methods Programs Biomed. 2004;75(2):85–94. doi: 10.1016/j.cmpb.2003.11.003. [DOI] [PubMed] [Google Scholar]
- 12.Jonsson EN, Karlsson MO. Xpose–an S-PLUS based population pharmacokinetic/pharmacodynamic model building aid for NONMEM. Comput Methods Programs Biomed. 1999;58(1):51–64. doi: 10.1016/S0169-2607(98)00067-4. [DOI] [PubMed] [Google Scholar]
- 13.R Development Core Team (2005). R: A language and environment for statistical computing, reference index version 2.7.0. R Foundation for Statistical Computing, Vienna, Austria. ISBN 3-900051-07-0, URL http://www.R-project.org.
- 14.Wilkins JJ, Savic RM, Karlsson MO, Langdon G, McIlleron H, Pillai G, et al. Population pharmacokinetics of rifampin in pulmonary tuberculosis patients, including a semimechanistic model to describe variable absorption. Antimicrob Agents Chemother. 2008;52(6):2138–2148. doi: 10.1128/AAC.00461-07. [DOI] [PMC free article] [PubMed] [Google Scholar]
- 15.Dayneka NL, Garg V, Jusko WJ. Comparison of four basic models of indirect pharmacodynamic responses. J Pharmacokinet Biopharm. 1993;21(4):457–478. doi: 10.1007/BF01061691. [DOI] [PMC free article] [PubMed] [Google Scholar]


