

Abstract
Background
Resilience, i.e., the ability to cope with stress and adversity, relies heavily on judging adaptively complex situations. Judging facial emotions is a complex process of daily living that is important for evaluating the affective context of uncertain situations, which could be related to the individual's level of resilience. We used a novel experimental paradigm to test the hypothesis that highly resilient individuals show a judgment bias towards positive emotions.
Methods
65 non-treatment seeking subjects completed a forced emotional choice task when presented with neutral faces and faces morphed to display a range of emotional intensities across sadness, fear, and happiness.
Results
Overall, neutral faces were judged more often to be sad or fearful than happy. Furthermore, high compared to low resilient individuals showed a bias towards happiness, particularly when judging neutral faces.
Limitations
This is a cross-sectional study with a non-clinical sample.
Conclusions
These results support the hypothesis that resilient individuals show a bias towards positive emotions when faced with uncertain emotional expressions. This capacity may contribute to their ability to better cope with certain types of difficult situations, perhaps especially those that are interpersonal in nature.
Keywords: Emotion perception, Resilience, Facial expressions, Neutral faces
Introduction
Resilience refers to (1) the ability to cope effectively with stress and adversity and (2) the positive growth following homeostatic disruption (Richardson, 2002). In particular, resilient individuals often generate positive emotions to rebound from stressful encounters (Tugade et al., 2004). Nevertheless, the experimental assessment of resilience is challenging and requires novel behavioral and neural systems techniques (Charney, 2006). Because of the origin of this construct in developmental psychology, the vast majority of data on resilience has been collected in young children or adolescents (Masten, 2001;Rutter, 1985;Werner, 1984), whereas much less is known about resilience in young adulthood.
Resilience is a complex and possibly multi-dimensional construct. It includes trait variables such as temperament and personality as well as cognitive functions such as problem-solving that may work together for an individual to adequately cope with traumatic events. Here, we focus on resilience in terms of a process through which individuals successfully cope with (and bounce back from) stress (e.g., after being fired from a job, an individual adopts a proactive style improving his job hunting and work performance), rather than a simple recovery from insult (e.g., job loss causes a period of initial depressive mood followed by a return to affective baseline without attempting to modify habitual coping mechanisms to prevent its reoccurrence).
Because communicating emotion involves primarily facial expressions, adequately decoding a facial expression is the first step in understanding the emotional state of others and, thus, has profound consequences for individuals to adequately respond to such situations. Therefore, presenting subjects with uncertain emotional faces may provide a way of experimentally probing an individual's ability to cope with complex emotional situations. If this is true, one would expect high resilient individuals to judge emotional faces differently than norm or low resilient individuals. Neutral faces can be an excellent way to examine biases related to trait personality features such as anxiety, depression, and resilience. For the current experiment, we designed a task composed of facial stimuli depicting neutral emotion as well as fear, sadness and happiness to assess those emotions commonly associated with anxiety, depression and resilience, respectively.
The goal of this study is twofold. First, we explored whether all participants show an overall bias towards certain emotions and investigated the degree to which neutral facial expressions are judged as neutral. We predicted that, if neutral faces truly lack emotional valence, we would observe that participants, when given a binary forced choice, would equally often choose a positive or negative rating, respectively. If, on the contrary, neutral faces are seen positively or negatively, we would expect significant differences in the frequencies of positive versus negative emotion judgments. Second, our main objective was to determine whether individuals who score high on a self-report measure of resiliency (as measured by the Connor-Davidson Resilience Scale; CD-RISC; Connor et al., 2003) show a positive bias during emotion judgment relative to low-resilient subjects in the absence of differential sensitivity to detect emotions. Additionally, we predicted that individuals high on resilience (HRes) would classify neutral expressions more often as positively valenced when compared to low resilient (LRes) subjects.
Methods
Subjects
This study was approved by the University of California San Diego (UCSD) and San Diego State University (SDSU) Institutional Review Boards and all subjects provided written informed consent to participate. Sixty-five undergraduate SDSU students (33 Caucasian, 7 Asian American, 16 Hispanic, 6 Filipino, 1 Mixed/Other) participated in the current experiment in return for course credit. Several online screening tests were administered, including the Spielberger State-Trait Anxiety Inventory Trait (STAIT, Spielberger, 1983), the Beck Depression Inventory (BDI; Beck et al., 1961), the NEO Five Factor Inventory (NEO-FFI; Costa et al., 1992), and a 10-item abridged version of the CD-RISC (Campbell-Sills et al., 2007).
The total sample for the current experiment was composed of 51 females and 14 males, age 18.5 (SD = 1.45, range 17-26), with an average education level of 13.4 (SD = 0.7, range 13-16). We have previously used percentile-based definitions to operationalize “high” and “low” trait levels of anxiety (Simmons et al., 2006;Stein et al., 2007). Using the 10-item shortened version of the CD-RISC, and similar to approaches of other investigators (e.g., Bonanno et al., 2002), we selected two “extreme” groups to divide our sample into subjects with high (HRes) and low (LRes) resilience. That is, the LRes group included those falling at or below the 20th percentile (n = 22, 19 females, age = 18 and SD = 1.9, years of education = 13.2 and SD = 0.4) and the HRes group included those falling at the 80th percentile and above (n = 15, 10 females, age = 18 and SD = 0.5, years of education = 13.2 and SD = 0.4). Means and standard deviations for both groups in clinical measures are reflected on Table 1. Additionally, there were no significant between-group differences regarding male/female participant ratio (χ2(1) = 1.83; p > 0.1).
Table 1.
Means and standard deviation for clinical measures in High and Low resilience groups.
| Low Resilience (N = 22) |
High Resilience (N = 15) |
||||||
|---|---|---|---|---|---|---|---|
| Mean | SD | Range | Mean | SD | Range | t value | |
| BDI total | 16.6 | 8.5 | 0-38 | 31.7 | 4.8 | 24-40 | 7.3** |
| STAI-Trait | 49.2 | 9.3 | 33-66 | 2.9 | 2.1 | 0-8 | 7.4** |
| Neuroticism T-score | 56.3 | 8.2 | 37-73 | 42.3 | 8 | 28-52 | 5.1** |
| Extraversion T-score | 41.1 | 7.5 | 28-59 | 53.8 | 10.3 | 36-70 | -4.3** |
| Openness T-score | 48.2 | 10.7 | 29-71 | 51.6 | 8.8 | 39-70 | -1 |
| Agreeableness T-score | 46 | 10.2 | 30-71 | 47.5 | 12 | 30-65 | -0.4 |
| Conscientiousness T-score | 49.2 | 11.6 | 33-72 | 54 | 7.7 | 43-68 | -1.4 |
p < 0.01
Task description
During the Explicit Morphed Faces (EMF) task, positive (i.e., happy), negative (i.e., fearful, sad) and neutral valence emotional faces of Caucasian individuals are presented on a 15 inch LCD monitor (see Figure 1). These stimuli had been generated by utilizing commercially available morphing software (for details see Winston et al., 2003). The emotional faces were presented in 3 levels of intensity (low, medium, high). That is, sad, fearful, and happy faces were morphed with neutral faces creating three possible intensity levels (low: 1/3 of maximum intensity; medium: 2/3 of maximum intensity; high: 3/3 of maximum intensity) for each emotion along the spectrum between the two starting images (i.e., neutral face and fearful, sad, or happy face; see Figure 1). Participants are given a binary response option to judge the emotional facial expression (i.e., fearful or sad [F-S], happy or fearful [H-F], and sad or happy [S-H]). The instructions are as follows: “You will see a face on the screen, as pictured below. You will be asked to decide whether the face is either sad or happy or fearful or sad or happy or fearful. The two choices will appear half a second before the face. You will have about 3 seconds to see the face.” Response options are presented for 1000 ms before the facial stimulus, and both (probe and response options) remain on the screen for 2500 ms. There are three different trial types corresponding to each pair-response option, each presented with every one of the 7 target stimuli that represent each morphing intensity degree in the pair, that is, three levels of intensity for each of the emotions, and a neutral facial expression. Thus, emotional ratings for each trial are normalized into a scale from 0 to 1 so that, for instance, in an F-S trial, a score of 0.25 would represent a 25% selection of “sad” and a 75% of “fearful” within that trial type. Ten complete face sets were used, each presented in 7 morphing intensity ranges for all 3 trial types. Thus, 210 - 3.5 second trials presented in a pseudorandom order were completed for a total task time of 735 seconds. Response selection and latency were recorded for each response.
Figure 1. Explicit Morphed Faces (EMF) task.
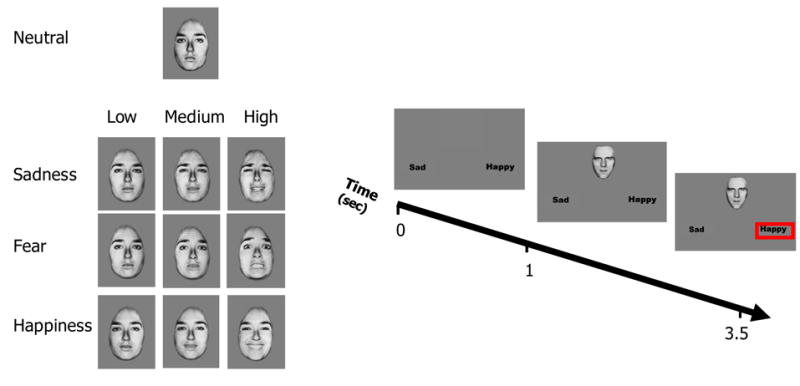
Note: On the left side of the figure, an example of each of the different intensities of emotional expressions is presented. On the right side, a diagram of the Explicit Morphed Faces task is depicted: At the beginning of each trial, response options are presented for 1000 ms. A facial stimulus appears so both probe and response options remain on the screen an additional 2500 ms. During this time the subject makes a judgment regarding the emotion depicted in the faces and presses the button accordingly. As a result a (red) rectangle indicates the chosen response.
Results
Evaluation of Neutral Emotions
The fractions of responding to the different morphed faces for all 65 participants are summarized in Table 2. In order to evaluate the perception of emotionally neutral faces, three one-sample t-tests were run for each trial type. Results revealed that, (1) when choosing between fearful and sad, participants were more likely to classify neutral faces as sad (t (64) = 20.01, p < 0.001); (2) when choosing between happy and fearful, neutral faces were more often classified as fearful (t (64) = 3.83, p < 0.001); and (3) when choosing between sad and happy, neutral faces were more often classified as sad (t (64) = 15.39, p < 0.001). Thus, there was an overall tendency to classify neutral faces under a negative (i.e., non-happy) valence emotion. Subjects' reaction times (RTs) were significantly shorter when deciding between antonymous emotions (i.e., happy vs. sad) in comparison to non-antonymous emotions (i.e., fearful vs. sad [t (64) = 3.56, p < 0.001], and happy vs. fearful [t (64) = 4.11, p < 0.001]).
Table 2.
Response fractions to different degrees of emotion intensity during Emotional Morphed Faces task.
| High | Med | Low | Neutral | Low | Med | High | |
|---|---|---|---|---|---|---|---|
| Trial Type | Fearful | Sad | |||||
| Fraction (Sad) | .05 (.09) | .23 (.17) | .7 (.19) | .87 (.15) | .86 (.15) | .81 (.16) | .74 (.17) |
| Trial Type | Happy | Fearful | |||||
| Fraction (Fear) | .02 (.04) | .04 (.05) | .28 (.18) | .6 (.21) | .74 (.19) | .93 (.08) | .97 (.06) |
| Trial Type | Sad | Happy | |||||
| Fraction (Happy) | .03 (.05) | .04 (.07) | .16 (.14) | .2 (.16) | .65 (.23) | .98 (.05) | .99 (.04) |
Note: Means and (Standard Deviations) represent response fractions for Sad, Fearful and Happy in each response trial type (i.e., Fearful-Sad [F-S], Happy-Fearful [H-F], and Sad-Happy).
Bias and sensitivity estimates of emotional perception
For each subject we obtained an estimation of the sensitivity and bias parameter according to the following sigmoid function:
using a general-purpose optimization based on quasi-Newton algorithms implemented in the statistical package R (Ihaka et al., 1996). We utilized this function because the parameters directly quantify the slope, i.e., the rate of change of judgment as a function of morphing, and the bias, i.e., the left- or right-shift towards overall higher or lower ratings of the fraction of the emotion, respectively. The resulting parameter estimates for sensitivity and bias were used in secondary analyses to determine whether resilience affected judgment sensitivity or bias. Sensitivity corresponds to the slope of the function that represents the ratings for each emotional intensity fraction. Thus, sensitivity is the ability to discriminate between different degrees of emotional intensity. Bias, on the other hand, represents the tendency to classify the facial stimuli towards one or another emotion.
Considering the entire sample of participants, three one-sample t-tests assessing bias estimates were run for each trial type. Results revealed a bias toward sadness during both F-S (t (64) = -5.82, p < 0.001) and S-H (t (64) = 9.42, p < 0.001). In order to evaluate sensitivity differences between emotions, paired sample t-tests comparing trial types against each other revealed significantly greater sensitivity to happiness as compared to sadness (t = 5.4, p = 0.001) and fear (t = 4.6, p = 0.001), but not for fear as compared to sadness (t = 0.6, p > 0.05).
Between-group differences: Sensitivity and bias in emotional perception
We hypothesized that resilience would be related to emotional bias. Specifically, we predicted that individuals high on resilience would present a positive bias when choosing between a negative and a positive emotion alternative. Regarding sensitivity, our prediction was that resiliency would not be related to sensitivity to variations of the morphed face.
Two mixed ANOVAs with group (high and low resilience) as between- and trial type (F-S, H-F, S-H) as within-subjects factors were performed to assess differences in sensitivity and bias. There was no group by trial type interaction detected for sensitivity (F (2, 34) = 0.11, p = ns, eta2 = 0.003). Regarding bias, there was a main effect of trial type (F (2, 70) = 32.6, p < 0.001, eta2 = 0.482) and a group by trial type interaction (F (2, 70) = 3.63, p < 0.05, eta2 = 0.094). Independent-sample t-tests indicated that, as predicted, the HRes group presented a greater bias towards happiness in both H-F (t (35) = -2.74, p = 0.01) and S-H (t (35) = 2.73, p = 0.01) pairings but groups did not differ on sensitivity estimates (t (35) = -22, p > 0.05 and t (35) = 0.41, p > 0.05, respectively). There were no between-group differences detected for bias (t (35) = 0.02; p > 0.05) or sensitivity (t (35) = 0.26, p > 0.05) during F-S parings. Bias estimates for each emotional pair were plotted in a triangular graph for better visualization of group differences (see Figure 2).
Figure 2. Emotional Bias and Rating of Neutral Faces in High and Low Resilient Individuals.
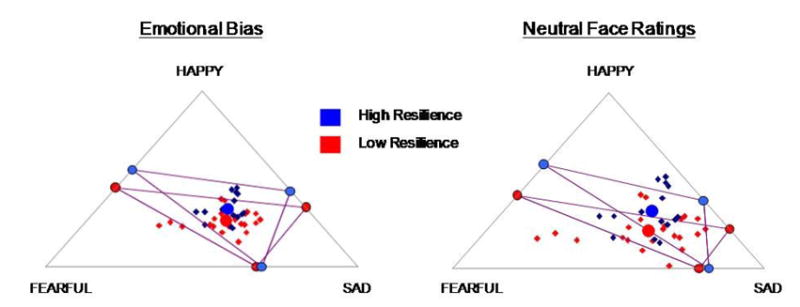
Notes: Each side of both triangles represents each type of trial or binary response option. On the left triangle, each emotion bias is represented along the edges of the triangle, and the combination (i.e., intersection) of all three is represented as a point within the triangle for each resilience group. The midpoint of the sides is where bias = 0 for the given contrast. The end points of the sides are where bias = ±1.5 (or ∼ 75% morphed emotion). The small dots represent individual bias (red=LRes, blue=HRes), the large dots represents the group bias, and the internal triangles show the group bias on response option. In this figure, a strong bias towards an emotion is plotted closer to the labeled vertex. Similarly, in the right triangle, each emotion judgment (of neutral faces) within each pair is represented along the edges of the triangle, and the combination (i.e., intersection) of all three emotional judgments is represented with a small dot within the triangle for each individual, and with a larger dot for each resilience group. That is, the positioning along the lines between happy and fearful is determined by the fraction to which an individual rated a neutral face as happy or fearful. The overall projection across the three comparisons is the geometric average of all trial types. Thus, a completely neutral judgment would project onto the center of the triangle.
Between-group differences: Resilience is related to the judgment of neutral faces
Independent sample t-tests indicated that HRes individuals rated neutral faces more often as happy instead of either fearful (t (35) = 3.37, p < 0.01) or sad (t (35) = 2.16, p < 0.05) than those with LRes scores. Nevertheless, there were no differences during F-S pairings. When ratings from all emotional pairs were plotted onto the same graph, HRes individuals showed a clear tendency towards rating neutral faces happier than LRes (see Figure 2). There were no differences between groups for response latencies (data not shown).
Degree of resilience on emotional face judgment: Dimensional Analyses
We assessed the relationship between resilience and bias as well as the rating of neutral faces for each trial type including all 65 participants. Correlation analysis suggested that resilience was positively related to frequency of happy responses to neutral faces during H-F (rho = 0.33, p < 0.01) and bias towards happiness during S-H trials (rho = 0.30, p < 0.05). For these two significant correlations, we investigated whether the relationship between resilience and neutral faces rating during H-F, on the one hand, and bias towards happiness during S-H trials, on the other hand, were better explained by resilience, anxiety, depression, extraversion or neuroticism. Two stepwise regression analyses were conducted for each dependent variable (i.e., either % happy responses to neutral faces during H-F trials, or bias toward happy responses during S-H) including the following predictors: resilience (as measured by the CD-RISC; Connor and Davidson, 2003), trait anxiety (as measured by the STAIT; Spielberger, 1983), state depression (BDI; Beck, Ward, Medelson, Mock, and Erbaugh, 1961) as well as extraversion and neuroticism from the NEO-FFI (Costa and McCrae, 1992). Results suggested that extraversion but no other predictor (including resilience) significantly accounted for S-H bias (β = -.29, t = -2.38, p < .05). However, for the H-F neutral face %, resilience was the only significant predictor (β = -.37, t = - 3.18, p < .01); i.e., STAI-T, BDI, NEO-N and NEO-E were not significant predictors once the variance attributable to resilience was accounted for (data not shown).
Discussion
This investigation yielded two main results. First, participants presented a general tendency to perceive neutral faces as negative and an overall emotional bias towards sadness. Higher levels of resiliency were associated with judging neutral faces less negatively, and presenting a greater general bias towards happiness when compared to low resilient participants. Second, trait anxiety, state depression, extraversion and neuroticism were unable to account for the relationship between resilience and the (less negative) judgment of neutral faces. Taken together, a positive bias in high resilient individuals during emotion judgment and an attenuated perception of perceiving neutral expressions as negative, may provide insight into how resilient individuals engage cognitive and affective processes to decode emotional aspects of facial expressions. This altered engagement may contribute to their efficient adaptation in difficult interpersonal situations.
Our results indicate a general bias towards viewing neutral faces as sad, which is consistent with previous investigations that have reported that, when a neutral face is mislabeled, it is often considered sad (Gur et al., 2002;Rojahn et al., 1997). Some investigators have suggested that the context in which neutral faces are presented can influence judgment so that neutral faces presented among happy faces are considered sad (Russell, 1991). That is, it is not only the currently processed stimulus but also its preceding context can influence this emotion judgment (Kuleshov effect; Prince et al., 1992). However, this would not be a plausible explanation for the current results since our stimuli were presented in a pseudorandom order to assure equal number of neutral faces after a happy, sad, and fearful expression.
In the current study, this overall sadness bias, particularly during neutral face evaluation, was further related to the degree of self-reported resilience, resulting in a greater tendency toward happiness perception and reduced sadness bias in highly resilient individuals during H-F and S-H pairings. Taking into account the entire sample, we also observed a positive relationship between resilience and happiness perception while evaluating neutral faces. These results are consistent with observations that resilient individuals are able to generate positive emotions to help them cope with stressful situations (Tugade, Fredrickson, and Barrett, 2004). According to Fredrickson's broaden-and-build theory, positive emotions facilitate enduring personal resources and broaden one's momentary thought of action repertoire (Fredrickson, 2004). That is, positive emotions broaden one's awareness and encourage novel, varied, and exploratory thoughts and actions which, in turn, build skills and resources. For example, experiencing a pleasant interaction with a person you asked for directions turns, over time, into a supportive friendship. Furthermore, positive emotions help resilient individuals to achieve effective coping (Werner et al., 1992) serving to moderate stress reactivity and mediate stress recovery (Ong et al., 2006). We suggest as an explanation for our findings that individuals high on self-reported resilience may be more likely to process information that is congruent with a positive view of the world, and that this capacity helps maintain their homeostasis. This positive bias during emotion perception may provide the rose-colored glasses that resilient individuals use to interpret the world and achieve effective ways to bounce back from adversity (Bonanno, 2004) and maintain wellness.
We explored whether the relationship between resilience and bias as well as the perception of neutral faces were better accounted for by trait anxiety, extraversion, neuroticism, or by current levels of depression. Results revealed that, on the one hand, resilience was the best predictor of neutral face rating and, on the other hand, extraversion was the best predictor for bias. Thus, despite a strong negative correlation between resilience and anxiety (see also Campbell-Sills, Cohan, and Stein, 2006), depression and neuroticism as well as a positive relationship with extraversion, our results suggest that: 1) extraversion may play an important role for an overall bias towards positive emotion and 2) resilience may be a more specific component in the face of ambiguity (i.e., neutral faces). Thus, we can conclude that the construct of resilience may offer a perspective on physical and psychological response to stress that is not the mere inverse of psychopathology.
There are several limitations to the current study. We are aware of cross-cultural differences in the agreement of facially depicted emotions both in the receiver (Hart et al., 2000) and sender (Hess et al., 2000). Future studies should consider paradigms including multi-ethnic participants/actors as well as incorporate other positive and negative stimuli to rule out whether this effect is specific to facial stimuli. Taking into account the limitations of a self-report instrument, our measure of resilience may be biased in the direction of social desirability. Experimental manipulation of stress induction followed by task performance (e.g., facial perception of emotion) should be developed as an in vivo validation of an objective measure of “online” resilience. Due to task limitations, the current paradigm included an unequal number of positive (one, happy) and negative (two, sad and fearful) emotions that may have partially contributed to a general negative bias response. Nevertheless, this limitation should not account for the effect of resilience on emotional bias. Finally, our study did not include a “neutral emotion” response alternative. This is an inevitable consequence of studying emotional bias in perception. However, a previous study in which neutral was a response option (Rojahn and Warren, 1997) reported that when participants mislabeled the emotion, there was a bias towards negative affect (i.e., sad or angry).
The fact that even non-treatment seeking volunteers do not consider “neutral” faces equally often as happy or sad has important repercussions in the study of emotions using subtraction techniques. That is, in functional neuroimaging studies, when comparing positive or negative to neutral facial emotions, the non-neutrality of neutral faces may be eliminating the effect of sad, and polarizing that of positive expressions, respectively. Moreover, amygdala activation has been associated with novel (Schwartz et al., 2003) and unfamiliar (Hart, Whalen, Shin, McInerney, Fischer, and Rauch, 2000) faces claiming the role of this limbic structure in salient stimulus processing (Wright et al., 2006). Although this may be a plausible explanation, it should be clarified whether these faces were considered neutral and not negatively valenced. Future experiments may implement a baseline or comparator condition that does not involve faces (e.g., shapes).
In summary, our study suggests that resilience may be associated with positive emotional perception as reflected by an attenuated bias towards negative affect. That is, resilience – and not other traits such as neuroticism or anxiety or states such as depression – may provide the rose-colored glasses used when individuals are forced to make an affective assessment in the context of an uncertain emotional situation. Taken together, these data have practical implications for studies using neutral faces as a comparator to several emotions and, moreover, suggest the importance of resilience and its influence on the way we perceive our interpersonal world.
Footnotes
Publisher's Disclaimer: This is a PDF file of an unedited manuscript that has been accepted for publication. As a service to our customers we are providing this early version of the manuscript. The manuscript will undergo copyediting, typesetting, and review of the resulting proof before it is published in its final citable form. Please note that during the production process errors may be discovered which could affect the content, and all legal disclaimers that apply to the journal pertain.
Reference List
- Beck AT, Ward CH, Medelson M, Mock J, Erbaugh J. An inventory for measuring depression. Arch Gen Psychiatry. 1961;4:561–571. doi: 10.1001/archpsyc.1961.01710120031004. [DOI] [PubMed] [Google Scholar]
- Bonanno GA. Loss, trauma, and human resilience - Have we underestimated the human capacity to thrive after extremely aversive events? American Psychologist. 2004;59(1):20–28. doi: 10.1037/0003-066X.59.1.20. [DOI] [PubMed] [Google Scholar]
- Bonanno GA, Wortman CB, Lehman DR, Tweed RG, Haring M, Sonnega J, Carr D, Nesse RM. Resilience to loss and chronic grief: a prospective study from preloss to 18-months postloss. J Pers Soc Psychol. 2002;83(5):1150–1164. doi: 10.1037//0022-3514.83.5.1150. [DOI] [PubMed] [Google Scholar]
- Campbell-Sills L, Cohan SL, Stein MB. Relationship of resilience to personality, coping, and psychiatric symptoms in young adults. Behav Res Ther. 2006;44(4):585–599. doi: 10.1016/j.brat.2005.05.001. [DOI] [PubMed] [Google Scholar]
- Campbell-Sills L, Stein MB. Psychometric Analysis and Refinement of the Connor Davidson Resilience Scale (CD-RISC): Validation of a 10-item Measure of Resilience. Journal of Traumatic Stress. 2007 doi: 10.1002/jts.20271. [DOI] [PubMed] [Google Scholar]
- Charney DS. The psychobiology of resilience to extreme stress: Implications for the prevention and treatment of mood and anxiety disorders. Biological Psychiatry. 2006;59(8):91S. [Google Scholar]
- Connor KM, Davidson JR. Development of a new resilience scale: the Connor-Davidson Resilience Scale (CD-RISC) Depress Anxiety. 2003;18(2):76–82. doi: 10.1002/da.10113. [DOI] [PubMed] [Google Scholar]
- Costa PT, McCrae RR. Normal personality assessment in clinical practice: the NEO Personality Inventory. Psychological Assessment. 1992;4:5–13. [Google Scholar]
- Fredrickson BL. The broaden-and-build theory of positive emotions. Philosophical Transactions of the Royal Society of London Series B-Biological Sciences. 2004;359(1449):1367–1377. doi: 10.1098/rstb.2004.1512. [DOI] [PMC free article] [PubMed] [Google Scholar]
- Gur RC, Sara R, Hagendoorn M, Marom O, Hughett P, Macy L, Turner T, Bajcsy R, Posner A, Gur RE. A method for obtaining 3-dimensional facial expressions and its standardization for use in neurocognitive studies. J Neurosci Methods. 2002;115(2):137–143. doi: 10.1016/s0165-0270(02)00006-7. [DOI] [PubMed] [Google Scholar]
- Hart AJ, Whalen PJ, Shin LM, McInerney SC, Fischer H, Rauch SL. Differential response in the human amygdala to racial outgroup vs ingroup face stimuli. Neuroreport. 2000;11(11):2351–2355. doi: 10.1097/00001756-200008030-00004. [DOI] [PubMed] [Google Scholar]
- Hess U, Blairy S, Kleck RE. The influence of facial emotion displays, gender, and ethnicity on judgments of dominance and affiliation. Journal of Nonverbal Behavior. 2000;24(4):265–283. [Google Scholar]
- Ihaka R, Gentleman RR. A Language for Data Analysis and Graphics. Journal of Computational and Graphical Statistics. 1996;5(3):299–314. Ref Type: Journal (Full) [Google Scholar]
- Luthar SS, Cicchetti D, Becker B. The construct of resilience: a critical evaluation and guidelines for future work. Child Dev. 2000;71(3):543–562. doi: 10.1111/1467-8624.00164. [DOI] [PMC free article] [PubMed] [Google Scholar]
- Masten AS. Ordinary magic. Resilience processes in development. Am Psychol. 2001;56(3):227–238. doi: 10.1037//0003-066x.56.3.227. [DOI] [PubMed] [Google Scholar]
- Ong AD, Bergeman CS, Bisconti TL, Wallace KA. Psychological resilience, positive emotions, and successful adaptation to stress in later life. J Pers Soc Psychol. 2006;91(4):730–749. doi: 10.1037/0022-3514.91.4.730. [DOI] [PubMed] [Google Scholar]
- Prince S, Hensley WE. The Kuleshov-Effect + Film Editing and Russian Film History -Recreating the Classic Experiment. Cinema Journal. 1992;31(2):59–75. [Google Scholar]
- Richardson GE. The metatheory of resilience and resiliency. Journal of Clinical Psychology. 2002;58(3):307–321. doi: 10.1002/jclp.10020. [DOI] [PubMed] [Google Scholar]
- Rojahn J, Warren VJ. Emotion recognition as a function of social competence and depressed mood in individuals with intellectual disability. J Intellect Disabil Res. 1997;41(Pt 6):469–475. doi: 10.1111/j.1365-2788.1997.tb00738.x. [DOI] [PubMed] [Google Scholar]
- Russell JA. The contempt expression and the relativity thesis. Motivation and Emotion. 1991;15(2):149–168. [Google Scholar]
- Rutter M. Resilience in the face of adversity. Protective factors and resistance to psychiatric disorder. Br J Psychiatry. 1985;147:598–611. doi: 10.1192/bjp.147.6.598. [DOI] [PubMed] [Google Scholar]
- Schwartz CE, Wright CI, Shin LM, Kagan J, Whalen PJ, McMullin KG, Rauch SL. Differential amygdalar response to novel versus newly familiar neutral faces: a functional MRI probe developed for studying inhibited temperament. Biol Psychiatry. 2003;53(10):854–862. doi: 10.1016/s0006-3223(02)01906-6. [DOI] [PubMed] [Google Scholar]
- Simmons A, Strigo I, Matthews SC, Paulus MP, Stein MB. Anticipation of aversive visual stimuli is associated with increased insula activation in anxiety-prone subjects. Biol Psychiatry. 2006;60(4):402–409. doi: 10.1016/j.biopsych.2006.04.038. [DOI] [PubMed] [Google Scholar]
- Spielberger CD. Manual for the State-Trait Anxiety Inventory (Form Y) Consulting Psychologists Press; Palo Alto, CA: 1983. [Google Scholar]
- Stein MB, Simmons AN, Feinstein JS, Paulus MP. Increased amygdala and insula activation during emotion processing in anxiety-prone subjects. Am J Psychiatry. 2007;164(2):318–327. doi: 10.1176/ajp.2007.164.2.318. [DOI] [PubMed] [Google Scholar]
- Tugade MM, Fredrickson BL, Barrett LF. Psychological resilience and positive emotional granularity: examining the benefits of positive emotions on coping and health. J Pers. 2004;72(6):1161–1190. doi: 10.1111/j.1467-6494.2004.00294.x. [DOI] [PMC free article] [PubMed] [Google Scholar]
- Werner E, Smith RS. Overcoming the odds: high risk children from birth to adulthood. Cornell; Ithaca, NY: 1992. [Google Scholar]
- Werner EE. Resilient children. Young Children. 1984;40:68–72. [Google Scholar]
- Winston JS, O'Doherty J, Dolan RJ. Common and distinct neural responses during direct and incidental processing of multiple facial emotions. Neuroimage. 2003;20(1):84–97. doi: 10.1016/s1053-8119(03)00303-3. [DOI] [PubMed] [Google Scholar]
- Wright P, Liu Y. Neutral faces activate the amygdala during identity matching. Neuroimage. 2006;29(2):628–636. doi: 10.1016/j.neuroimage.2005.07.047. [DOI] [PubMed] [Google Scholar]