

Abstract
A plethora of myeloma growth factors (MGF) has been identified, but their relative importance and cooperation has not been determined. We investigated 5 well-documented MGF (IL-6, IGF-1, HGF, HB-EGF, APRIL) in serum-free cultures of human myeloma cell lines (HMCLs). In all of 3 CD45− HMCLs, an autocrine IGF-1 loop promoted autonomous survival. To the contrary, all 5 CD45+ HMCLs could not survive and required addition of either IL-6 (5/5), IGF-1 (4/5), HGF (1/5), HB-EGF (1/5) or APRIL (1/5). IGF-1 was the major MGF since its activity was abrogated by an IGF-1R inhibitor only, whereas IL-6, HGF or HB-EGF activity was inhibited by both IGF-1R- and receptor-specific inhibition. APRIL activity was inhibited by its specific inhibitor only.
Of the investigated MGF and their receptors, only expressions of IGF-1R and IL-6R in myeloma cells (MMC) of patients delineate a group with adverse prognosis. This is mainly explained by a strong association of IGF-1R and IL-6R expression and t(4;14) translocation, but IGF-1R expression in MMC, without t(4;14) can also have a poor prognosis. Thus, IGF-1 targeted therapy – eventually in combination with anti-IL-6 therapy - could be promising in a subset of patients with MMC expressing IGF-1R.
Keywords: myeloma, IGF-1, IL-6, APRIL, HGF, growth factor
Introduction
Multiple myeloma (MM) is a clonal plasma-cell disorder. Multiple myeloma cells (MMC) from almost all patients harbor chromosomal abnormalities by FISH 1,2 and aberrant gene expression 3 at diagnosis in symptomatic disease. These abnormalities are not sufficient to promote MMC growth ex vivo and the tumor microenvironment expresses adhesion molecules and produces myeloma growth factors (MGF) that are critical to trigger MMC survival 4,5. A plethora of MGF have been identified: interleukin-6 (IL-6) 6, soluble IL-6 receptor 7, the IL-6 family 8, insulin-like growth factor type 1 (IGF-1) 9,10, BAFF/APRIL B cell growth factors 11,12, the epidermal growth factor (EGF) family 13, hepatocyte growth factor (HGF) 14, tumor necrosis factor (TNF) 15, the Wnt family 16, IL-10 17, IL-21 18, and the NOTCH ligand family 19. Some MGF can be produced by the tumor environment (IL-6, BAFF/APRIL, IGF-1, EGF family, Wnt family, HGF) or by MMC themselves (IL-6, IGF-1, HGF, EGF family, Wnt family, Notch ligand family) 20,21. These MGF activate their specific receptors that in turn result in the activation of several signal transduction pathways 22 including the Janus Kinase/signal transducer and activator of transcription 3 (JAK/STAT3), PI-3 kinase/AKT, Ras/mitogen-activated protein kinase (MAPK), Nuclear Factor-kappa B (NF-κB), and the β-catenin pathway. In a minority of patients with extramedullary proliferation, MMC may grow without the support of the bone marrow microenvironment and human myeloma cell lines (HMCLs) can be obtained. The numerous MGF make it difficult to understand their respective role in the natural history of the disease and whether they are necessary and sufficient or redundant. This is especially relevant since MGF can cooperate to enhance MMC growth as for IL-6 and EGF family members 23, IL-6 and FGF 24, and IL-6 and IGF-1 25. This is complicated by the fact that some growth factors are autocrinely produced or present in the culture medium, thus masking their contribution. Regarding IL-6 and IGF-1, various data were reported using different techniques and focussing on different aspects, which could yield to challenging conclusions. Descamps et al. have reported that IGF-1 MGF activity was restricted to CD45− HMCLs, unlike the CD45+ HMCLs 26. IL-6 could efficiently trigger the growth of CD45+ HMCLs and the IL-6 activity was unaffected by an IGF-1 inhibitor. An explanation was that the phosphastase activity of CD45 downregulates the kinase activity of IGF-1R, making the CD45+ HMCLs unsensitive to IGF-1. Abroun et al. have shown that IL-6 can trigger membrane IL-6R binding to IGF-1R and induce IGF-1R phosphorylation independently of addition of IGF-1 25. In this study, IL-6 is a major MGF making it possible to trigger both gp130 and IGF-1R phosphorylation in case of high IL-6R expression. Mitsiades et al. have shown that the importance of serum IGF-1 to support the IL-6 dependent growth of the ANBL6 cell line 10. Regarding the other MGF, in particular HGF, EGF family or BAFF/APRIL, their respective role was not studied comparatively yet.
Another major question is the in vivo relevance of these MGF. Serum levels of IL-6 and soluble IL-6R and of IGF-1 were linked with bad prognosis 27,28. Divergent data exist regarding the prognostic value of IGF-1R on MMC. With a small cohort of 37 newly-diagnosed patients, Bataille et al. have shown that IGF-1R expression on MMC, detected by FACS analysis, had poor prognosis value 29. Using a cohort of 72 newly-diagnosed patients and IGF-1R expression detected by Affymetrix microarray, Chng et al. 30 failed to find a prognosis value of IGF-1R expression, whereas IGF-1R expression was increased in poor prognosis groups. The prognostic value of the other MGF receptors was not documented yet.
To look for a possible ranking of five well-documented MGF, we used a defined serum-free culture medium able to sustain growth of all our HMCLs to avoid unidentified components present in serum, in particular IGF-1, which might confound interpretation of the results. We also look for the prognostic value of MGF receptor gene expression on MMC using two independent large patient cohorts.
Materials and Methods
Cell samples
The 9 human myeloma cell lines (HMCLs) were obtained in our laboratory 31 or purchased from ATCC (Rockville, MD, USA). They were maintained in RPMI1640 (Gibco Invitrogen, France), 10% fetal bovine serum (FBS, PAA laboratory GmbH, Austria) and for the IL-6-dependant cell lines, with 2 ng/ml of IL-6 (Abcys SA, Paris, France). Normal bone marrow plasma cells (BMPC) were obtained from healthy donors after informed consent was given. Plasma cells, CD27+ memory B cells (MBC) and polyclonal plasmablasts (PPC, CD38++, CD20−) were obtained as previously described 32.
MMC of 171 patients with previously-untreated MM were included after written informed consent was given at the University hospitals of Heidelberg (Germany) or Montpellier (France). These 171 patients were treated with high dose therapy (HDC) and autologous stem cell transplantation (ASCT) and were termed in the following Heidelberg-Montpellier (HM) series. We also used Affymetrix data of a cohort of 345 purified MMC from previously-untreated patients from the Arkansas research group (Little Rock). The patients were treated with total therapy 2 33 and termed in the following LR-TT2 series. These data are publicly available (GEO, http://www.ncbi.nlm.nih.gov/geo/, accession number GSE2658).
Reagents
Human recombinant (r) IL-6 (rIL-6), rIGF-1 and rHGF were purchased from Abcys SA (Paris, France), human rHB-EGF, rAPRIL, anti-human HGF monoclonal antibody (MoAb) and BCMA-Fc from R&D Systems (Minneapolis, MN). The B-E8 anti-IL6 MoAb was a generous gift from Dr Wijdenes (Diaclone, Besancon, France) 34, the NVP-AEW541 IGF-1R inhibitor from Novartis Pharma AG (Basel, Switzerland) 35 and PD169540 pan-ErbB kinase inhibitor from Pfizer Global Research and development (Ann Arbor, MI, USA). We used Syn H, an Iscove-based fully-defined culture medium containing human albumin without insulin (ABCell-Bio, Montpellier, France).
Interphase FISH, microarray hybridization, Real-time RT-PCR
Interphase-FISH-analysis was performed according to our previously reported standard protocol 2. RNA was extracted and hybridized to human Affymetrix microarrays as previously described 36. IGF-1R expression was evaluated by real-time RT-PCR using the assays-on-demand primers and probes and the TaqMan Universal Master Mix (Applied Biosystems, Courtaboeuf, France) as reported 36.
Flow cytometry Analysis
The expression of CD45 isoforms and IGF-1R on HMCLs were evaluated by incubating 5 × 10⁵ cells with PE-conjugated anti-CD45RO, anti-CD45RA (Immunotech, Marseille, France), anti-CD45RB (BD Biosciences, San Diego, CA), anti-IGF-1R (Santa Cruz Biotechnology, Santa Cruz, CA) or an isotype-matched control antibody in phosphate-buffered saline (PBS) and flow cytometry analysis was performed on a FACScan (Becton Dickinson, San Jose, CA).
Growth assay for myeloma cells
HMCLs were IL-6- and serum-starved for 2 hours and cultured for 4 days in 96-well flat-bottomed microtiter plates in serum-free culture medium without cytokine (control) or with either rIL-6 (200 pg/mL), rIGF-1 (100 ng/mL), rHB-EGF (1 μg/mL), rHGF (200 ng/mL), or rAPRIL (200 ng/mL), without or with the B-E8 anti-IL-6 MoAb (10 μg/mL), the IGF-1R inhibitor NVP-AEW541 (1 μM), the anti-HGF MoAb (25 μg/mL), the PD169540 pan-ErbB kinase inhibitor (1 μM), or BCMA-Fc (10 μg/mL). In some experiments, myeloma cells were grown with graded IGF-1 concentrations. The growth of myeloma cells was evaluated by quantifying intracellular ATP amount with a Cell Titer Glo Luminescent Assay (Promega Corporation, Madison, USA) with a Centro LB 960 luminometer (Berthold Technology, Germany).
Signal transduction, IGF-1 production and immunoblot analysis
To look for signal transduction, myeloma cell lines were starved for 18 hours, washed and then incubated with the various pre-warmed MGF with or without inhibitors for 20 minutes. Cells were lysed and transferred to a nitrocellulose membrane (Schleicher and Schuell, Kassel, Germany), as previously described 36. Membranes were immunoblotted with a rabbit anti-IGF-1 (Abcam, Cambridge, United Kingdom), anti-phospho-Akt, anti-phospho-MAPK, anti-phospho-Stat3, anti-Akt, anti-MAPK antibodies (Cell Signaling Technology, Beverly, MA) and with a mouse anti-Stat3 antibody (Cell Signaling technology). As a control for protein loading, we used a mouse monoclonal anti-β-actin antibody (Sigma, St Louis, MO). The primary antibodies were visualized with goat anti-rabbit (Sigma) or goat anti-mouse (Bio-Rad, Hercules, CA) peroxidase-conjugated antibodies by an enhanced chemiluminescence detection system.
Measurement of cytokine concentration by ELISA
HMCLs were cultured for 2 days in Syn H serum-free culture medium without cytokine and IL-6 and IGF-1 in the culture supernatant were measured using ELISA kits with a detection level of 3 pg/ml and 45 pg/ml respectively (R&D, Minneapolis, MN).
Spiked MMSET expression surrogating t(4;14)
The t(4;14) translocation results in aberrant FGFR3 expression in 70% of patients and MMSET spiked expression in 100% of patients 37 and spiked MMSET expression has been taken as surrogate for the presence of t(4;14) 3. In our series of 94 patients with FISH analysis, 20/94 patients had t(4;14) resulting in aberrant FGFR3 expression in 16/20 and spiked MMSET expression (range of Affymetrix signal 500–2500) in 19/20 using the 222777_s_at MMSET probe set with the highest variation coefficient among MMC samples. In the 74 patients lacking t(4;14), no FGFR3 and a low MMSET expression (Affymetrix signal: 1–300) was found. We defined a spiked MMSET gene if MMSET signal ≥ Q3 + 3 (Q3−Q1) with Q3 and Q1 being the MMSET signals of the first and third quartile of MMC samples. Using this definition, 19/20 (95%) of patients with t(4;14) had spiked MMSET and only 2/74 lacking documented t(4;14) had spiked MMSET.
Statistical analysis
A difference in the mean values of two (paired) groups was evaluated with a (paired) student t test using the SPSS10 software. Gene Expression Profiles were analyzed with our bioinformatics platform (RAGE, http://rage.montp.inserm.fr) 38 and with the Amazonia website 39. The prognostic value of a probe set was evaluated combining Affymetrix data obtained with human genome U133 set or U133 Plus 2.0 microarrays. We used the Affymetrix call (“present” or “absent”) that is determined by the Affymetrix GCOS-software as indicator whether a gene is expressed or not. When a probe set was absent in MMC of a fraction of patients (IGF-1R and c-Met), the survival of patients with MMC with a present or absent call was compared. When a probe set was present in MMC of all patients (IL-6R, gp130, TACI, BCMA), the survival of patients with a signal below or above the median signal was compared. The statistical significance of differences in survival between groups of patients was calculated by the log-rank test. An event was defined as relapse or death (for EFS) or as death (for OAS). Multivariate analysis was performed using the Cox proportional hazards model. Survival curves were plotted using the Kaplan-Meier method.
Results
Autocrine IGF-1 is a critical survival factor of autonomously-surviving CD45− HMCLs in serum-free culture medium
Without adding exogenous MGF and in serum-free culture medium, the number of viable cells in 5 HMCLs - XG-1, XG-2, XG-6, XG-12, XG-14 - was decreased at day 4 of culture (Figure 1A) (P ≤ .05). This effect was observed with cell concentrations ranging from 4 × 10³ to 4 × 10⁵ cells/mL. The survival of 3 HMCLs – XG-5, XG-20, XG-7 - was not affected, and XG-7 showed even an increased growth (P ≤ .05) (Figure 1A). A difference between autonomously and non-autonomously-surviving HMCL is CD45 expression. The 3 autonomously-surviving HMCLs expressed the 3 CD45 isoforms either at a low level or not at all (≤ 6%, Figure 1B), and the 5 non-autonomously-surviving HMCLs expressed at least two isoforms, mainly CD45RO and CD45RB. CD45RA+ HMCLs are less frequent and their behavior may not always be representative of the wider spectrum of HMCLs (Figure 1B). Looking for the simultaneous expression of genes coding for a growth factor and its receptors using Affymetrix microarrays, a possible autocrine IL-6/IL-6R/gp130 loop is found in 6/8 HMCLs, an IGF-1/IGF-1R loop in 7/8, an HGF/c-met loop in 2/8, BAFF-APRIL/BAFFR-BCMA-TACI loops in 3/8, and EGF family/ErbB family loops in 8/8 (results not shown). To investigate IGF-1R expression, we used the 203627_at probe set, which is the only one of 8 IGF-1R probe sets that correlated with IGF-1R expression assayed by RT-PCR (r = .85, P = .002) and FACS analysis using HMCLs (r = .67, P = .03).
Figure 1. Survival of myeloma cell lines in serum-free culture medium.
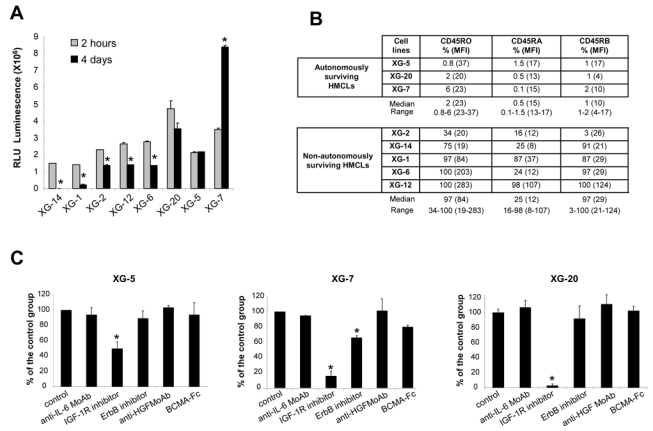
(A) HMCLs were starved for 2 hours and cultured for 4 days without cytokine in the Syn H serum-free culture medium. The cell concentration at the start of the culture was 2 × 10⁵ cells/mL for all HMCLs. Results are the mean luminescent signals of a luciferase assay in 3 independent experiments 2 hours and 4 days after culture start. * the mean value is significantly different from that obtained at 2 hours using a Student t test for pairs (P ≤ .05). (B) CD45 protein expression was determined by flow cytometry using murine anti-CD45RO, anti-CD45RA and anti-CD45RB MoAbs in the 3 autonomously-surviving HMCLs and 5 non-autonomously-surviving ones. The fluorescence intensity was set up in order to get a MFI between 3 and 5 with isotype-matched control antibodies. Results are the percentage of positive cells and in brackets, the mean fluorescence intensity of positive cells. These data are from one experiment representative of 3. (C) XG-5, XG-7 and XG-20 HMCLs were starved for 2 hours and cultured for 4 days without inhibitor (control) or with the anti-IL-6 MoAb (10 μg/mL) or the IGF-1R inhibitor (1 μM) or the pan-ErbB kinase inhibitor (1 μM) or the anti-HGF MoAb (25 μg/mL) or BCMA-Fc (10 μg/mL) in the Syn H culture medium. The cell concentration at the start of the culture was 105 cells/mL. Results are the mean percentages (± SD) of the luminescent signal of each group compared to that of the control group in 3 independent experiments. * the mean value was significantly different from that obtained with the control group using a Student t test for pairs (P ≤ .05).
The survival of the 3 autonomously-surviving CD45− HMCLs was strongly inhibited (50 to 95%, P ≤ .05) by the NVP-AEW541 IGF-1R kinase inhibitor (Figure 1C). The ErbB inhibitor partially affected XG-7 survival (40% reduction, P ≤ .05). The inhibitors to IL-6, HGF, or BAFF/APRIL did not affect these 3 HMCLs. The specificity of NVP-AEW541 IGF-1R kinase 35 has been confirmed in our hands, i.e. by the lack of inhibition of the IGF-1R− XG-12 HMCL (see below), the inhibition of the transduction pathways activated by IGF-1 and the lack of inhibition of those induced by IL-6 and HGF (Figure 2A). We also looked for the production of autocrine IGF-1 or IL-6. IL-6 could be detected in the culture supernatants of some cell lines (XG-1, XG-2 and XG-6) in agreement with previous reports 40. IGF-1 protein was detected by western blot in the HMCLs that expressed IGF-1 gene by Affymetrix microarrays (Figure 2B), but IGF-1 concentration in HMCL culture supernatants was below Elisa detection limit (≥ 45 pg/ml).
Figure 2. Specificity of MGF inhibitors and IGF-1 production by HMCLs.
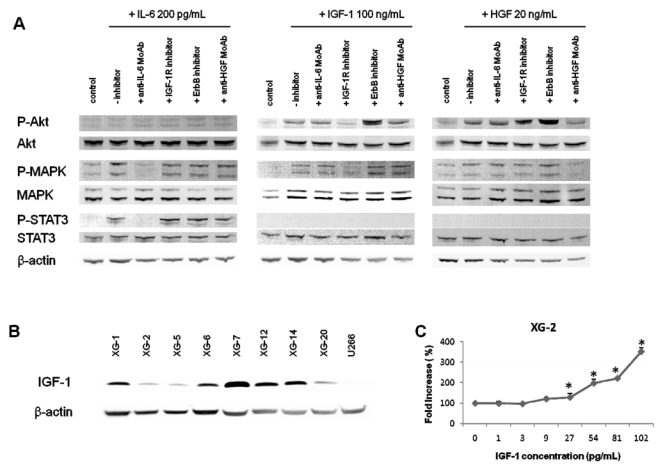
(A) XG-2 cells were starved at 37°C for 18 hours in Syn H serum-free culture medium. Cells were then cultured without cytokine (control) or with either IL-6 (200 pg/mL) or IGF-1 (100 ng/mL) or HGF (20 ng/mL) and without inhibitor or with anti-IL-6 MoAb (10 μg/mL) or IGF-1R inhibitor (1 μM) or anti-HGF MoAb (25 μg/mL) for 20 minutes at 37°C in the Syn H culture medium. The receptor kinase inhibitors were added to the cells for 4 hours at the end of starvation culture and during exposure to rMGF. The anti-MGF antibodies were preincubated with the rMGF for 1 hour before to be added to cells. Cell lysates were immunoblotted with anti-phospho-Akt antibody and then reprobed with anti-akt antibody, anti-phospho-MAPK antibody and then reprobed with anti-MAPK, anti-phospho-Stat3 antibody and then reprobed with anti-Stat3 antibody. Anti-β actin was used as a loading control. (B) HMCLs were cultured for 2 days without cytokine in the Syn H serum-free culture medium. Cell lysates were immunoblotted with an anti-IGF-1 antibody. Anti-β actin was used as a loading control and the U266 HMCL as a negative control for IGF-1 production (no expression of IGF-1 gene using Affymetrix microarrays).
(C) XG-2 cells were starved for 2 hours in Syn H serum-free culture medium and then cultured without cytokine (control) or with increased concentrations of rIGF-1 for 4 days. Results are the mean luminescent signals ± SD determined in sixplicate culture wells and are those of one experiment representative of 3. Data are expressed as percentage of the signal obtained without cytokine. * Mean value was significantly different from that obtained in the control group using a Student t test (P ≤ .05).
IL-6 and IGF-1 are the major MGF and rIL-6-, HGF- and HB-EGF-mediated survival of HMCLs is dependant on the presence of an autocrine IGF-1 loop whereas the activity of recombinant APRIL is not
rIL-6 significantly stimulated (P ≤ .05) the growth of 2/3 CD45− HMCL and of 5/5 CD45+ HMCL and IGF-1 of 3/3 CD45− and 4/5 CD45+ HMCLs (Figure 3). The CD45+ IGF-1R− XG-12 HMCL was not stimulated by rIGF-1. The lowest concentration of rIGF-1 stimulating these HMCLs was 27 pg/mL (Figure 2C) - below ELISA detection limit (≤ 45 pg/mL) - and that of rIL-6 was 2 pg/mL 40. The median rate of stimulation by IL-6 and IGF-1 was 2.2 and 2.8 fold for the CD45− HMCLs (P ≤ .05) and 9.9 and 5.3 fold for the CD45+ HMCLs (P ≤ .05) (Figure 3), respectively. The other 3 MGF stimulated significantly 1 or 2 of the 8 HMCLs (Figure 3). These data indicated that, of the factors investigated, IL-6 and IGF-1 are the most important MGF. APRIL, HB-EGF or HGF stimulated only 1 or 2 of the 8 HMCLs. Regarding transduction pathways, IGF-1 and HGF activated AKT and MAPK phosphorylations, unlike STAT3, IL-6 induced STAT3 and MAPK phosphorylations, unlike AKT and their activity was blocked by their specific inhibitors unlike other MGF inhibitors (Figure 2A). The NF-κB pathway (p65 phosphorylation) could not be switched off by MGF starvation in the investigated HMCLs, suggesting a constitutive activation (results not shown).
Figure 3. Growth activity of 5 factors in 8 HMCLs.
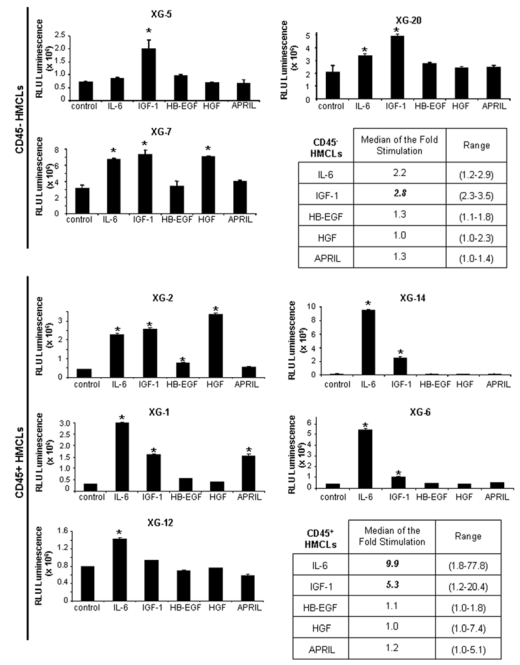
HMCLs were starved for 2 hours and cultured without growth factor (group) or with either IL-6 (200 pg/mL) or IGF-1 (100 ng/mL) or HB-EGF (1 μg/mL) or HGF (200 ng/mL) or APRIL (200 ng/mL) for 4 days in the Syn H culture medium. The cell concentration were 2 × 10⁵ cells/mL for XG-1, XG-2, XG-6, XG-12, XG-14 HMCLs and 105 cells/mL for XG-5, XG-7, XG-20 HMCLs. Results are the mean luminescent signal determined in 6 replicate culture wells and are those from 1 out of 3 representative experiments. * The mean value was significantly different from that obtained in the control group using a Student t test (P ≤ .05).
In order to investigate a possible cooperation of exogenous and autocrinely active MGF, the 8 HMCLs were coincubated with each of the 5 recombinant MGF and each of the inhibitors of the 5 MGF. Detailed results for 5 HMCLs, XG-1, XG-2, XG-5, XG-7, XG-20, are shown in Figure 4A and data for the 8 HMCLs summed up in Figure 4B. The IGF-1-induced stimulation of the 7 IGF-1-sensitive HMCLs was inhibited by IGF-1R inhibitor only (median inhibition 100%, range 88–100%, P ≤ .05). The IL-6-induced stimulation of the 7 IL-6-sensitive HMCLs was inhibited by the B-E8 anti-IL-6 MoAb (median inhibition 100%, range 91–100%, P ≤ .05). IL-6-induced stimulation was also inhibited by IGF-1R inhibitor for 6/7 HMCLs (median inhibition 73%, range 31–99%, P ≤ .05), unlike the XG-12 HMCL that did not express IGF-1R (Figure 4B). It was unaffected by the other 3 inhibitors (pan-ErbB kinase inhibitor, anti-HGF MoAb and BCMA-Fc BAFF/APRIL inhibitor). Two HMCLs are stimulated by HGF – XG-2 and XG-7 – and the HGF effect was blocked by the anti-HGF MoAb and the IGF-1R inhibitor (Figure 4A, P ≤ .05) and unaffected by IL-6, ErbB and BAFF/APRIL inhibitors. The same is true for HB-EGF stimulation in XG-2 cells. It is inhibited by the ErbB kinase inhibitor and by IGF-1R inhibitor also. The XG-1 HMCL was stimulated by APRIL and this effect was blocked by the BCMA-Fc APRIL inhibitor but not influenced by the other 4 inhibitors (Figure 4A, P ≤ .05).
Figure 4. IGF-1R inhibitor inhibited the effect of IL-6, HGF and HB-EGF, unlike that of APRIL.
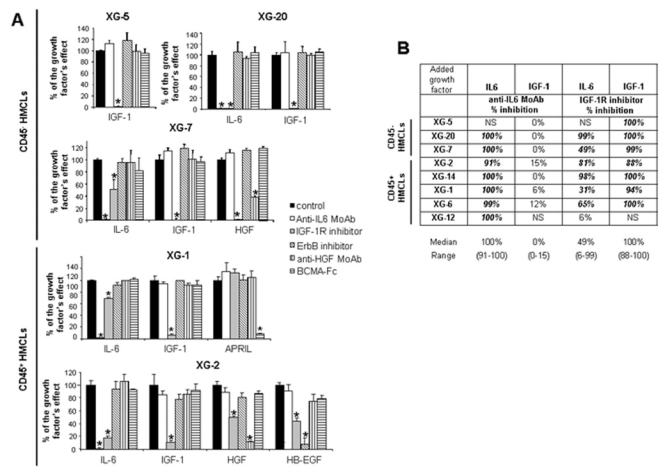
(A) HMCLs were starved for 2 hours and cultured without cytokine or with either IL-6 (200 pg/mL) or IGF-1 (100 ng/mL) or APRIL (200 ng/ml) or HGF (20 ng/mL) or HB-EGF (1 μg/ml) and without inhibitor or with anti-IL-6 MoAb (10 μg/mL) or IGF-1R inhibitor (1 μM) or pan-ErbB kinase inhibitor (1 μM) or anti-HGF MoAb (25 μg/mL) or BCMA-Fc (10 μg/mL) for 4 days in the Syn H culture medium. The cell concentration were 2 × 10⁵ cells/mL for XG-1 and XG-2 HMCLs and 105 cells/mL for XG-5, XG-7 and XG-20 HMCLs. Results are the mean luminescent signals ± SD determined in sixplicate culture wells and are those of one experiment representative of 3. Data are expressed as percentage of the signal obtained with the growth factor. * Mean value was significantly different from that obtained in the control group using a Student t test (P≤.05). XG-5 HMCL was only stimulated by IGF-1 (2.8-fold), XG-20 HMCL by IL-6 (2.9-fold) or IGF-1 (3.5-fold), XG-7 HMCL by IL-6 (2.2-fold), IGF-1 (2.3-fold) or HGF (2.7-fold), XG-1 HMCL by IL-6 (11-fold), IGF-1 (5-fold) or APRIL (5-fold) and XG-2 by IL-6 (11-fold), IGF-1 (17-fold), HGF (17-fold) or HB-EGF (2-fold).
(B) HMCLs were starved for 2 hours and cultured without cytokine or with IL-6 (200 pg/mL), or IGF-1 (100 ng/mL) and without inhibitor or with an anti-IL-6 MoAb (10 μg/mL) or an IGF-1R inhibitor (1 μM) for 4 days in the Syn H culture medium. Data are expressed as the mean percentage of the inhibition of the cytokine stimulation by the inhibitor in 3 independent experiments. When the percentages were different with a Student t test for pairs (P ≤ .05), data are shown in bold and italic. NS: not stimulated.
Expression of MGF-receptors
The expression of 6 genes coding for receptor complexes of 4 of the 5 MGF – IGF-1R, IL-6R, gp130, c-Met, TACI, BCMA – could be evaluated with Affymetrix U133 2.0 Plus microarrays. IL-6R, gp130 and BCMA expressions are up-regulated throughout B cell to plasma cell differentiation (P ≤ .05), unlike TACI. IGF-1R is not expressed in MBC, PPC, BMPC, but expressed in MMC in a fraction of the 123 patients (Figure 5).
Figure 5. Gene expression profile of MGF receptors.
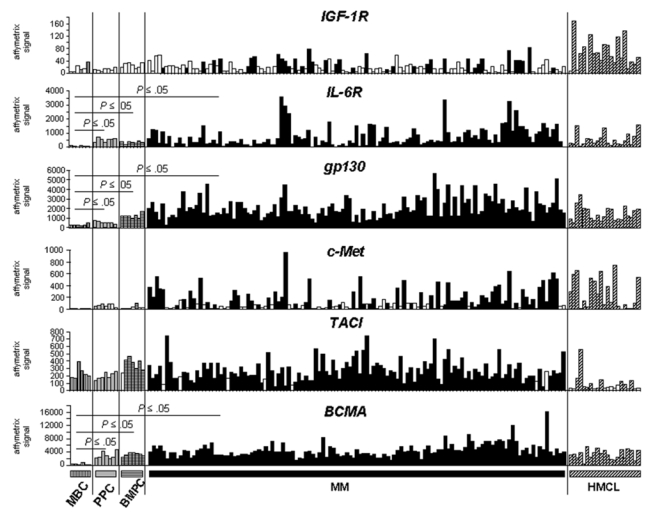
Expression of IGF-1R, IL-6R, gp130, c-met, TACI, and BCMA genes were determined with Affymetrix human U133 Plus 2.0 in six memory B cell (MBC), seven normal plasmablast samples (PPC), seven normal bone marrow plasma cell samples (BMPC), MMC of 123 patients with previously-untreated MM and 20 HMCLs. A white histogram indicates that the gene had an absent Affymetrix call in the sample.
Prognostic value of MGF-receptor expression
Among the 6 receptors, only IGF-1R (probe set 203627_at) and IL-6R (probe set 205945_at) expression had prognostic value in the 2 independent series of newly-diagnosed patients, the HM series of 171 patients and LR-TT2 series of 345 patients. The IGF-1R probe set had a present call in the MMC of 31% and 50% of patients in the HM and LR-TT2 series, respectively. Gp130, BCMA and TACI were present in all MMC samples and c-Met in MMC of 56% and 39% of patients of the 2 series, respectively. Patients with IGF-1Rabsent MMC had a longer median event-free survival than patients with IGF-1Rpresent MMC (P = .006 and .005, Figures 6A and 6B). The same holds true for patients with IL-6Rlow MMC and IL-6Rhigh MMC (P = .006 and .004, Figures 6E and 6F). The median EFS of the whole cohort in the 2 series were 1077 and 1604 days respectively. Patients with IGF-1Rabsent MMC had a longer OAS than patients with IGF-1Rpresent in the 2 patient series (P = .02 and 3.10−4, Figures 6C and 6D). Patients with IL-6Rlow MMC had also a longer OAS than patients with IL-6Rhigh MMC (P = .005 and .008, Figures 6G and 6H).
Figure 6. Event-free survival and overall survival of patients with previously-untreated MM with IGF-1Rabsent or IGF-1Rpresent MMC and with IL-6Rlow and IL-6Rhigh MMC.
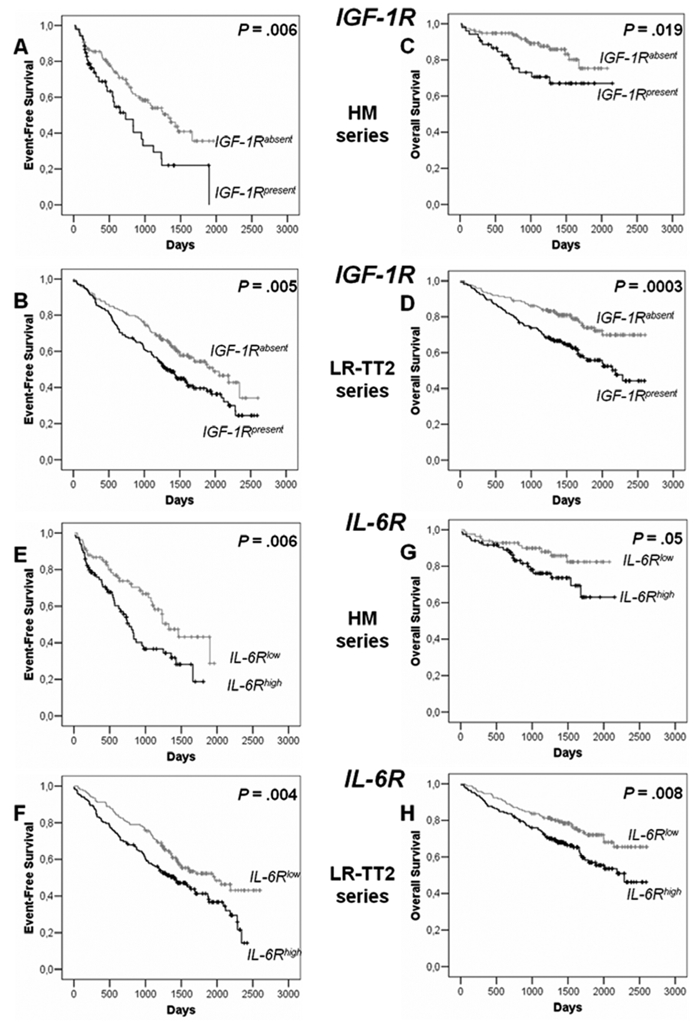
IGF-1R and IL-6R expressions were assayed in purified MMC with Affymetrix U133 microarrays. Patients from Heidelberg or Montpellier hospitals (HM series) were treated with high dose chemotherapy and autologous stem cell transplantation. 118 patients had IGF-1Rabsent MMC and 53 IGF-1Rpresent MMC and 85 patients had IL-6Rlow MMC and 85 IL-6Rhigh MMC. We used also patients’ data from the Arkansas-Little Rock group (GEO accession number GSE2658). These patients from the Arkansas group were treated with total therapy 2 and termed for convenience LR-TT2 series. 114 patients had IGF-1Rabsent MMC and 136 IGF-1Rpresent MMC and 172 patients had IL-6Rlow MMC and 172 IL-6Rhigh MMC.
Event-free survival of IGF-1Rabsent MMC and IGF-1Rpresent MMC patients from HM series (A) and from LR-TT2 series (B). Overall survival of IGF-1Rabsent MMC and IGF-1Rpresent MMC patients from HM series (C) and from LR-TT2 series (D). The P-value was determined with a log-rank test.
Event-free survival of IL-6Rlow MMC and IL-6Rhigh MMC patients from HM series (E) and from LR-TT2 series (F). Overall survival IL-6Rlow MMC and IL-6Rhigh MMC patients from HM series (G) and from LR-TT2 series (H). The P-value was determined with a log-rank test.
We found a link between clinical data and presence or absence of IGF-1R in MMC: IgA subtype and serum level of lactate dehydrogenase and between IL-6Rhigh and IL-6Rlow MMC (IgA subtype) (P ≤ .05, Table 1). Of note, the frequency of patients with high LDH levels (an adverse prognostic factor) is increased in patients with IGF-1Rabsent MMC (with a better prognosis). Others clinical data - age, light or heavy chain isotype, occurrence of bone lesions, serum levels of β2-microglobulin, albumin, hemoglobin, C-reactive protein or ISS stage - were not significantly different between IGF-1Rpresent and IGF-1Rabsent or IL-6Rhigh and IL-6Rlow groups (Table 1). Genetic abnormalities were assayed in 79 to 129 (depending on the abnormality) patients of the 171 HM patients series (Table 2). Patient groups with MMC showing a presence of t(4;14), 1q21 or del13 had an significantly increased frequency of IGF-1Rpresent MMC or IL-6Rhigh MMC, respectively, with del17 an increased frequency of patients with IGF-1Rpresent MMC, with t(11;14) a decreased frequency of patients with IL-6Rhigh MMC (P ≤ .05) (Table 2). Thus a possible explanation for the adverse prognosis of IGF-1Rpresent MMC or IL-6Rhigh MMC groups is the high fraction of patients with the poor prognosis t(4;14) translocation in these groups. As documented t(4;14) was not available for all our HM patients and for LR-TT2 patients, we used spiked MMSET expression to further analysis a link between spiked MMSET and IGF-1Rpresent MMC or IL-6Rhigh MMC. 15% (26/171) and 14% (49/345) of patients had spiked MMSET in HM and LR-TT2 series respectively. Among the patients with spiked MMSET, 77% and 73% had also spiked FGFR3 expression in agreement with reported data 1,3,37. In the HM and LR-TT2 series, patients with spiked MMSET have an increased frequency of patients with IGF-1Rpresent MMC compared to patients with unspiked MMSET (77% vs. 23%, P = 2.10−14 for HM series and 94% vs. 43%, P = 8.10−15 for LR-TT2 series) or with IL-6Rhigh MMC (77% vs. 45% P = 6.10−4 for HM series and 82% vs. 45% P = 5.10−8 for LR-TT2 series). Considering the 8 patients subgroups defined by Zhan et al. using GEP 3, the frequency of patients with IGF-1Rpresent MMC is increased in PR and MS groups and decreased in HY and CD1 groups (P ≤ .05). The frequency of patients with IL-6Rhigh MMC is increased in PR, LB, MS, and MF groups and decreased in CD1 and CD2 groups (P ≤ .05) (Table 3). Of note, patients with IGF-1Rpresent MMC and lacking spiked MMSET had decreased OAS compared to patients with IGF-1Rabsent MMC in the HM and LR-TT2 series, but increased EFS (in the 2 series) and OAS (in the LR-TT2 series) compared to patients with spiked MMSET and IGF-1Rpresent MMC (Figure 7A–D). Due to the low number of patients with spiked MMSET and IGF-1Rabsent MMC (respectively 6 and 3 in the 2 series) and of patients with spiked MMSET and IL-6Rlow (respectively 6 and 9 in the two series), their survival could not be evaluated. High IL-6R expression without spiked MMSET had prognostic value for OAS compared to patients with IL-6Rlow MMC in the LR-TT2 series only. Patients with spiked MMSET and IL-6Rhigh MMC had decreased EFS and OAS compared to patients with IL-6Rhigh MMC and without spiked MMSET in the 2 series (Figure 7E–H). Using univariate Cox analysis, IGF-1Rabsent MMC or spiked MMSET and IGF-1Rpresence MMC had prognostic value for EFS and OAS in the 2 patient series. MMC with IGF-1Rpresence and lacking spiked MMSET had no prognostic value. Using multivariate Cox analysis, none of the 3 parameters had prognostic value for either EFS or OAS in the 2 series (results not shown).
Table 1. Clinical data of patients with IGF-1Rabsent and IGF-1Rpresent MMC and of patients with IL-6Rlow and IL-6Rhigh MMC.
The 171 previously-untreated patients with MM were treated at the university hospitals of Heidelberg of Montpellier. Patients were separated in two groups: patients with IGF-1Rabsent MMC and patients with IGF-1Rpresent MMC or patients with IL-6Rlow MMC and IL-6Rhigh MMC, as assayed with Affymetrix microarrays. Data are the percentages of patients within these 2 groups with the indicated clinical or biological parameters. When the percentages were different with a Chisquare test (P ≤ .05), data are shown in bold and italic. NS: not significant.
| IGF-1R | IL-6R | ||||
|---|---|---|---|---|---|
| Categories | IGF-1Rabsent (n = 118) | IGF-1Rpresent (n = 53) | IL-6Rlow (n = 85) | IL-6Rhigh (n = 85) | |
| % of patients in each group | % of patients in each group | ||||
| Age ≥ 65 yr | 26% | 21% | 26% | 24% | |
| Kappa light chain | 64% | 64% | 63% | 65% | |
| Lambda light chain | 33% | 34% | 36% | 32% | |
| Non-secreting | 3% | 2% | 1% | 3% | |
| B2M ≤ 3.5 mg/ml | 60% | 58% | 63% | 56% | |
| B2M > 5.5 mg/ml | 17% | 17% | 19% | 15% | |
| IgA subtype | 20% | 33% | 15% | 33% | |
| LDH ≥ 240 IU/liter | 26% | 12% | 24% | 19% | |
| Albumin < 35 g/l | 37% | 36% | 44% | 31% | |
| Hemoglobin < 10 g/dl | 31% | 32% | 29% | 34% | |
| C-reactive protein ≥ 5 mg/l | 40% | 40% | 43% | 38% | |
| Bone lesions | |||||
| 0: normal bone structure | 18% | 27% | 21% | 22% | |
| 1: osteopenie/osteoporosis | 28% | 25% | 22% | 33% | |
| 2: osteolyse [1–3] | 8% | 10% | 9% | 9% | |
| 3: major structural damage [>3] | 46% | 38% | 48% | 36% | |
| IGF-1Rabsent (n = 118) | IGF-1Rpresent (n = 53) | |||||
|---|---|---|---|---|---|---|
| Staging | I | II | III | I | II | III |
| ISS | 44% | 36% | 20% | 42% | 42% | 16% |
| IL-6Rlow (n = 85) | IL-6Rhigh (n = 85) | |||||
| Staging | I | II | III | I | II | III |
| ISS | 44% | 35% | 21% | 42% | 41% | 17% |
Table 2. Genetic abnormalities of patients with IGF-1Rabsent and IGF-1Rpresent MMC and of patients with IL-6Rlow and IL-6Rhigh MMC.
Interphase-FISH-analysis was performed on CD138-purified plasma cells for 79 to 129 patients of the HM series. Patients were separated in two groups: patients with IGF-1Rabsent MMC and patients with IGF-1Rpresent MMC or patients with IL-6Rlow MMC and IL-6Rhigh MMC, as assayed with Affymetrix microarrays. Data are the percentages of patients within these 2 groups with the biological parameters. When the percentages were different with a Chisquare test (P ≤ .05), data are shown in bold and italic. NS: not significant.
| t(4;14)+ (n = 20) | t(4;14)− (n = 74) | t(4;14)+ (n = 20) | t(4;14)− (n = 74) | ||
| IGF-1Rpresent | 70% | 26% | IL-6Rhigh | 85% | 53% |
| IGF-1Rabsent | 30% | 74% | IL-6Rlow | 15% | 47% |
| del13+ (n = 71) | del13− (n = 59) | del13+ (n = 71) | del13− (n = 59) | ||
| IGF-1Rpresent | 45% | 19% | IL-6Rhigh | 66% | 40% |
| IGF-1Rabsent | 55% | 81% | IL-6Rlow | 34% | 60% |
| del17+ (n = 24) | del17− (n = 97) | del17+ (n = 24) | del17− (n = 97) | ||
| IGF-1Rpresent | 58% | 27% | IL-6Rhigh | 46% | 58% |
| IGF-1Rabsent | 42% | 73% | IL-6Rlow | 54% | 42% |
| 1q21+ (n = 48) | 1q21− (n = 66) | 1q21+ (n = 48) | 1q21− (n = 66) | ||
| IGF-1Rpresent | 42% | 27% | IL-6Rhigh | 67% | 47% |
| IGF-1Rabsent | 58% | 73% | IL-6Rlow | 33% | 53% |
| t(11;14)+ (n = 15) | t(11;14)− (n = 104) | t(11;14)+ (n = 15) | t(11;14)− (n = 104) | ||
| IGF-1Rpresent | 33% | 33% | IL-6Rhigh | 40% | 57% |
| IGF-1Rabsent | 67% | 67% | IL-6Rlow | 60% | 43% |
Table 3. IGF-1R and IL-6R expressions in MMC according to the molecular classification of multiple myeloma.
The percentage of patients with IGF-1Rpresent and IL-6Rhigh MMC was determined in the 8 patient subgroups defined by Zhan et al3. PR: proliferation. LB: low bone disease. MS: MMSET. HY: hyperdiploid. CD-1 and CD-2: CCND1/CCND3. MF: MAF/MAFB and MY: myeloid group. When the percentages of patients IGF-1Rpresent or IL-6Rhigh MMC in a subgroup were significantly different from that in all patients with a Chisquare test (P ≤ .05). data are shown in bold and italic.
| all patients | PR | LB | MS | HY | CD1 | CD2 | MF | MY | |
|---|---|---|---|---|---|---|---|---|---|
| Patient subgroups | 100% | 8.4% | 9.0% | 12.2% | 18.8% | 6.4% | 11.9% | 6% | 27.5% |
| Frequency of patients with IGF-1Rpresent | 49.9% | 75.9% | 61.3% | 92.9% | 33.8% | 22.7% | 43.9% | 55% | 37.9% |
| Frequency of patients with IL-6Rhigh | 50% | 82.8% | 93.5% | 78.6% | 38.5% | 9.1% | 17.1% | 75.0% | 39.4% |
Figure 7. Event-free survival and overall survival of patients with previously-untreated MM with IGF-1Rabsent or IGF-1Rpresent with or without spiked MMSET MMC and with IL-6Rlow and IL-6Rhigh with or without spiked MMSET MMC.
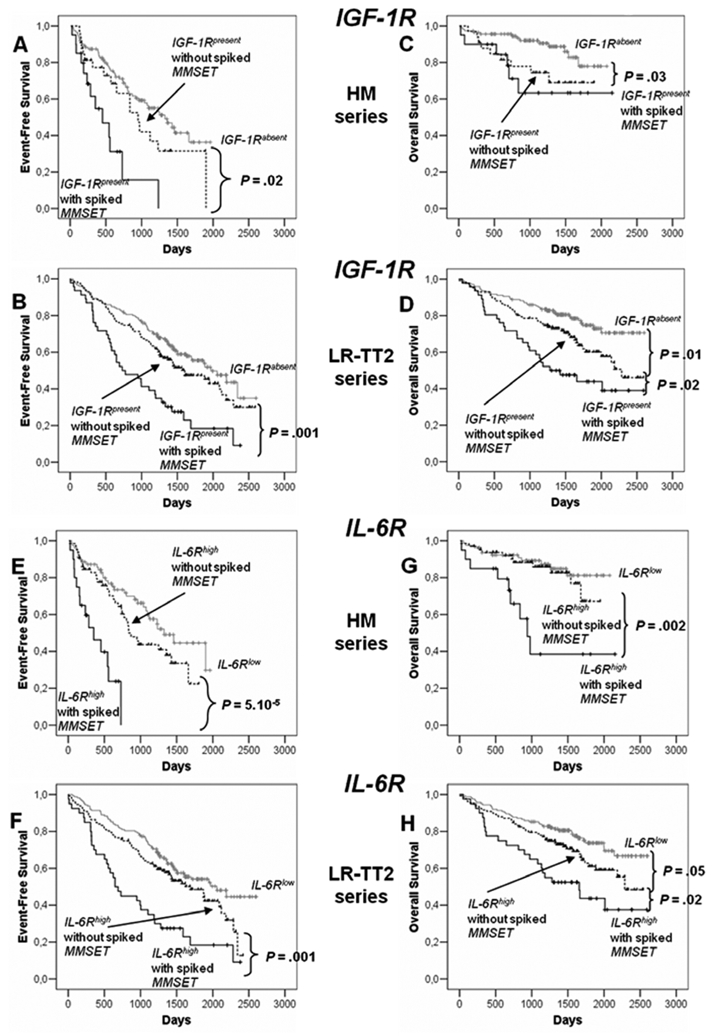
Spiked MMSET was determined with Affymetrix U133 microarrays in the patients from HM series and LR-TT2 series (see Materials and Methods). In HM series, 112 patients had IGF-1Rabsent MMC, 33 IGF-1Rpresent without spiked MMSET MMC and 20 IGF-1Rpresent with spiked MMSET MMC. 79 patients had IL-6Rlow MMC, 65 IL-6Rhigh without spiked MMSET MMC and 20 IL-6Rhigh with spiked MMSET MMC. In LR-TT2 series, 170 patients had IGF-1Rabsent MMC, 126 IGF-1Rpresent without spiked MMSET MMC and 46 IGF-1Rpresent with spiked MMSET MMC. 163 patients had IL-6Rlow MMC, 132 IL-6Rhigh without spiked MMSET MMC and 40 IL-6Rhigh with spiked MMSET MMC.
Event-free survival of IGF-1Rabsent MMC and IGF-1Rpresent with or without spiked MMSET MMC patients from HM series (A) and from LR-TT2 series (B). Overall survival of IGF-1Rabsent MMC and IGF-1Rpresent with or without spiked MMSET MMC patients from HM series (C) and from LR-TT2 series (D). The P-value was determined with a log-rank test.
Event-free survival of IL-6Rlow MMC and IL-6Rhigh with or without spiked MMSET MMC patients from HM series (E) and from LR-TT2 series (F). Overall survival IL-6Rlow MMC and IL-6Rhigh MMC with or without spiked MMSET patients from HM series (G) and from LR-TT2 series (H). The P-value was determined with a log-rank test.
Discussion
We selected 5 documented MGF for which recombinant MGF and inhibitors are commercially available to define a hierarchy of their biological action on HMCLs. We have found that IGF-1 is the major MGF in agreement with several studies9,41, IL-6 an important one, and that HGF, EGF family and BAFF/APRIL act on a subset of HMCLs only. In serum-free cultures, only the 3 CD45− HMCLs could survive within 4–6 days of culture through an autocrine IGF-1/IGF-1R loop. These cells coexpressed IGF-1R and IGF-1 genes and IGF-1R and IGF-1 proteins and the NVP-AEW541 IGF-1R inhibitor, unlike other MGF inhibitors, abrogated their survival. Regarding CD45+ HMCLs, although an autocrine IGF-1/IGF-1R loop was present in 4/5 HMCLs, it was not sufficient to promote survival. But this autocrine IGF-1/IGF-1R loop was necessary for the growth activity of IL-6, HB-EGF or HGF when MMC expressed IGF-1R. Adding a high concentration of IL-6 (up to 30 ng/mL) could not rescue from apoptosis due to IGF-1 pathway inhibition (data not shown). The specificity of NVP-AEW541 for IGF-1R targeting was previously reported 35 and is emphasized here by its lack of effect on the IGF-1R− XG-12 HMCL and its lack of inhibition of IL-6 or HGF-induced transduction signals. IL-6 increases proliferation of 7/8 HMCLs tested, but interestingly its effect is dependent on the presence of an autocrine IGF-1/IGF-1R loop when MMC expressed IGF-1R. IGF-1 is detected by western blot in myeloma cells but could not be detected in HMCL culture supernatant. This does not preclude a bioactive role of autocrine IGF-1 since the bioactive concentration of rIGF-1 on HMCLs (27 pg/mL) is below the detection limit of commercially available IGF-1 ELISA (≥ 45 pg/mL). In addition, the survival of the CD45− HMCLs and the IL-6-induced stimulation of CD45+ HMCLs in serum-free medium are also blocked by recombinant IGF-binding protein 3 (IGFBP-3), another IGF-1 inhibitor (results not shown). To study the cooperation between IL-6 and IGF-1, different techniques have been used focussing on different aspects that may yield to challenging conclusions 10,25,26. Our current data did not confirm a previous study showing that the IL-6-induced growth of CD45+ HMCLs was not inhibited by an IGF-1R inhibitor 26. An explanation may be the use of foetal calf serum containing medium, which comprises IGF-1 but also insulin that stimulates MMC growth 42. We used here a serum-free culture medium, devoid of insulin, making it possible to unravel this major role of autocrine IGF-1. This matter is of great importance in view of anti-IGF-1 therapy. Indeed, the report by Descamps et al. suggest that an anti-IGF-1R MoAb therapy will be unable to target CD45+ MMC, that include the proliferating MMC 26. On the contrary, our data suggest that an IGF-1R inhibitor therapy could be useful in patients with IGF-1Rpresent MMC, independently of CD45 expression. Only 2/8 HMCLs were stimulated by HGF although c-Met is expressed by 7/8 HMCLs. Another HMCL is stimulated by HB-EGF, whereas 8/8 HMCLs expressed at least one of the 4 ErbB receptors 43. These effects were abrogated by the specific inhibitor of HGF or HB-EGF and also by the IGF-1R inhibitor, but not the anti-IL-6 MoAb, BCMA-FC and pan-ErbB kinase inhibitor (for HGF effect) or anti-HGF MoAb (for HB-EGF effect). Thus targeting IGF-1R could also help to block their activity. Only APRIL-activity is not affected by IGF-1R inhibition. Out of the 3 BAFF/APRIL receptors - BAFF-R, TACI, BCMA - MMC expressed always BCMA, TACI in one third of HMCLs, and rarely BAFF-R 44.
These in vitro data fit well with the prognostic value of receptor expression of these 5 MGF on MMC since only IGF-1R and IL-6R expression have prognostic value using 2 independent patient series. IGF-1R gene is not expressed by normal B and plasma cells, including plasmablastic cells. Thus IGF-1R is aberrantly expressed by 31%–50% of MMC of previously-untreated patients. Of note, 90% of HMCLs expressed IGF-1R. HMCLs are mainly obtained from patients with extramedullary proliferation 31,45 and this increased frequency of IGF-1Rpresence in HMCLs compared to that in primary MMC may reflect an increase frequency of IGF-1Rpresent MMC in patients with extramedullary proliferation. Alternatively, it might be due to the way of obtaining HMCLs using culture medium and serum that contain large amount of circulating IGF-1, thus favoring the growth of IGF-1Rpresent MMC.
Presently, no conclusive data have been published regarding the prognostic value of IGF-1R on MMC 29,30. We have shown here that IGF-1R expression is prognostically significant in two independent large sets of patients obtained in two centers, using different methods for the Affymetrix probe preparation (single or double in vitro transcription amplification) and two different Affymetrix platforms 3,46. The poor prognosis of patients with IGF-1Rpresent MMC is not only explained by a strong association of IGF-1Rpresent MMC and poor prognosis t(4;14) translocation and spiked MMSET expression 1. Indeed, patients with IGF-1Rpresent MMC and unspiked MMSET had also a significantly shorter survival than patients with IGF-1Rabsent MMC. This might be explained by the increased proportion of patients with IGF-1Rpresent MMC in the poor prognosis proliferation group (75.9% versus 49.9%) 3 and in patients with del17, another poor prognosis abnormality 1 that occurs independently of t(4;14). Noteworthy, we show here that IGF-1 is a major factor driving the proliferation of MMC, which could account for the proliferation signature. Patients with both IGF-1Rpresent MMC and t(4;14) had the shortest survival. A possible explanation is that patients with t(4;14) need to acquire additional aberrations (e.g. aberrant expression of IGF-1R) for the outbreak of overt MM.
MMC are “bathed” in high levels of IGF-1 in the tumor milieu in vivo. First, IGF-1 is directly produced in the bone marrow, by MMC and by osteoclasts. In addition, high levels of IGF-1 - bound to IGFBP-3 and ALS protein - circulate in patients with MM and healthy individuals 47 and serum levels of IGF-1 correlated with poor prognosis in patients with MM 28. These circulating IGF-1-IGFBP-3-ALS complexes can be captured by MMC that expressed highly syndecan-1, that bind IGFBP-3 47. IGFBP-3 binding to heparan sulfate chains weakens its affinity with IGF-1, which is thus able to bind membrane IGF-1R and exert its biological activity. In addition, MMC produce soluble syndecan-1, in particular though an heparanase controlled process 46,48,49, providing an extracellular matrix able to bind circulating IGF-1-IGFBP complexes and to release IGF-1 close to MMC.
IL-6R is variably expressed in MMC of all patients with MM. Dividing MM patients within two groups using IL-6R median expression, we found that patients with IL-6Rhigh MMC had a shorter survival. This might be explained by the increased proportion of patients of poor prognosis groups (proliferation, MAF and MMSET groups) 3 in IL-6Rhigh group. Patients with both IL-6Rhigh MMC and t(4;14) had a worst survival.
A message of this study is not that IGF-1R expression can be useful to define new prognostic classification, as the adverse prognosis value of IGF-1R expression is explained mainly by their expression in already identified poor prognosis groups, i.e. t(4;14), del17 and proliferation groups. But a message is that the adverse prognosis value of IGF-1R expression in MMC together with its major MGF activity emphasize that targeting IGF-1 could be promising for the treatment of patients with MM. A phase I study of anti-IGF-1R antibody therapy in patients with refractory MM was recently reported 50. This trial showed no toxicity and disease stabilization in about half of the patients. Since IGF-1R is present on MMC of 30% to 50% of the newly-diagnosed patients, IGF-1R expression on MMC should be evaluated in patients treated with anti-IGF-1 therapy. Anti-IL-6 MoAb treatment was also shown to block MMC proliferation with temporary disease stabilization 51. Thus, anti-IL-6 therapy could be a useful combination with an IGF-1 inhibitor.
In conclusion, this study makes it possible to define a hierarchy of the biological action of 5 well-documented MGF on HMCLs, IGF-1 being the major one, IL-6 an important one, and HGF, EGF family and BAFF/APRIL acting only on a subset of HMCLs. Of interest, this hierarchy of biological activity of these 5 MGF using HMCLs fully paralleled with the prognostic value of the expression of the genes of the receptors of these MGF in MMC since IGF-1R and IL-6R expressions in MMC had prognostic value. Thus, gene expression profiles of MMC and of the tumor environment is highly recommended for a better understanding and anticipation of the efficacy of growth factor targeted therapy in patients with MM.
Acknowledgments
This work was supported by grants from the Ligue Nationale Contre le Cancer (équipe labellisée), Paris, France, from INCA (n°R07001FN) and from MSCNET European strep (N°E06005FF), the Hopp-Foundation, Germany, the University of Heidelberg, Germany, the National Centre for Tumor Diseases, Heidelberg, Germany, the Tumorzentrum Heidelberg/Mannheim, Germany, AC Sprynski is supported by a grant from Guillaume Espoir (St Genis-Laval, France).
Footnotes
Author contributions: ACS designed research, performed the experiments and wrote the paper.
DH, AS, JM, MH, TM, MJ, TM, AJ, KM, UB, JFR and HG collected bone marrow samples and clinical data.
LC provided some new reagents.
TR and AK participated in the analyzing of the data.
JS and BB provided GEP and patient’s data and participated in the writing of the paper.
DH and HG participated in the writing of the paper.
BK is the senior investigator who designed research and wrote the paper.
References
- 1.Avet-Loiseau H, Attal M, Moreau P, et al. Genetic abnormalities and survival in multiple myeloma: the experience of the Intergroupe Francophone du Myelome. Blood. 2007;109:3489–3495. doi: 10.1182/blood-2006-08-040410. [DOI] [PubMed] [Google Scholar]
- 2.Cremer FW, Bila J, Buck I, et al. Delineation of distinct subgroups of multiple myeloma and a model for clonal evolution based on interphase cytogenetics. Genes Chromosomes Cancer. 2005;44:194–203. doi: 10.1002/gcc.20231. [DOI] [PubMed] [Google Scholar]
- 3.Zhan F, Huang Y, Colla S, et al. The molecular classification of multiple myeloma. Blood. 2006;108:2020–2028. doi: 10.1182/blood-2005-11-013458. [DOI] [PMC free article] [PubMed] [Google Scholar]
- 4.Yaccoby S, Pearse RN, Johnson CL, Barlogie B, Choi Y, Epstein J. Myeloma interacts with the bone marrow microenvironment to induce osteoclastogenesis and is dependent on osteoclast activity. Br J Haematol. 2002;116:278–290. doi: 10.1046/j.1365-2141.2002.03257.x. [DOI] [PubMed] [Google Scholar]
- 5.Mitsiades CS, Mitsiades N, Munshi NC, Anderson KC. Focus on multiple myeloma. Cancer Cell. 2004;6:439–444. doi: 10.1016/j.ccr.2004.10.020. [DOI] [PubMed] [Google Scholar]
- 6.Zhang XG, Bataille R, Widjenes J, Klein B. Interleukin-6 dependence of advanced malignant plasma cell dyscrasias. Cancer. 1992;69:1373–1376. doi: 10.1002/1097-0142(19920315)69:6<1373::aid-cncr2820690612>3.0.co;2-1. [DOI] [PubMed] [Google Scholar]
- 7.Gaillard JP, Liautard J, Klein B, Brochier J. Major role of the soluble interleukin-6/interleukin-6 receptor complex for the proliferation of interleukin-6-dependent human myeloma cell lines. EurJImmunol. 1997;27:3332–3340. doi: 10.1002/eji.1830271232. [DOI] [PubMed] [Google Scholar]
- 8.Zhang XG, Gu ZJ, Lu ZY, et al. Ciliary neurotropic factor, interleukin 11, leukemia inbitory factor, and oncostatin M are growth factors for human myeloma cell lines using the interleukin 6 signal transducer gp130. JExpMed. 1994;179:1337–1342. doi: 10.1084/jem.179.4.1337. [DOI] [PMC free article] [PubMed] [Google Scholar]
- 9.Ferlin M, Noraz N, Hertogh C, Brochier J, Taylor N, Klein B. Insulin-like growth factor induces the survival and proliferation of myeloma cells through an interleukin-6-independent transduction pathway. Br J Haematol. 2000;111:626–634. doi: 10.1046/j.1365-2141.2000.02364.x. [DOI] [PubMed] [Google Scholar]
- 10.Mitsiades CS, Mitsiades NS, McMullan CJ, et al. Inhibition of the insulin-like growth factor receptor-1 tyrosine kinase activity as a therapeutic strategy for multiple myeloma, other hematologic malignancies, and solid tumors. Cancer Cell. 2004;5:221–230. doi: 10.1016/s1535-6108(04)00050-9. [DOI] [PubMed] [Google Scholar]
- 11.Novak AJ, Darce JR, Arendt BK, et al. Expression of BCMA, TACI, and BAFF-R in multiple myeloma: a mechanism for growth and survival. Blood. 2004;103:689–694. doi: 10.1182/blood-2003-06-2043. [DOI] [PubMed] [Google Scholar]
- 12.Moreaux J, Legouffe E, Jourdan E, et al. BAFF and APRIL protect myeloma cells from apoptosis induced by interleukin 6 deprivation and dexamethasone. Blood. 2004;103:3148–3157. doi: 10.1182/blood-2003-06-1984. [DOI] [PMC free article] [PubMed] [Google Scholar]
- 13.Mahtouk K, Jourdan M, De Vos J, et al. An inhibitor of the EGF receptor family blocks myeloma cell growth factor activity of HB-EGF and potentiates dexamethasone or anti-IL-6 antibody-induced apoptosis. Blood. 2004;103:1829–1837. doi: 10.1182/blood-2003-05-1510. [DOI] [PMC free article] [PubMed] [Google Scholar]
- 14.Borset M, Hjorth-Hansen H, Seidel C, Sundan A, Waage A. Hepatocyte growth factor and its receptor c-met in multiple myeloma. Blood. 1996;88:3998–4004. [PubMed] [Google Scholar]
- 15.Jourdan M, Tarte K, Legouffe E, Brochier J, Rossi JF, Klein B. Tumor necrosis factor is a survival and proliferation factor for human myeloma cells. EurCytokineNetw. 1999;10:65–70. [PMC free article] [PubMed] [Google Scholar]
- 16.Derksen PW, Tjin E, Meijer HP, et al. Illegitimate WNT signaling promotes proliferation of multiple myeloma cells. Proc Natl Acad Sci U S A. 2004;101:6122–6127. doi: 10.1073/pnas.0305855101. [DOI] [PMC free article] [PubMed] [Google Scholar]
- 17.Gu ZJ, Costes V, Lu ZY, et al. Interleukin-10 is a growth factor for human myeloma cells by induction of an oncostatin M autocrine loop. Blood. 1996;88:3972–3986. [PubMed] [Google Scholar]
- 18.Brenne AT, Baade Ro T, Waage A, Sundan A, Borset M, Hjorth-Hansen H. Interleukin-21 is a growth and survival factor for human myeloma cells. Blood. 2002;99:3756–3762. doi: 10.1182/blood.v99.10.3756. [DOI] [PubMed] [Google Scholar]
- 19.Houde C, Li Y, Song L, et al. Overexpression of the NOTCH ligand JAG2 in malignant plasma cells from multiple myeloma patients and cell lines. Blood. 2004;104:3697–3704. doi: 10.1182/blood-2003-12-4114. [DOI] [PubMed] [Google Scholar]
- 20.Mitsiades CS, Mitsiades NS, Munshi NC, Richardson PG, Anderson KC. The role of the bone microenvironment in the pathophysiology and therapeutic management of multiple myeloma: interplay of growth factors, their receptors and stromal interactions. Eur J Cancer. 2006;42:1564–1573. doi: 10.1016/j.ejca.2005.12.025. [DOI] [PubMed] [Google Scholar]
- 21.Mahtouk K, Hose D, De Vos J, et al. Input of DNA microarrays to identify novel mechanisms in multiple myeloma biology and therapeutic applications. Clin Cancer Res. 2007;13:7289–7295. doi: 10.1158/1078-0432.CCR-07-1758. [DOI] [PMC free article] [PubMed] [Google Scholar]
- 22.Hideshima T, Mitsiades C, Tonon G, Richardson PG, Anderson KC. Understanding multiple myeloma pathogenesis in the bone marrow to identify new therapeutic targets. Nat Rev Cancer. 2007;7:585–598. doi: 10.1038/nrc2189. [DOI] [PubMed] [Google Scholar]
- 23.Wang YD, De Vos J, Jourdan M, et al. Cooperation between heparin-binding EGF-like growth factor and interleukin-6 in promoting the growth of human myeloma cells. Oncogene. 2002;21:2584–2592. doi: 10.1038/sj.onc.1205355. [DOI] [PubMed] [Google Scholar]
- 24.Bisping G, Leo R, Wenning D, et al. Paracrine interactions of basic fibroblast growth factor and interleukin-6 in multiple myeloma. Blood. 2003;101:2775–2783. doi: 10.1182/blood-2002-09-2907. [DOI] [PubMed] [Google Scholar]
- 25.Abroun S, Ishikawa H, Tsuyama N, et al. Receptor synergy of interleukin-6 (IL-6) and insulin-like growth factor-I in myeloma cells that highly express IL-6 receptor alpha [corrected] Blood. 2004;103:2291–2298. doi: 10.1182/blood-2003-07-2187. [DOI] [PubMed] [Google Scholar]
- 26.Descamps G, Wuilleme-Toumi S, Trichet V, et al. CD45neg but not CD45pos human myeloma cells are sensitive to the inhibition of IGF-1 signaling by a murine anti-IGF-1R monoclonal antibody, mAVE1642. J Immunol. 2006;177:4218–4223. doi: 10.4049/jimmunol.177.6.4218. [DOI] [PubMed] [Google Scholar]
- 27.Van Zaanen HC, Lokhorst HM, Aarden LA, Rensink HJ, Warnaar SO, Van Oers MH. Blocking interleukin-6 activity with chimeric anti-IL6 monoclonal antibodies in multiple myeloma: effects on soluble IL6 receptor and soluble gp130. Leuk Lymphoma. 1998;31:551–558. doi: 10.3109/10428199809057614. [DOI] [PubMed] [Google Scholar]
- 28.Standal T, Borset M, Lenhoff S, et al. Serum insulinlike growth factor is not elevated in patients with multiple myeloma but is still a prognostic factor. Blood. 2002;100:3925–3929. doi: 10.1182/blood-2002-05-1406. [DOI] [PubMed] [Google Scholar]
- 29.Bataille R, Robillard N, Avet-Loiseau H, Harousseau JL, Moreau P. CD221 (IGF-1R) is aberrantly expressed in multiple myeloma, in relation to disease severity. Haematologica. 2005;90:706–707. [PubMed] [Google Scholar]
- 30.Chng WJ, Gualberto A, Fonseca R. IGF-1R is overexpressed in poor-prognostic subtypes of multiple myeloma. Leukemia. 2006;20:174–176. doi: 10.1038/sj.leu.2403997. [DOI] [PubMed] [Google Scholar]
- 31.Zhang XG, Gaillard JP, Robillard N, et al. Reproducible obtaining of human myeloma cell lines as a model for tumor stem cell study in human multiple myeloma. Blood. 1994;83:3654–3663. [PubMed] [Google Scholar]
- 32.Tarte K, De Vos J, Thykjaer T, et al. Generation of polyclonal plasmablasts from peripheral blood B cells: a normal counterpart of malignant plasmablasts. Blood. 2002;100:1113–1122. [PubMed] [Google Scholar]
- 33.Barlogie B, Tricot G, Rasmussen E, et al. Total therapy 2 without thalidomide in comparison with total therapy 1: role of intensified induction and posttransplantation consolidation therapies. Blood. 2006;107:2633–2638. doi: 10.1182/blood-2005-10-4084. [DOI] [PubMed] [Google Scholar]
- 34.Wijdenes J, Clement C, Klein B, et al. Human recombinant dimeric IL-6 binds to its receptor as detected by anti-IL-6 monoclonal antibodies. MolImmunol. 1991;28:1183. doi: 10.1016/0161-5890(91)90004-4. [DOI] [PubMed] [Google Scholar]
- 35.Garcia-Echeverria C, Pearson MA, Marti A, et al. In vivo antitumor activity of NVP-AEW541-A novel, potent, and selective inhibitor of the IGF-IR kinase. Cancer Cell. 2004;5:231–239. doi: 10.1016/s1535-6108(04)00051-0. [DOI] [PubMed] [Google Scholar]
- 36.Mahtouk K, Cremer FW, Reme T, et al. Heparan sulphate proteoglycans are essential for the myeloma cell growth activity of EGF-family ligands in multiple myeloma. Oncogene. 2006;25:7180–7191. doi: 10.1038/sj.onc.1209699. [DOI] [PMC free article] [PubMed] [Google Scholar]
- 37.Santra M, Zhan F, Tian E, Barlogie B, Shaughnessy J., Jr A subset of multiple myeloma harboring the t(4;14)(p16;q32) translocation lacks FGFR3 expression but maintains an IGH/MMSET fusion transcript. Blood. 2003;101:2374–2376. doi: 10.1182/blood-2002-09-2801. [DOI] [PubMed] [Google Scholar]
- 38.Reme T, Hose D, De Vos J, et al. A new method for class prediction based on signed-rank algorithms applied to Affymetrix microarray experiments. BMC Bioinformatics. 2008;9:16. doi: 10.1186/1471-2105-9-16. [DOI] [PMC free article] [PubMed] [Google Scholar]
- 39.Assou S, Le Carrour T, Tondeur S, et al. A meta-analysis of human embryonic stem cells transcriptome integrated into a web-based expression atlas. Stem Cells. 2007;25:961–973. doi: 10.1634/stemcells.2006-0352. [DOI] [PMC free article] [PubMed] [Google Scholar]
- 40.Jourdan M, Mahtouk K, Veyrune JL, et al. Delineation of the roles of paracrine and autocrine interleukin-6 (IL-6) in myeloma cell lines in survival versus cell cycle. A possible model for the cooperation of myeloma cell growth factors. Eur Cytokine Netw. 2005;16:57–64. [PubMed] [Google Scholar]
- 41.Georgii-Hemming P, Wiklund HJ, Ljunggren O, Nilsson K. Insulin-like growth factor I is a growth and survival factor in human multiple myeloma cell lines. Blood. 1996;88:2250–2258. [PubMed] [Google Scholar]
- 42.Freund GG, Kulas DT, Mooney RA. Insulin and IGF-1 Increase Mitogenesis and Glucose Metabolism in the Multiple Myeloma Cell Line, RPMI-8226. JImmunol. 1993;151:1811–1820. [PubMed] [Google Scholar]
- 43.Mahtouk K, Hose D, Reme T, et al. Expression of EGF-family receptors and amphiregulin in multiple myeloma. Amphiregulin is a growth factor for myeloma cells. Oncogene. 2005;24:3512–3524. doi: 10.1038/sj.onc.1208536. [DOI] [PMC free article] [PubMed] [Google Scholar]
- 44.Moreaux J, Cremer FW, Reme T, et al. The level of TACI gene expression in myeloma cells is associated with a signature of microenvironment dependence versus a plasmablastic signature. Blood. 2005;106:1021–1030. doi: 10.1182/blood-2004-11-4512. [DOI] [PMC free article] [PubMed] [Google Scholar]
- 45.Gu ZJ, Vos JD, Rebouissou C, et al. Agonist anti-gp130 transducer monoclonal antibodies are human myeloma cell survival and growth factors. Leukemia. 2000;14:188–197. doi: 10.1038/sj.leu.2401632. [DOI] [PubMed] [Google Scholar]
- 46.Mahtouk K, Hose D, Raynaud P, et al. Heparanase influences expression and shedding of syndecan-1, and its expression by the bone marrow environment is a bad prognostic factor in multiple myeloma. Blood. 2007;109:4914–4923. doi: 10.1182/blood-2006-08-043232. [DOI] [PMC free article] [PubMed] [Google Scholar]
- 47.Clemmons DR. Modifying IGF1 activity: an approach to treat endocrine disorders, atherosclerosis and cancer. Nat Rev Drug Discov. 2007;6:821–833. doi: 10.1038/nrd2359. [DOI] [PubMed] [Google Scholar]
- 48.Yang Y, Macleod V, Bendre M, et al. Heparanase promotes the spontaneous metastasis of myeloma cells to bone. Blood. 2005;105:1303–1309. doi: 10.1182/blood-2004-06-2141. [DOI] [PubMed] [Google Scholar]
- 49.Yang Y, Macleod V, Miao HQ, et al. Heparanase enhances syndecan-1 shedding: a novel mechanism for stimulation of tumor growth and metastasis. J Biol Chem. 2007;282:13326–13333. doi: 10.1074/jbc.M611259200. [DOI] [PubMed] [Google Scholar]
- 50.Lacy MQ, Alsina M, Fonseca R, et al. Phase I, Pharmacokinetic and Pharmacodynamic Study of the Anti-Insulinlike Growth Factor Type 1 Receptor Monoclonal Antibody CP-751,871 in Patients With Multiple Myeloma. J Clin Oncol. 2008 doi: 10.1200/JCO.2007.15.9319. [DOI] [PubMed] [Google Scholar]
- 51.Bataille R, Barlogie B, Lu ZY, et al. Biologic effects of anti-interleukin-6 (IL-6) murine monoclonal antibody in advanced multiple myeloma. Blood. 1995;86:685–691. [PubMed] [Google Scholar]